*format=pnasformat
Deep learning four decades of human migration
Abstract
We present a novel and detailed dataset on origin-destination annual migration flows and stocks between 230 countries and regions, spanning the period from 1990 to the present. Our flow estimates are further disaggregated by country of birth, providing a comprehensive picture of migration over the last 35 years. The estimates are obtained by training a deep recurrent neural network to learn flow patterns from 18 covariates for all countries, including geographic, economic, cultural, societal, and political information. The recurrent architecture of the neural network means that the entire past can influence current migration patterns, allowing us to learn long-range temporal correlations. By training an ensemble of neural networks and additionally pushing uncertainty on the covariates through the trained network, we obtain confidence bounds for all our estimates, allowing researchers to pinpoint the geographic regions most in need of additional data collection. We validate our approach on various test sets of unseen data, demonstrating that it significantly outperforms traditional methods estimating five-year flows while delivering a significant increase in temporal resolution. The model is fully open source: all training data, neural network weights, and training code are made public alongside the migration estimates, providing a valuable resource for future studies of human migration.
Keywords: International Migration, Deep learning, Human Migration, Neural networks
1 Department of Applied Mathematics and Theoretical Physics, University of Cambridge, Cambridge CB3 0WA, United Kingdom; 2 Department of Mathematics, Imperial College London, London SW7 2AZ, United Kingdom; 3 Department of Sociology, Faculty of Social Sciences, University of Hong Kong, Hong Kong SAR, China; 4 International Institute for Applied Systems Analysis, Laxenburg 2361, Austria
⋆Correspondence: trg34@cam.ac.uk
Introduction
[lines=2,lraise=0.05,findent=0.1em, nindent=0em]The movement of people—both within countries and between them—is an important topic across multiple domains. Migration drives demographic change, shaping the size and composition of populations; it can influence labour markets [1], inform social policy [2], and is a popular topic for public debate [3]. While migration often follows long-term trends driven by development [4], it can be dramatically altered by short-term shocks—armed conflict, famine, natural disasters, political instability, changes in national borders, peace agreements, or independence movements [5].
Human mobility, however, is notoriously difficult to define and track [6]. A fundamental challenge in monitoring migration patterns lies in defining a migration event: the United Nations recommends a 12-month threshold [7], where anyone relocating for the majority of a year or more qualifies as a migrant; but this definition is not applied consistently. Even more difficult is the collection of migration data. Some countries, such as Germany, mandate residential registration, requiring migrants to report their country of origin upon arrival. Others, like the United Kingdom, rely on visa records and passenger surveys. A third common approach uses border entry statistics collected by immigration authorities. Each method has limitations: registration systems typically undercount emigration, since few individuals de-register when leaving; passenger surveys and border data are not comprehensive and may conflate short-term and long-term travellers. As a result, estimates from sending and receiving countries often diverge significantly. In 2005, for instance, Germany reported 160,000 arrivals from Poland, while Poland recorded only 12,300 departures to Germany (see fig. LABEL:fig:net_migration_example_comparisonA–B). In Europe, to reconcile such discrepancies, statistical demographers have developed models to estimate bilateral migration flows between countries. The most recent study, the QuantMig project [8, 9], used a Bayesian framework to estimate bilateral migration flows for 30 European countries from 2009 to 2019. While offering a harmonised approach, the model still reveals substantial uncertainty—in some cases, with credible intervals spanning over 100%.
Yet these methodological difficulties are overshadowed by a much more fundamental problem: a widespread lack of migration data, particularly across the Global South. In many countries, migration statistics are incomplete or non-existent, and when sudden disasters trigger large-scale movement, reliable data collection becomes impossible. A recent study attempted to bypass these constraints by analysing digital traces [10]. It used monthly Facebook location data to estimate bilateral flows among 180 countries between 2019 and 2022, capturing, for example, the displacement of Ukrainians following the Russian invasion and the Venezuelan migration crisis. Labour migration data represents another important source [11], as migrant workers often make up a significant share of international movers. However, here too definitions and data standards vary widely between countries [12], and undocumented migration—by its very nature—remains largely invisible to official statistics.
One macroindicator many countries (especially on the receiving side) are interested in estimating is the net migration, the balance of immigration and emigration. A small number of countries publish net migration figures, estimated from immigration and border statistics (see figs. LABEL:fig:SI:net_migration in the SI), while on a global scale, the United Nations Department of Economic and Social Affairs (UN DESA) provides figures from 1950 onwards in its World Population Prospects (WPP) reports. These are primarily based on demographic estimates rather than immigration statistics. Since births and deaths are more widely and consistently tracked than migration figures, in principle the net migration can be estimated by subtracting the natural change (births minus deaths) from the total population change. While this approach is theoretically sound, in practice it is hindered by irregularities in measuring the total population and its change over time, which are sensitive to inconsistencies in census methodology. Consequently, demographic net migration estimates can differ significantly from immigration-based statistics, even for countries whose population data are of high quality (see fig. LABEL:fig:net_migration_example_comparisonC).
In this work, we combine deep learning with a mechanistic flow model to estimate annual bilateral migration flows for the period 1990–2023 between all 230 countries and regions recognised by the UN. Our data are disaggregated by country of birth, meaning that, besides the flows and the net migration for each country, we also obtain a complete dataset of annual migrant stocks, that is, the number of migrants born in country residing in country in year . A deep neural network is trained on an extensive set of socio-economic and cultural covariates for each country, allowing us to disentangle the drivers of migration and opening the door to future forecasting of migration flows. The network is trained to match a set of target data, comprising the UN DESA migrant stocks, Facebook data, as well as a small number of mainly European bilateral flows and net migration data. The target data are used to construct a loss function, which is iteratively minimised during training. Once trained, the neural network acts as a function mapping input covariates to migration flows. By training a family of neural networks and additionally ‘pushing’ the uncertainty on the input data through the network, our approach also enables uncertainty quantification, allowing us to pinpoint the countries where data is inconsistent and collection should be improved.
This marks a paradigm shift for the computational toolset hitherto used to model migration. Most previous techniques for estimating global migration flows have relied solely on migrant stock data published by the UN DESA, which provides estimates at five-year intervals from 1990 (fig. LABEL:fig:net_migration_example_comparisonD). The simplest estimation techniques are based on stock differencing [18] and assume that the bilateral flow is equal to the difference in stocks . Negative differences are either dropped (meaning zero flow) [19, 20] or counted towards flows in the opposite direction [21]. The simplifying assumption here is that bilateral migration flows only take place from a person’s country of birth to a destination; that is, the stock of Swedes in Britain changes only due to Swedish people arriving from and returning to Sweden; but not due to Swedish people arriving from, say, Norway. To account for this, a more sophisticated array of so-called demographic accounting methods was proposed in [22, 23, 24]. These attempt to infer a three-dimensional flow matrix , with each entry modelling the flow of people born in moving from to , allowing for greater flexibility, but also significantly increasing the number of parameters to be estimated. The flow table is constrained such that its estimates reproduce the stock differences. The stock differences are typically first adjusted to account for births and deaths, such that the estimated flow only reproduces the change in stocks not caused by demographic change.
Stock-based flow estimation approaches all take the stock data at face value; they are also unable to increase the temporal resolution of the estimates, and have thus far only yielded five-year or ten-year flows (the resolution of the UN DESA or World Bank data). These long intervals for estimating migration flows hinder researchers’ ability to accurately explain and predict migration flows, particularly when migration dynamics can alter suddenly and briefly. An alternative approach to estimating migration flows is the use of gravity models [25], which are broadly defined as any regression-based approach that relates the flow to a set of covariates . These models can, in principle, capture flows at any resolution, provided the covariates are of sufficient quality and are suitably chosen; however, as shown in [26], they tend to perform poorly when modelling migration, even with a large and sophisticated set of covariates. The fundamental problem when modelling migration as
is that it represents humans as Markovian, acting only based on the current state of the world with no regard to the more distant past. This may be warranted when considering the response to a sudden, cataclysmic event, but is hardly reasonable when incorporating long-term, macro-level political, economic, or social indicators. The decision to leave is, in most cases, not merely predicated on the current economic climate: crises from past years can influence a person’s decision, due to a multitude of delayed effects and complex feedback loops. Any model that does not account for the system’s memory will thus fail to accurately reproduce, let alone explain, the temporal and spatial variance in human migration. In this work, we employ a recurrent neural network [27, 28], which implements a form of ‘memory’ by maintaining a ‘hidden’ or ‘latent’ state that changes over time. encodes the system’s entire history, and allows modelling the flows of today as a function of, e.g., economic crises from years past.
The article is structured as follows: we first present the estimation results, showcasing the data on a selection of case studies. We validate our method’s performance on test data of unseen flows, and compare it to a selection of standard methods discussed above. The inference method is presented in detail in the Methodology section. In the following, we denote by the stock estimates, by the flows disaggregated by birth, by the total origin-destination flows, and by the net migration. For notational clarity, we will omit the time argument wherever possible. Estimated quantities will be denoted by a hat, e.g. .
Results
A global map of migration
Our estimates reveal that, since 2000, global migration movements have risen from 13 million people annually to over 36 million in 2023 (fig. LABEL:fig:regional_flows). This trend is not explained by a rising global population, as per-capita migration saw a similarly steady increase from 0.21% in 2000 to 0.45% in 2023 (see figs. LABEL:fig:SI:regional_flows_per_cap in the SI). Since the turn of the millennium, total global migration has only seen two periods of sustained decrease: during the Great Recession in 2008–2009, and during the Covid-19 pandemic in 2020. The largest single-year event we registered is the 2019 movement of people from Venezuela to Colombia, totalling around 850,000, closely followed by migration from Mexico to the US in 2022, and from Ukraine to Russia in 2022. Globally, the Middle East experienced the highest total inflow of migrants, chiefly from South Asia and the Philippines, with immigration from Bangladesh to Saudi Arabia alone averaging around 300,000 people per year from 2010 onwards (see fig. LABEL:fig:global_flows–LABEL:fig:regional_flows). We estimate that, since 2010, a total of 18.4m people, averaging 1.3m per year, migrated from India, Pakistan, and Bangladesh to Saudi Arabia, Qatar, Bahrain, and the UAE—this compares to 14.8m movements from Mexico to the US over the entire period since 1990.
Europe consistently ranks as the region with the highest volume of intra-regional migration, surpassed only once by Sub-Saharan Africa in the early 1990s during the Rwandan civil war. Pre-2020, gross flows within Europe reached around 3 million people annually, having steadily increased during the 2000s and 2010s following the eastward expansion of the EU and the Schengen region. Flows from Eastern to Western Europe since 1990 total around 20m, or 600,000 per year. Figure LABEL:fig:Europe_1991 shows a snapshot of intra-European flows in 1991, following the collapse of the Soviet Union, colour-coded by country of birth. In that year, by our estimates, intra-European flows reached around 2.02m people, of which 807,000 alone were of people born in Poland, Russia, Ukraine, and Romania. The largest movements took place between Ukraine and Russia, Kazakhstan and Russia, and into Germany. During this time, we see significant levels of return migration (bidirectional movement), as some sought to return to their country of birth, while others relocated abroad in search of economic opportunity. Panel B shows the flow estimates for a selection of corridors, alongside values from the various datasets used to train the neural network. Our estimates match not only the data, but also the uncertainty on the Quantmig values exceedingly well (see also fig. LABEL:fig:performanceD and discussion thereon).
Migration in the Global South
Europe is perhaps the region with the least need for a detailed analysis of migratory patterns, since data are (relatively) plentiful. The value of our dataset lies primarily in what it tells us about movements in other parts of the world, especially the Global South. In the mid-2010s, for instance, Sub-Saharan Africa saw several large-scale migration events. Civil war raged in the newly independent country of South Sudan from 2013 onwards, causing a large exodus into neighbouring Ethiopia (fig. LABEL:fig:Africa_2014). The UNHCR classifies the entire migrant population of South Sudanese in Ethiopia as refugees. Violence also erupted in West Africa, with the jihadist group Boko Haram starting an armed insurgency against the Nigerian government in 2009, and dramatically escalating its attacks in 2014, including by abducting nearly 300 young women from a school [29, 30]. In 2014 alone, we estimate that around 77,000 persons born in Nigeria moved or fled to neighbouring Chad, Niger, Cameroon, the majority of which (50,000) to Niger. From 2009–2019, we estimate an outflow of Nigerian-born persons to these three countries of 270,000 with a standard deviation of 40,000. This figure is dwarfed by the IOM estimate of around 2.4m internally displaced people as a consequence of the violence [31]. Meanwhile, the ongoing civil war in the Central African Republic lead to a continuous outflow to neighbouring Cameroon, DR Congo, and Chad. In East and South-East Asia, home to nearly three-tenths of the worlds population, the largest flows originate from Indonesia and Vietnam, moving to Malaysia, Japan, and Taiwan. The Malaysia-Indonesia corridor is the largest in the region, transporting an estimated 6.6m people from 2000–2024, followed by Thailand-Myanmar (5m in the same period).
Revising the UN figures
In figure LABEL:fig:Asia_2023 we also show the net migration figures for selected countries alongside the estimates from the 2024 WPP report. Our dataset provides a valuable correction to these figures, which, as mentioned in the introduction, are calculated from demographic residuals rather than immigration statistics; the formula used is:
with the total population, and and the crude birth and death rates, respectively. A further selection of net migration figures is shown in LABEL:fig:Net_migration. The variation in the UNPD figures is often caused by anomalies in the population figures, which strongly affect the change in population and cause, for instance, Vietnam’s net migration to spike around 2008, only to then fall back to zero in 2010. While the UN figures would suggest positive migrant inflow to Russia since 1995, our estimates show that, in fact, Russian net migration turned negative around 2005, a trend only reversed by the inflow of Ukrainian refugees in 2022.
Meaningful uncertainty quantification
In figure LABEL:fig:Net_migrationB, we show the correlation between our net migration figures and the most recent UNPD estimates [32]. We see a strong positive correlation across the OECD (this is unsurprising as these countries comprise the target data), as well as across much of the African continent. Our estimates of Indian net migration broadly follow the UNPD trend, but are less erratic; the exodus of workers to the Gulf states, commencing in 2003, is visible. The net migration estimates for Nigeria, meanwhile, are among the most uncertain of our model predictions: in figure LABEL:fig:Net_migrationD we show the median relative error (standard deviation over mean estimate) for all countries, noting that for Africa, especially sub-Saharan Africa, the uncertainty on the net migration is among the highest in the world. This finding underlines the need for more data collection in that region.
Testing and Validation
We validate our approach by testing how well the neural network can reproduce unseen data (the test data). To this end, we withhold 20% of flow corridors from the target dataset and evaluate the trained network on the test flows. Figure LABEL:fig:performanceA shows that it achieves about 95% correlation on the training data, and 80% correlation on the test flows, with only a 5% increase in median relative error (recall that many flows come with considerable uncertainty, and can be small in magnitude, so such a high relative error is not surprising: after all, an estimate of 10 for a flow value of 5 represents a 100% relative error). While this is the correlation across the entire dataset, we can also examine the distribution of correlations along each corridor (fig. LABEL:fig:performanceB), finding that the neural network generally matches the correlation distributions of the training data on the test set. In figure LABEL:fig:performanceC, we compare the estimated uncertainty of our model with that on the Quantmig data, as well as our estimates of the stock uncertainty. The predicted uncertainty on the flows matches the Quantmig values very well, while producing significantly higher levels of uncertainty on the stocks than obtained through the demographic accounting procedure outlined above.
We further validate the neural predictions on an additional dataset of unseen bilateral flows and compare their performance with those of the various stock-based approaches outlined in the introduction. The datasets and evaluation metrics are presented in [18, 33] and are broadly comprised of bilateral origin-destination or birthplace-destination flows for a small number of (mostly Western) countries. Since these datasets do not employ a consistent definition of migration, we follow [18] in not calculating mean errors directly, but rather examining the various correlation metrics across various unilateral and bilateral migration measures commonly used when studying migration patterns and trends. The neural network estimates significantly outperform all other stock-based methods; the only exception are the UN WPP net migration estimates, where the demographic accounting methods, by design, show a perfect correlation of ; however, given the methodological issues related to the UN WPP net migration estimates, this is not necessarily desirable.
Lastly, we are interested in gauging how sensitive the model is to the various input covariates. To this end, we calculate the neural network’s elasticity in each covariate dimension, that is, the relative change induced in by a relative change in the -th covariate:
| (1) |
Figure LABEL:fig:elasticity shows that, on average, the model predictions are most sensitive to changes in the life expectancy and mortality rates, presumably since these act as proxies for a country’s (relative) quality of life. Of the economic covariates, GDP per capita is the most determinant; religious similarity appears more determinant than linguistic similarity, and data on conflict and refugee stocks is the least determinant.
Discussion
Data on human movements is notoriously unreliable, noisy, and—crucially—absent for large parts of the world. Our work significantly increases the spatial and temporal resolution of existing migration data. We provide a complete set of annual migrant stock values, net migration estimates for each country, and bilateral flow estimates disaggregated by birth country. Reliable migration data are of great interest to economists for use as covariates in econometric models, to epidemiologists studying the spread of infectious diseases, and to demographers creating population growth projections. Our dataset—along with the supplementary training data, including real GDP estimates for 230 countries and territories—will be a valuable asset. More importantly, this study provides a foundational tool for breaching the next frontiers in migration modelling. For one, researchers are increasingly seeking to move beyond country-level migration flows toward more geographically granular modelling. Many of the largest population movements occur within countries, rather than between them [34]. Replacing countries with a finer spatial grid as the fundamental unit would represent a significant advance in statistical demography. Our framework is well-suited to support this transition. A recent high-resolution dataset of demographic data at a 10km2 resolution was released [35], which could be used to train the network. A similar recurrent architecture would be required to capture spatial correlations, allowing the outflow from one cell to influence movements in distant neighbouring regions. As shown, deep neural networks are generally adept at learning such long-range, complex correlations in both space and time—including through more advanced transformer architectures and graph neural networks [36, 37]. These architectures may further expand the capabilities of our method in scenarios with intricate spatial structure. Additionally, as we have demonstrated, machine learning methods can bring together multiple sources of migration data and measures. Combining data enables more robust estimates of migration, leveraging the benefits of both traditional data sources on migration and newer sources based on digital trace data. Finally, deep learning methods capture complex non-linear trends and threshold effects, which can be utilised when predicting or creating scenario-based projections of future migration patterns. Without a strong theoretical basis, shifts in future migration patterns are often overlooked in population forecasting exercises, relying instead on assumptions that follow long-term trends or converge to zero to mitigate the impact of migration on future population sizes [38]. However, migration is becoming the most significant component of population change, which will be better served with modelling frameworks that can incorporate future human system responses to as yet unforeseen events, such as climate changes or new conflicts in previously peaceful areas.
Data availability
The complete flow datasets are available at doi.org/10.5281/zenodo.15623215. A trained neural network, all training covariates, the code used to train the network, as well as a Jupyter notebook to evaluate the models and reproduce the plots in this publication, are available at github.com/ThGaskin/Migration_flows. Detailed descriptions on data collection are provided in the README files, as well as the Supplementary Material.
Acknowledgements
The authors would like to thank Robert Beyer (International Organization for Migration) for useful discussions on the inference procedure, and for suggesting the use of demographic accounting to estimate the uncertainty on the stock target data.
Methodology
UN DESA provides estimates of global migrant stock , that is, the number of people born in country living in country at time [16]. This data are given at five-year intervals from 1990 to 2020, as well as a recent estimate for 2024. The stocks evolve according to the equation
| (2) |
where and are, respectively, the total number of births and the mortality rate of the destination, and is the Kronecker matrix
| (3) |
The first term in eq. (2) simply means that all births in a country increase the native-born stock ; the second models population decrease due to deaths; the third models the change in stocks due to migration. is the flow of migrants born in from country to , and is the quantity we wish to infer. The total flow of people from to , regardless of their place of birth, is of course then given by
| (4) |
while a country’s net migration (arrivals minus departures) is
| (5) |
Target data
Aside from the stock data, there are numerous datasets of partial observations of the flow and the net migration to fwhich we could constrain our estimate , though as mentioned in the introduction, these do not always use consistent definitions of a migration event. The UN DESA World Population Prospects dataset [32] and the United States Census Bureau International Database [14] both provide estimates of annual net migration for all countries from 1950–2024. These figures are mainly calculated as the residual between the total change in population and natural growth (births minus deaths), and for most countries, they are not derived from immigration statistics; we thus do not include them as target variables. Instead, we use net annual migration statistics from around 30 countries and territories in Europe, North America, Oceania, and East Asia, sourced from national statistical bureaus (see SI).
Observations of total origin-destination flows are taken mainly from four sources, which all employ a one-year definition of migration flows:
-
•
Harmonised intra-European flows: the Quantmig database [8, 9] provides probabilistic estimates of migration flows between 30 countries in Europe from 2009–2019, based on publicly-available Eurostat data. These have been harmonised to use a common definition of migration, and also provide uncertainty estimates, which we use to weight the target data points in the loss function used to train the neural network (see below).
- •
-
•
Facebook data [10]: estimates of annual bilateral migration flows between 181 countries from 2019–2022 from an analysis of online social media data. We only include annual flows of at least 25 people, since noise was added by the authors to prevent data disclosure which distorts small values.
Target values are prioritised in this order, meaning that if two datasets both contain values for the same origin-destination pair, we use the source furthest up in the list.
Input covariates
Each value is a flow through a network multi-edge connecting the birth country , the origin , and the destination . We train a deep neural network to learn a mapping , where is a vector of economic, social, and geographic covariates pertaining to the three connected countries. In the following we give a summary of the covariates used; see tab. LABEL:table:covariates for an overview, and the Supplementary Information for further details.
Demographic covariates
For each country , , , we include the total population and life expectancies; for the origin and destination countries, we also include birth and death rates, all taken from the UN WPP dataset [32].
Economic covariates
For each country , , , we include annual real GDP per capita (in constant 2015 US Dollars) and annual GDP growth rate (in %). data are taken from the World Bank and UNCTAD [42, 43, 44], as well as national statistical bureaus. Missing values are calculated by deflating nominal to real GDP using the World Bank deflator; where the deflator is not given, we estimate the deflator from neighbouring or similar nations. Gaps are also filled by calculating the GDP growth rate from the Maddison Project dataset [45, 46], which provides GDP in constant 2011 purchasing power parity. The growth rates are then used to extrapolate GDP back or forward in time. We also input bilateral trade flows between origin and destination, given in real 2015 USD. These are mostly taken from the harmonised BACI dataset [47, 48], and missing values are again extrapolated using the growth rates from the UN Comtrade and IMF Direction of Trade datasets [49].
Geographic, cultural, and political covariates
Religious and linguistic proximity, measuring the extent of overlap in religious affiliation and common spoken languages, are taken from the Correlates of War World Religion Data and USITC Domestic and International Common Language Database datasets [50, 51]. Religious similarity measures the overlap in the number of adherents of major religions; for two countries with religious makeup and , the similarity score is simply the dot product . The linguistic similarity score is given by the ‘common spoken language’ index; missing entries are filled with the average of linguistic proximity and common native language [51]. We also include the population-weighted geodesic distance [49], as well as a number of binary covariates: EU membership of the three indexed nations; binary variables and , which are if the first indexed country was ever a colony of the second; as well as the two binary variables and , with the Kronecker delta (eq. (3)), which indicate whether an individual is a native of the origin or the destination.
Conflict deaths, refugee and migrant stock
To model short-term, disaster-driven migration, we include data on wars and other shocks that trigger large population movements. We include the total number of deaths related to organised violence in the origin and destination countries, given by the Uppsala Conflict Data programme’s Georeferenced Event Dataset [52, 53]. We include the total number of refugees, asylum seekers, and others in need of international protection, as given by the UNHCR’s refugee statistics [17], and also include the annual change in the figures. Lastly, we also input the total migrant stock both in the origin and the destination, and , for each year. Since the UN only provides these data points at most every five years, intermediate values are taken from the neural network prediction itself. Where initial values are missing, we extrapolate the stocks back to 1990 using a weighted average of similar countries; the weights are calculated by considering correlations across time and space.
Training
We apply the training methodology broadly outlined in [57]. We wish to not only incorporate information about the current state of the world at time , contained in , but also about the past. To do this, we use a recurrent neural network , which takes as input the covariates (including stocks) as well as a -dimensional hidden or latent state . This latent variable represents a ‘memory’ of past changes and their effects on the present flow estimate. The neural network outputs a (log-scaled) estimate of the flow , as well as the updated latent state , which is then input to the neural network to predict the next point in time:
| (6) |
Note that the estimates and all their derived quantities will be real-valued, despite integer target data. This gives a recursive training procedure, where each output is fed back into the neural network to inform the next estimate (see fig. LABEL:fig:methodA). The latent state is initialised at zero and can take any value in .
The neural network consists of a set of trainable parameters that are optimised using the gradient of the loss function . is designed to ensure that predicted and observed stocks, net migration values, and flows agree, and is structurally an -loss of all the different values . We make two important modifications to this basic loss function: first, we scale the data to make the errors more normal, ensuring the loss function is not dominated by the largest values (this will be addressed below); and secondly, we weight each term in the loss function by its uncertainty to bias the loss toward values in which we have greater confidence.:
| (7) |
with the index ranging over all the target values in a single batch. The weights are constructed from the relative uncertainty on each point, clamped to the interval , and normalised such that the mean weight is . The Quantmig dataset provides standard errors on the estimates we use to populate the weights for the flow targets; for all other flow targets, we set the weight to the average weight of the Quantmig weights or 1. For the stocks, we apply the demographic accounting scheme presented in [23]: given the stock tables for two successive years , , we add births and deaths and constrain the resulting tables to match their midpoint marginals using iterative proportional fitting. Subsequently subtracting births and deaths again gives two demographically balanced stock estimates for each year, from which we can estimate the uncertainty on each value . For the net migration targets, we set the weights to (see SI for details).
Scaling the input and target data
Much of the input and target data are heavily skewed Poisson distributions, with long tails caused by a small number of strong outliers; in order to improve learning, it is common practice to transform data to make it more normal. To this end we use a symmetrised Yeo-Johnson transform:
| (8) |
with the sign function. Compared to the standard transformation [58], the symmetrisation ensures that negative values are transformed more evenly. The parameter can be chosen to move the distribution of closer towards a normal distribution (see fig. LABEL:fig:methodB); for , is simply the identity. The transformed input data are further normalised to have zero mean and unit variance. Note that the transformation eq. (8) is invertible, with inverse ; we can thus always reverse any transformation to obtain the original data. We rescale all non-binary covariates except the religious and linguistic similarity indices to be approximately normal (see SI for the values used for each).
To improve prediction accuracy on edges with smaller flows, we also transform the target data using the above function ; the loss function then reads
| (9) |
Here, denotes the average over all target values. Observe that we are not matching stock values directly, but rather the difference in stocks over five-year intervals. This is to avoid conditioning the stock value on (possibly erroneous) initial values, and ensure independence of the stock estimates. An optimal initial stock value can be estimated after training using a least squares approach, in order to fit the time series to the data (see below).
Model selection and validation
To select the architecture of the neural network, that is the number of neurons and layers, the activation functions, and the latent dimension , we use hyperparameter tuning on synthetic data (see SI for details). We use a deep network with 7 layers, 60 neurons per layer, and a hyperbolic tangent on each layer except the last, where we use the CeLU function [59]
with . The latent dimension was set to . Also by using a hyperparameter sweep on synthetic data, the scaling parameters for the target data were all set to .
Uncertainty quantification
Uncertainty on the estimates stems from two sources: first, the degree to which the inference problem is ill-posed, meaning the number of possible solutions that fit the data; and second, the uncertainty on the input covariates themselves [57]. The uncertainty arising from the (potential) ill-posedness of the problem can be estimated by training an ensemble of neural networks, thereby generating a distribution on the parameters [60]. This is computationally costly, since a family of neural networks need to be trained in parallel. Meanwhile, in theory the uncertainty on the input data can be ‘pushed through’ the trained neural network, as in [61]. Given a prior distribution on the input and neglecting the uncertainty on , the posterior is simply
| (10) |
with indicating a pushforward. For our estimates, we do not know the uncertainty on the inputs except for the initial stock estimate. We train an ensemble of 15 neural networks in parallel to solve the inference problem, and for each draw samples of the initial stocks to estimate overall uncertainty. This gives samples of the flow table . In this article and the accompanying datasets, we provide the average value and one standard deviation.
Calculating the elasticity
The elasticity eq. (1) is further given by
with the untransformed -th covariate. Since the neural network takes -transformed covariates as input, we can apply the chain rule to to obtain
Calibrating the initial stock value
To generate a time series of migrant stocks , an initial condition is required to solve the stock evolution equation (2) forward in time. This initial value may be taken from existing sources such as UN DESA where available. However, rather than conditioning on a potentially noisy or inconsistent baseline, we instead calculate a constant offset that best aligns modelled and observed values, while accounting for demographic dynamics. Let be the observed migrant stock, the corresponding model prediction generated from an arbitrary initial value , the weight on each observation, and the mortality rate of the destination country . Define the survival fraction as the proportion of individuals alive in 1990 who are still alive in year :
and . The optimal offset of the initial stock value is then computed by minimizing the weighted squared error between observed and predicted stocks:
| (11) |
and the baseline-shifted stock then given by . is further constrained to ensure that all resulting stocks remain non-negative.
Supporting Information
In the following we detail collection and assembly of the input and target data used to train the neural network, as well the validation process used to select the neural network architecture.
Target data
Net migration data
To train the neural network, we use target net migration statistics for a small number of countries. This data are mostly taken from National Statistics Bureaus, as well as the UN 2024 World Population Prospects for a handful of additional countries and periods. In figures LABEL:fig:SI:net_migration we show national figures alongside the UN WPP 2024 and WPP 2022 Revision data for some selected countries. UN WPP 2024 figures generally agree well with national estimates for periods pre-2010; larger discrepancies typically occur around 2020 due to the pandemic, the war in Ukraine, and a probable lack or lag in new demographic data reaching demographers at UN DESA.
-
•
Australia: data from 2004 onwards provided by the Australian Bureau of Statistics [62]. Pre-2004 we use UN WPP 2024 data.
-
•
Austria: data from 2002 onwards provided by Statistik Austria [63]. Pre-2002 we use UN WPP 2024 data.
-
•
Belgium: data from 2000 onwards provided by StatBEL [64]. Pre-2000 we use UN WPP 2024 data.
-
•
Bulgaria: data from 2010 onwards provided by the National Statistical Office of Bulgaria [65].
-
•
Canada: data provided by Statistics Canada [66]. Since figures are given for years ending in the summer, we use the midpoint average as an approximation for calendar-year net migration figures.
-
•
Czech Republic: data provided by the Czech Statistical Office [67].
-
•
Denmark: data provided by Statistics Denmark [68].
-
•
Estonia: data from 2000 onwards provided by Statistics Estonia [69]; since the figures agree with the UN WPP 2024 data, pre-2000 we use UN WPP 2024 data.
-
•
Finland: data provided by Statistics Finland [70].
-
•
France: data are provided by INSEE (Institut National de la statistique et des études économiques) [15].
-
•
Germany: data are provided by the Statistisches Bundesamt [71].
-
•
Iceland: data provided by Statistics Iceland [72].
-
•
Ireland: data provided by the Central Statistics Office [73]; these are counted from April to April and thus need to be shifted back and interpolated accordingly.
- •
-
•
Japan: data are provided by the Japan Immigration Services Agency [76].
-
•
Latvia: data are provided by the Statistics Agency of Latvia [77].
-
•
Lithuania: data are provided by Statistics Lithuania [78].
-
•
Netherlands: data from 2003 onwards is provided by Statistics Netherlands [79] agree with the UN WPP 2024 figures, and these are thus used for the remaining years.
-
•
New Zealand: data from 2002 onwards is provided by Statistics New Zealand [80]. Pre-2002 we use UN WPP data.
-
•
Norway: data are provided by Statistics Norway [81].
-
•
Portugal: data from 2002 onwards provided by Statistics Portugal [82]. Pre-2002 we use UN WPP 2024 data.
-
•
Slovenia: data are provided by the Statistical Office of Slovenia [83].
-
•
South Korea: Statistics Korea [84] publishes net migration figures from 2000 onwards. Pre-2000 values are not used.
-
•
Spain: data from 2008 onwards is provided by INE (Institudo Nacional de Estadística) [85]. Pre-2008 we use UN WPP 2024 data.
-
•
Sweden: data provided by Statistics Sweden [86].
-
•
Switzerland: data are provided by the Bundesamt für Statistik [87] from 1991; for 1990, we use the UN WPP 2024 figure.
-
•
Taiwan: data for some years is provided by National Statistics Taiwan [88]. Missing years are filled using the UN WPP 2024 data.
-
•
United Kingdom: data are provided by the Office for National Statistics [89].
- •
Migrant stocks
Interpolation and Extrapolation
The stocks are both a target value and an input to the neural network. We use the UN DESA 2025 Revision data where available, and fill gaps using values from the 2020 Revision. For edges where stocks or are missing for all time points , we set the flow for all if or , and set the initial stock value to 0. This is problematic as it underestimates some fairly major edges (e.g. Argentina or Brazil to India), but there is no stock data available from which an inference could be made. However, there are many series where data are partially observed (i.e. values are missing for some, but not all time points ). For these series, we extrapolate missing stocks in the following way: let and , where is the geodesic distance between country and .
We want to extrapolate missing stock values by comparing them to ‘similar’ countries with complete data. ‘Similarity’ here means that (1) the stock time series correlate strongly, and (2) the countries are geographically close. We thus build a weight measure for a country pair using
Then, given a matrix of stock growth values , we define an average growth rate for the missing series as
The missing stocks are then extrapolated and interpolated using this growth rate. This can be done even in the case of only a single datapoint (see fig. LABEL:fig:SI:stock_interpolation).
After interpolation, the native-born population is then estimated as
where is the total population (in July of each year), taken from the UN WPP dataset. The native-born population naturally makes up the upper tail of the migrant stock distribution (see fig. LABEL:fig:SI:Covariate_scalingH).
Estimating beginning-of-year stocks
The UN DESA stocks are mid-year values, but in order to align the data with the net migration and flow values, we need to estimate the stocks at the beginning of each year. We do this using iterative procedural fitting: let be a stock table at mid-year, the vector of total births in year , and the annual death rate in year . We then scale to match the row marginal
where the factor of is a result of assuming that births are distributed evenly throughout the year, i.e. half the births occur in the first six months of each year. The column marginals represent the total population in January of each year, as given by the UN WPP dataset [32].
Calculating the weights
We generate demographically closed stock matrices using iterative proportional fitting. Let , be two successive stock tables, i.e. . In principle, adding the total number of births in the period to and the total deaths in to should result in stock matrices with the same marginals , . In practice, this is not the case. We can thus calculate the marginals , , , for each stock matrix with births and deaths added, and scale each to the mid-point , using IPF (‘midpoint scaling’). After scaling, we subtract births and deaths again, obtaining new estimates of the stock table for each year. Doing this for each pair of stock tables, we obtain two estimates of the stock for each year except the years at the boundaries (1990 and 2024), for which we only have one; one value comes from comparison with the previous stock table (‘backward’) and one from comparison with the next table (‘forward’). Additionally, we can also add births and subtract deaths only from , and repeat the same procedure, obtaining two more estimates (‘endpoint scaling’). In total, we thus obtain four additional estimates for each year except the boundary years, for which we have two (see fig. LABEL:fig:SI:stock_weights). The error on each stock value is then given by
| (12) |
where is the average over the various estimates obtained from IPF. The weights are calculated based on the relative error , where we first normalise to have mean 0 and variance 1; this ensures that the weights are balanced around 1. We also want to avoid excessive distortion of the loss function due to extremely large or extremely small weights, and hence truncate the weights to . The weights are thus given by
| (13) |
see fig. LABEL:fig:SI:weight_distributionA. We estimate the error on a stock difference by assuming the errors are independent, setting , and calculating the weights as above.
Flow data
The uncertainty on the flow targets is based on the uncertainty from the Quantmig estimates, which come with standard errors. As with the stocks, the weights are then given by
| (14) |
with the relative error (standard error divided by central estimate). For all flow corridors along which we partially know the median errors, we set the relative error to the median relative error on that corridor, and calculate the weights as above. Finally, for flow corridors with entirely unobserved errors, we set the relative error to the mean of the Quantmig dataset and the weight to 1 (see fig. LABEL:fig:SI:flow_weights).
Input data
GDP per capita and GDP annual growth
In this section we detail the assembly of the economic covariates used to train the neural network: GDP per capita, in real 2015 USD; and GDP % annual growth, given by
| (15) |
GDP data are sourced from the World Bank [43, 42] as well as UNCTAD [44]. However, these datasets are not complete for all countries and years required. Historical GDP growth rates can be calculated from the Maddison dataset [45] (giving GDP/capita in 2011 PPP) and the IMF dataset [54] (GDP/capita in 2021 PPP). Note that GDP growth can be calculated from any measure of real GDP (e.g. constant USD or constant PPP). GDP growth, when available, can be used to calculate GDP/capita for missing years. At times, only nominal GDP figures are available for a given year and country. Converting to real GDP requires the deflator for that country,
| (16) |
Where the deflator is unavailable, deflators from economically, geographically, or socially similar countries can be used to estimate real GDP. We also fill missing values using figures from national statistical bureaus and additional sources, as below.
GDP data are scaled using a Yeo-Johnson transform (see fig. LABEL:fig:SI:Covariate_scalingA–B).
Caribbean Netherlands
The Netherlands Antilles were a constituent country of the Kingdom of the Netherlands, consisting of the islands of Bonaire, St. Eustatius, and Saba (the BES islands), Aruba, Curaçao, and Sint Marteen. Aruba became an independent constituent country in 1986, and in 2010, Curaçao and Sint Marteen followed suit, at which point the Netherlands Antilles were dissolved and the remaining BES islands became a special municipality within the Kingdom. The World Bank and UNCTAD provide real GDP figures for Aruba from 1986, for Curacao from 2000, and for Sint Marteen from 2009. Statistics Netherlands [93] provides nominal GDP for the BES islands from 2012–2022, while UN DESA provides nominal GDP for the entire Netherlands Antilles from 1970–2009 [94], which agrees with the World Bank data for Curaçao, the largest of the remaining Antilles islands after 1986 (see fig. LABEL:fig:SI:AntillesA). Since the deflators are not available, we convert the UN DESA data to real GDP using the deflator for Aruba, and then extrapolate back to 1986 using the growth rate for Aruba (see fig. LABEL:fig:SI:AntillesB).
French overseas territories
Statista [95] provides real GDP in constant 2014 Euros for the period 2000–2022. We convert to 2015 USD and extrapolate back to 1989 using the average growth rate for each territory, calculated over the period from 2000–2008. We extrapolate forward to 2023 using the average growth rate for each country in the period 2017–2022 (see fig. LABEL:fig:SI:FR_overseas).
Eritrea
Eritrea formally achieved independence from Ethiopia in 1991. UNCTAD provides data from 1992, and we extrapolate back to 1989 using the growth rate from Ethiopia (see fig. LABEL:fig:SI:Eritrea).
Small Pacific Islands
The World Bank and UNCTAD datasets have missing data for American Samoa, Niue, Tokelau, Wallis and Futuna, Guam, and the Northern Mariana Islands. The Pacific Community provides nominal GDP figures [96], as well as country-specific inflation rates [97], which we use as a proxy for the GDP deflator. We then extrapolate back using growth rates of neighbouring countries:
-
1.
American Samoa, Niue, and Wallis-Futuna: average growth rate of New Caledonia, the Cook Islands, and Fiji,
-
2.
Tokelau: growth rate of Fiji.
US overseas territories
Guam and the Northern Marianas are US overseas territories that to a large part rely on US funding for their economies. We extrapolate both Guam and the Marianas using the growth rate from Puerto Rico. The US Virgin Islands we extrapolate back using the average growth rate of Puerto Rico, St. Kitts and Nevis, and Antigua and Barbuda.
Serbia and Montenegro
The state of Serbia and Montenegro existed from 1992 until 2006, at which point the two constituent republics separated and became independent nations. Growth rates for these two countries are estimated in the Maddison project dataset, and are used to extrapolate GDP figures back to 1960 (see fig. LABEL:fig:SI:SRB_MNE).
South Sudan
South Sudan ceded from Sudan in 2011. UNCTAD gives real GDP figures from 2011 onwards, and we extrapolate back in time using the growth figures from Sudan (see fig. LABEL:fig:SI:SSD).
East Timor
The only missing data point is the GDP growth rate for 1990. A report by the Australian government [98] suggests an average 10% economic growth rate from 1987–1997, due to heavy investment in construction. Given the data we already have, this implies GDP growth from 1987-1990 must have averaged 11.7%.
Western Sahara, Saint Pierre Miquelon
No data are available for these territories. Western Sahara is under Moroccan control, and Saint Pierre Miquelon is a small French territory located near the Canadian province of Newfoundland. We thus simply use Moroccan and Canadian GDP per capita figures respectively.
British overseas territories and Crown Dependencies
Four British territories have missing data: the Isle of Man, Gibralatar, the Falkland Islands, and Saint Helena, Ascension and Tristan da Cunha (in the following simply referred to as St. Helena), a small island territory in the Atlantic ocean. The Isle of Man government [99] provides the missing real GDP growth figures for 2022 and 2023, from which we can infer the missing real GDP/capita figures for those years. The government of Gibraltar [100] provides nominal data from 2009; we deflate using the British deflator as a proxy, and extrapolate back using the Isle of Man growth rate. Data for the Falklands real GDP is available from the government website, given at constant 2012 Falklands pounds (pegged to the British pound at an exchange rate of 1:1) [101]. We extrapolate back using the Isle of Man growth rates. Some historical data from 1980–1995 is available from the archives [102], which, when converted to real 2015 USD, agrees well with this extrapolation (see fig. LABEL:fig:SI:UK_overseas). Lastly, nominal GDP data are provided by the St. Helena government website up to 2017. We use the British deflator to convert to real GDP and extrapolate back using the GDP growth rate for Brazil, a nearest neighbour with a similar GDP per capita.
Faroe Islands
The World Bank provides real GDP/capita from 2008 onwards, and nominal GDP/capita from 1965 onwards, which we deflate using the Danish deflator to obtain a complete time series, see fig. LABEL:fig:SI:FRO.
Bilateral trade
Trade flows are taken from the BACI harmonised tradeflow dataset [47, 48], and extrapolated back using the real growth rates calculated from the UN Comtrade and IMF Direction of trade statistics as given in the CEPII gravity dataset [49]. Since each dataset contains both origin- and destination-reported trade flows, we take the average growth rate (see fig. LABEL:fig:SI:trade). Where values are missing, we simply set the trade flow to the last known value. If all values are NaN, we set the flow to .
Total population, Life Expectancy, Birth and Death rates
We include the total population of the country of birth, country of origin, and country of destination for each edge . These figures are taken from UN WPP dataset and scaled using a Yeo-Johnson transform (see fig. LABEL:fig:SI:Covariate_scalingC–F).
Distance
We use the distw_harmonic distance covariate from the CEPII dataset as a measure of distance. Since values for some years are missing, we take the average over the period 1990–2023. Values for the British Virgin Islands and the Isle of Man are missing; we approximate these by using the values for the neighbouring US Virgin Islands, and inserting a value of 80km for the distance US Virgin Islands–British Virgin Islands. For the Isle of Man, we use distance values for the United Kingdom and insert a value of 300km for the distance United Kingdom–Isle of Man. The covariate is then scaled using a Yeo-Johnson transform, see fig. LABEL:fig:SI:Covariate_scalingG.
Linguistic similarity
Linguistic similarity is taken the USITC Domestic and International Common Language Database [51]. We use the csl (common spoken language) index. As detailed in the dataset description, values for 46 countries are missing. Following the authors, for these cases we use the average of the linguistic proximity lpn and common native language cnl instead.
Religious similarity
The Correlates of War database [50] details the religious composition of each country, that is the share of adherents to major religions in each country. Missing values are taken from the CIA World Factbook [55]. The religious similarity between two countries is then simply , where we exclude the ‘other’ (othrgenpct) category. This gives a more accurate picture of religious proximity than the CEPII comrelig covariate, which only uses the share of Catholics, Protestants, and Muslims to construct a similarity score.
EU Membership
This is taken from the CEPII gravity dataset. We construct two covariates, and , which are 1 if the indexed countries are both EU members, 0 else. As a binary covariate, it is left unscaled.
Colonial ties
Colonial relations between two countries are taken from the USITC gravity dataset (colony_of_destination_ever). We include two covariates, and , which are 1 if (or ) was ever a colony of the destination , and 0 else. As a binary covariate, it is left unscaled.
Model validation
We validate our approach on a small synthetic dataset of migration flows between 30 destination and origin countries over 10 years. This is both to ensure our model is able to in principle infer the full flow table from observations of the stocks and flows, as well as to tune the hyperparameters. To do this, we select 30 random countries from the period 2010–2020, generate a random initial stock table , and generate flows from
| (17) |
where are the Yeo-Johnson-transformed covariate vectors, a scalar, and a vector of random coefficients drawn from an i.i.d uniform distribution, . Note that the vector contains the stocks and themselves, as in the full model; these are calculated recursively from . This produces a full synthetic dataset of stocks, flows, and net migration vectors on which we can validate the approach. We first assume all flow, net migration, and stock values are observed, and train the neural network for 10,000 epochs. We use a 3-layer neural network with 20 neurons in the hidden layers, and the same CeLU activation function on the final layer as in the main manuscript. We vary the choice of activation function in the hidden layer. As shown in fig. LABEL:fig:SI:noiseless_validation, the full flow table is then uniquely inferred from the data, though accuracy varies with the choice of activation function. Naturally, since we are observing the full flow table , the net migration data are fully determined by and thus redundant.
To generate a more realistic dataset, we repeat the above process, adding 10% (multiplicative) noise to the stocks, 20% noise to flows, and 5% noise to the net migration data. We then randomly mask out 80% of flow corridors (that is, entire origin-destination corridors), 80% of net migration corridors, and 10% of individual stock values (not corridors). To tune the hyperparameters of the model, we perform a grid search on the depth, width, and activation functions of the network, and compare prediction accuracy on the true flow table (uncorrupted by noise) after 10,000 training epochs. Results are shown in fig. LABEL:fig:SI:noisy_validation, indicating that the hyperbolic tangent activation function, together with a high number of layers, gives best prediction results.
To select the dimension of the latent space, we select 20% of flow corridors uniformly at random, and include only the remaining 80% in the training data; then we train an ensemble of neural networks with different latent space dimensions and compare performance. Fig. LABEL:fig:SI:latent_space_validation shows the error on the test set, the training loss, the average correlation on the test set, and the distribution of correlations on the flow corridors contained in the test set. As can be seen, a high latent space of dimension of 100 performs best of all the dimensions considered.
Finally, we set the Yeo-Johnson scaling parameters to a value of for all target datasets, based on the following heuristic. The value, intuitively, lies ‘half-way’ between the identity transform , and the logarithmic transform . In fig. LABEL:fig:SI:Yeo_Johnson_scaling we show the learned flow values on the noiseless datasets for different values of the transformation parameters, suggesting that values between 0.5 and 0.7 are optimal. Small values of penalise all relative errors more equally, meaning a relative error of 50% on a flow of 100 contributes more to the loss than an error of 10% on a flow of 1 million—though in absolute terms these errors are of course orders of magnitude apart. For small , the model tries to optimise all targets equally well (or, in practice, equally badly). Large values of , conversely, mean that small flows are disregarded, and only the large values optimised. Centre values around balances these considerations.
Additional figures
Here we show some additional plots for the regional flows (fig. LABEL:fig:regional_flows) in the main manuscript. Figure LABEL:fig:SI:regional_flows shows the outflow, inflow, net flow, and intra-regional flow for all regions; figure LABEL:fig:SI:regional_flows_per_cap shows the intra-regional flows per capita. Also shown is the per capita total global migration flow: as is visible, the same trend of rising global migration emerges, even when accounting for the global population increase.
References
- [1] S Castles, Migration, Crisis, and the Global Labour Market. Globalizations 8, 311–324 (2011).
- [2] D Ratha, S Mohapatra, E Scheja, Impact of Migration on Economic and Social Development: A Review of Evidence and Emerging Issues, (World Bank, Development Prospects Group, Migration and Remittances Unit, Washington, DC), Policy Research Working Paper 5558 (2011).
- [3] H Dempster, K Hargrave, Understanding Public Attitudes Towards Refugees and Migrants, (Overseas Development Institute (ODI), London, UK), Working Paper 512 (2017).
- [4] R Skeldon, Migration and Development, (United Nations Economic and Social Commission for Asia and the Pacific, Population Division, Department of Economic and Social Affairs, Bangkok, Thailand), Report UN/POP/EGM-MIG/2008/4 (2008).
- [5] GJ Abel, M Brottrager, J Crespo Cuaresma, R Muttarak, Climate, conflict and forced migration. Global Environmental Change 54, 239–249 (2019).
- [6] F Willekens, D Massey, J Raymer, C Beauchemin, International migration under the microscope. Science 352, 897–899 (2016).
- [7] United Nations Department of Economic and Social Affairs, Recommendations on Statistics of International Migration, Revision 1. (United Nations, New York), p. 10 (1998) Statistical Papers Series M, No. 58, Rev. 1.
- [8] G Aristotelous, PWF Smith, J Bijak, Technical Report: Estimation Methodology, (University of Southampton, Southampton), Quantmig deliverable d6.3 (2022).
- [9] PWF Smith, G Aristotelous, MCMC simulations from the posterior distributions of European migration flows (https://doi.org/10.5281/zenodo.8224827) (2023).
- [10] G Chi, GJ Abel, D Johnston, E Giraudy, M Bailey, Measuring global migration flows using online data. Proceedings of the National Academy of Sciences 122, e2409418122 (2025).
- [11] International Labour Organization, Statistics on Migrant Workers (https://ilostat.ilo.org/topics/labour-migration/) (2025) Accessed: 29 May 2025.
- [12] International Organization for Migration, Labour Migration (https://www.migrationdataportal.org/themes/labour-migration-old) (2024) Accessed: 29 May 2025.
- [13] DEMIG Project, DEMIG C2C, Version 1.2, Limited Online Edition (Oxford: International Migration Institute, University of Oxford) (2015) https://www.migrationinstitute.org.
- [14] United States Census Burea, International Database: World Population Estimates and Projections (https://www.census.gov/programs-surveys/international-programs/about/idb.html) (2024) Accessed: 15 March 2025.
- [15] Institut national de la statistique et des études économiques (Insee), Composantes de la croissance démographique (https://www.insee.fr/fr/statistiques/2381468) (2025) Accessed: 23 November 2024.
- [16] United Nations, Department of Economic and Social Affairs, Population Division, International Migrant Stock (https://www.un.org/development/desa/pd/content/international-migrant-stock) (2025) Accessed: 4 February 2025.
- [17] United Nations High Commissioner for Refugees (UNHCR), UNHCR Refugee Statistics Database (2024) Accessed: 26 March 2025.
- [18] GJ Abel, JE Cohen, Bilateral international migration flow estimates for 200 countries. Scientific Data 6, 82 (2019).
- [19] M Beine, F Docquier, Ç Özden, Diasporas. Journal of Development Economics 95, 30–41 (2011).
- [20] S Bertoli, J Fernández-Huertas Moraga, The size of the cliff at the border. Regional Science and Urban Economics 51, 1–6 (2015).
- [21] M Beine, C Parsons, Climatic Factors as Determinants of International Migration. The Scandinavian Journal of Economics 117, 723–767 (2015).
- [22] G Abel, Estimating global migration flow tables using place of birth data. Demographic Research 28, 505–546 (2013).
- [23] GJ Abel, N Sander, Quantifying Global International Migration Flows. Science 343, 1520–1522 (2014).
- [24] JJ Azose, AE Raftery, Estimation of emigration, return migration, and transit migration between all pairs of countries. Proceedings of the National Academy of Sciences 116, 116–122 (2018).
- [25] J Poot, O Alimi, MP Cameron, DC Maré, The Gravity Model of Migration: The Successful Comeback of an Ageing Superstar in Regional Science (IZA Discussion paper) (2016).
- [26] RM Beyer, J Schewe, H Lotze-Campen, Gravity models do not explain, and cannot predict, international migration dynamics. Humanities and Social Sciences Communications 9, 56 (2022).
- [27] K Cho, et al., Learning Phrase Representations using RNN Encoder–Decoder for Statistical Machine Translation in Proceedings of the 2014 Conference on Empirical Methods in Natural Language Processing (EMNLP), eds. A Moschitti, B Pang, W Daelemans. (Association for Computational Linguistics, Doha, Qatar), pp. 1724–1734 (2014).
- [28] I Sutskever, O Vinyals, QV Le, Sequence to sequence learning with neural networks in Proceedings of the 28th International Conference on Neural Information Processing Systems - Volume 2, NIPS’14. (MIT Press, Cambridge, MA, USA), p. 3104–3112 (2014).
- [29] Council on Foreign Relations, Nigeria security tracker (https://www.cfr.org/nigeria/nigeria-security-tracker/p29483) (2023) Accessed: 29 May 2025.
- [30] T Guardian, Thousands flee as Boko Haram seizes military base on Nigeria border (https://www.theguardian.com/world/2015/jan/05/boko-haram-key-military-base-nigeria-chad-border) (2015) Accessed: 29 May 2025.
- [31] International Organization for Migration (IOM), IOM Highlights Humanitarian Needs for 2.4 Million Displaced in Northeast Nigeria (2024) Accessed: 29 May 2025.
- [32] United Nations Department of Economic and Social Affairs, Population Division, World Population Prospects 2024 (https://population.un.org/wpp/) (2024).
- [33] GJ Abel, JE Cohen, Bilateral international migration flow estimates updated and refined by sex. Scientific Data 9, 173 (2022).
- [34] P Rees, et al., The Impact of Internal Migration on Population Redistribution: an International Comparison. Population, Space and Place 23, e2036 (2017).
- [35] V Niva, et al., World’s human migration patterns in 2000–2019 unveiled by high-resolution data. Nature Human Behaviour 7, 2023–2037 (2023).
- [36] MM Bronstein, J Bruna, Y LeCun, A Szlam, P Vandergheynst, Geometric Deep Learning: Going beyond Euclidean data. IEEE Signal Processing Magazine 34, 18–42 (2017).
- [37] L Wu, P Cui, J Pei, L Zhao, Graph Neural Networks: Foundations, Frontiers, and Applications. (Springer Singapore, Singapore), p. 725 (2022).
- [38] G Abel, Non-zero trajectories for long-run net migration assumptions in global population projection models. Demographic Research 38, 1635–1662 (2018).
- [39] Statistics Sweden, Immigrations and emigrations by country of emi-/immigration, region of birth, age and sex. Year 2000–2024 (2025) Accessed: 6 February 2025.
- [40] Statistics New Zealand, Permanent & long-term migration by every country of residence and citizenship (Annual-Dec) (2025) Accessed: 6 February 2025.
- [41] Statistics Finland, Immigration and emigration by country of departure or arrival, origin and region, 1990-2023 (11ab) (2024) Accessed: 21 March 2025.
- [42] The World Bank, World Bank Open Data: GDP per capita (constant 2015 US$) (https://data.worldbank.org/indicator/NY.GDP.PCAP.KD) (2023) Accessed: 6 February 2025.
- [43] The World Bank, World Bank Open Data: GDP growth (annual %) (https://data.worldbank.org/indicator/NY.GDP.MKTP.KD.ZG) (2023) Accessed: 6 February 2025.
- [44] United Nations Conference on Trade and Development (UNCTAD), Gross domestic product: Total and per capita, current and constant (2015) prices, annual (https://unctadstat.unctad.org/datacentre/dataviewer/US.GDPTotal) (2023) Accessed: 7 February 2025.
- [45] Maddison Project, Maddison Project Database 2023 (https://www.rug.nl/ggdc/historicaldevelopment/maddison/releases/maddison-project-database-2023) (2023) Accessed: 6 February 2025.
- [46] J Bolt, JL van Zanden, Maddison-style estimates of the evolution of the world economy: A new 2023 update. Journal of Economic Surveys n/a, 1–41 (2024).
- [47] G Gaulier, S Zignago, BACI: International Trade Database at the Product-Level. The 1994-2007 Version, (CEPII), Working Papers 2010-23 (2010).
- [48] Centre d’Études Prospectives et d’Informations Internationales (CEPII), BACI Dataset (https://www.cepii.fr/CEPII/en/bdd_modele/bdd_modele_item.asp?id=37) (2025) Accessed: 26 March 2025.
- [49] M Conte, P Cotterlaz, T Mayer, The CEPII Gravity Database, (CEPII research center), Working Papers 2022-05 (2022).
- [50] Z Maoz, EA Henderson, The World Religion Dataset, 1945–2010: Logic, Estimates, and Trends. International Interactions 39, 265–291 (2013).
- [51] T Gurevich, PR Herman, F Toubal, YV Yotov, The Domestic and International Common Language (DICL) Database, (U.S. International Trade Commission), USITC Economics Working Paper 2024–03–A (2024).
- [52] S Davies, G Engström, T Pettersson, M Öberg, Organized violence 1989-2023, and the prevalence of organized crime groups. Journal of Peace Research 61 (2024).
- [53] R Sundberg, E Melander, Introducing the UCDP Georeferenced Event Dataset. Journal of Peace Research 50 (2013).
- [54] International Monetary Fund (IMF), World Economic Outlook Database, October 2024 (https://www.imf.org/en/Publications/WEO/weo-database/2024/October) (2024) Accessed: 6 February 2025.
- [55] Central Intelligence Agency, The World Factbook 2024. (Central Intelligence Agency, Washington, DC), (2024).
- [56] T Gurevich, P Herman, The Dynamic Gravity Dataset: 1948–2016, (U.S. International Trade Commission), Economics Working Paper 2018-02-A (2018).
- [57] T Gaskin, GA Pavliotis, M Girolami, Neural parameter calibration for large-scale multi-agent models. PNAS 120 (2023).
- [58] I Yeo, RA Johnson, A new family of power transformations to improve normality or symmetry. Biometrika 87, 954–959 (2000).
- [59] PyTorch Contributors, CELU—-PyTorch 2.6 documentation, (2025) Accessed: 1 April 2025.
- [60] T Gaskin, GA Pavliotis, M Girolami, Inferring networks from time series: A neural approach. PNAS Nexus 3, 63 (2024).
- [61] T Gaskin, MT Wolfram, A Duncan, G Demirel, Modelling global trade with optimal transport (arXiv:2409.06554) (2024).
- [62] Australian Bureau of Statistics, Overseas Migration (https://www.abs.gov.au/statistics/people/population/overseas-migration/latest-release#data-downloads) (2024) Accessed: 4 February 2025.
- [63] Statistik Austria, Wanderungen mit dem Ausland (http://statcube.at/statcube/opendatabase?id=debevwan010) (2024) Accessed: 2 March 2025.
- [64] StatBEL, Migration (https://statbel.fgov.be/en/themes/population/population-movement/migration) (2024) Accessed: 2 March 2025.
- [65] Republic of Bulgaria National Statistical Institute, International migration by age and sex (https://www.nsi.bg/en/content/3072/international-migration-age-and-sex) (2024) Accessed: 13 March 2025.
- [66] Statistics Canada, Estimates of the components of demographic growth, annual (https://www150.statcan.gc.ca/t1/tbl1/en/tv.action?pid=1710000801) (2024) Accessed: 19 November 2024.
- [67] Czech Statistical Office, Population and population change of the Czech Lands (annual data) (https://vdb.czso.cz/vdbvo2/faces/en/index.jsf?page=statistiky#katalog=33157) (2025) Accessed: 13 March 2025.
- [68] Statistics Denmark, Immigration and emigration (https://www.dst.dk/en/Statistik/emner/borgere/flytninger/ind-og-udvandring) (2025) Accessed: 2 March 2025.
- [69] Statistics Estonia, RVR03: Migration by sex, age group and type of migration (https://andmed.stat.ee/en/stat/rahvastik__rahvastikusundmused__ranne/RVR03) (2024).
- [70] Statistics Finland, 11ab–Immigration and emigration by country of departure or arrival, origin and region, 1990–2023 (https://pxdata.stat.fi/PxWeb/pxweb/en/StatFin/StatFin__muutl/statfin_muutl_pxt_11ab.px/) (2024) Accessed: 16 February 2025.
- [71] Statistisches Bundesamt (Destatis), Wanderungen zwischen Deutschland und dem Ausland (Jahr) (https://www.destatis.de/DE/Themen/Gesellschaft-Umwelt/Bevoelkerung/Wanderungen/Tabellen/wanderungen-zwischen-deutschland-und-dem-ausland-jahr-02.html) (2024) Accessed: 19 November 2024.
- [72] Statistics Iceland, External migration by sex and citizenship 1961-2023 (https://px.hagstofa.is/pxen/pxweb/en/Ibuar/Ibuar__buferlaflutningar__buferlaflmillilanda/MAN01400.px/) (2024) Accessed: 2 March 2025.
- [73] Central Statistics Office Ireland, PEA03 - Estimated Migration (Persons in April) (https://data.cso.ie) (2024) Accessed: 2 March 2025.
- [74] Istat, Resident population by sex, live births, deaths, natural increasing, net migration, total balance and birth rates, mortality rate, natural growth rate and total migration rate - Years 1862-2014 at current borders (https://seriestoriche.istat.it/fileadmin/documenti/Table_2.3.xls) (year?).
- [75] Istat, Migrazioni interne e internazionali della popolazione residente anni 2022-2023 (https://www.istat.it/it/files/2024/05/Migrazioni-interne-e-internazionali-della-popolazione-residente.pdf) (2024).
- [76] Japan Immigration Services Agency, Immigration control statistical table: Number of people entering and leaving Japan, Annual Report (https://www.moj.go.jp/isa/policies/statistics/toukei_ichiran_nyukan.html?hl=en) (2024) Accessed: 10 March 2025.
- [77] Offical Statistics Portal Latvia, Long-term international migration by country group 1990–2023 (https://data.stat.gov.lv/pxweb/en/OSP_PUB/START__POP__IB__IBE/?tablelist=true) (2025) Accessed: 13 March 2025.
- [78] Official Statistics Portal Lithuania, International migration flows (https://osp.stat.gov.lt/en_GB/gyventoju-migracija) (2025) Accessed: 13 March 2025.
- [79] Statistics Netherlands, How many people immigrate to the Netherlands? (2024) Accessed: 2 March 2025.
- [80] Stats NZ, International Migration: September 2024 (https://www.stats.govt.nz/information-releases/international-migration-september-2024/#annual) (2024) Accessed: 19 November 2024.
- [81] Statistics Norway, 05426: Immigration, emigration and net immigration (https://www.ssb.no/en/statbank/table/05426/) (2024) Accessed: 11 March 2025.
- [82] Statistics Portugal, Net migration by place of residence, annual (https://www.ine.pt/xportal/xmain?xpid=INE&xpgid=ine_base_dados) (2024) Accessed: 13 March 2025.
- [83] Republic of Slovenia Statistical Office, International migration by sex, Slovenia, annually (https://pxweb.stat.si/SiStatData/pxweb/en/Data/Data/05N1002S.px/) (2024) Accessed: 13 March 2025.
- [84] Statistics Korea, International Migration Statistics (https://kostat.go.kr/board.es?mid=a20108050000&bid=11745&act=view&list_no=431900) (2024) Accessed: 3 March 2025.
- [85] Instituto Nacional de Estadística (INE), INEbase: International Migratory Balance (https://www.ine.es/dyngs/INEbase/en/operacion.htm?c=Estadistica_C&cid=1254736177000&menu=ultiDatos&idp=1254735573002) (2023) Accessed: 4 February 2025.
- [86] Statistics Sweden, Immigrations and emigrations by country of emi-/immigration, region of birth, age and sex. (https://www.statistikdatabasen.scb.se/pxweb/en/ssd/START__BE__BE0101__BE0101J/ImmiEmiFlyttN/) (2024) Accessed: 19 November 2024.
- [87] Bundesamt für Statistik, Internationale Wanderungen der ständigen Wohnbevölkerung nach Staatsangehörigkeit, Geschlecht und Alter, 1991-2023 (https://www.bfs.admin.ch/bfs/de/home/statistiken/bevoelkerung/migration-integration/internationale-wanderung.assetdetail.32229097.html) (2024) Accessed: 2 March 2025.
- [88] National Statistics R.O.C. (Taiwan), Population and Housing: Number and rates of births, deaths, immigrants and emigrants, marriages and divorces (https://eng.stat.gov.tw/News_Content.aspx?n=4302&s=232173) (2023) Accessed: 4 February 2025.
- [89] Office for National Statistics, Long-term international immigration, emigration and net migration flows (provisional) (https://www.ons.gov.uk/peoplepopulationandcommunity/populationandmigration/internationalmigration/datasets/longterminternationalimmigrationemigrationandnetmigrationflowsprovisional) (2023) Accessed: 19 November 2024.
- [90] WH Frey, Immigration is Driving the Nation’s Modest Post-pandemic Population Growth, New Census Data Shows (https://www.brookings.edu/articles/immigration-is-driving-the-nations-modest-post-pandemic-population-growth-new-census-data-shows/) (2024) Accessed: 17 February 2025.
- [91] U.S. Census Bureau, International Migration in Population Estimates (2024) Random Samplings blog post.
- [92] Congressional Budget Office, The Demographic Outlook: 2023 to 2053, (U.S. Congress), Technical Report 59683 (2023).
- [93] Statistics Netherlands (CBS), Caribbean Netherlands; gross domestic product (GDP) per capita (https://www.cbs.nl/en-gb/figures/detail/85251ENG) (2023) Accessed: 7 February 2025.
- [94] United Nations, National Accounts Main Aggregates Database (https://data.un.org/Data.aspx?d=SNAAMA&f=grID:101;currID:USD;pcFlag:1&c=2,3,5,6&s=_crEngNameOrderBy:asc,yr:desc&v=1) (2023) Accessed: 7 February 2025.
- [95] Statistia, GDP of French Overseas Regions (https://www.statista.com/statistics/1075036/gdp-french-overseas-regions/) (2024) Accessed: 4 February 2025.
- [96] Pacific Data Hub, National Accounts Dataset (https://sdd.spc.int/dataset/df_national_accounts) (2023) Accessed: 8 February 2025.
- [97] Pacific Data Hub, Inflation rates (https://sdd.spc.int/dataset/df_cpi) (2023) Accessed: 8 February 2025.
- [98] Senate Foreign Affairs, Defence and Trade References Committee, Economic and social development in East Timor. (Commonwealth of Australia), (1999) Accessed: 8 February 2025.
- [99] Moody’s Ratings, Credit Opinion: Government of Isle of Man (https://www.gov.im/media/1386794/moodys-isle-of-man-credit-rating-report-december-2024.pdf) (2024) Accessed: 10 Feburary 2025.
- [100] HM Government of Gibraltar, National Income, 2009/10–2023/2024 (https://www.gibraltar.gov.gi/uploads/statistics/2024/National%20Income/2024.01.02%20Revised%202024.07.01%20National%20Income%20for%20Website%20BB24.png) (2024) Accessed: 10 Feburary 2025.
- [101] Falklands Directorate of Policy, Economy & Corporate Services, National Accounts (https://www.falklands.gov.fk/policy/statistics/national-accounts) (2024) Accessed: 10 Feburary 2025.
- [102] Falklands Jane Cameron National Archives, Economy of the Falkland Islands (https://www.nationalarchives.gov.fk/jdownloads/Trade%20and%20Industry/R-TRA-ECO-2-2.%20Economy%20of%20the%20Falkland%20Islands.pdf) (1989) Accessed: 11 February 2025.
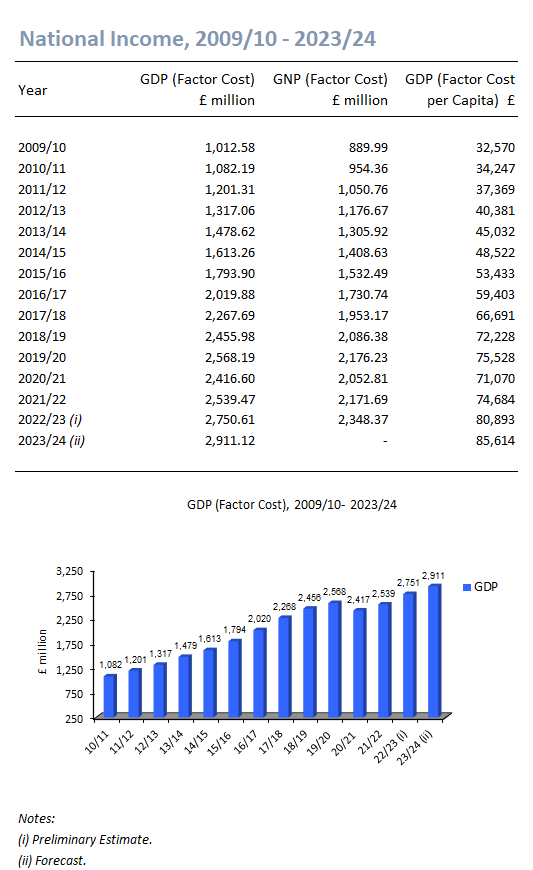