Forecasting Bus and Station Occupation in a Public Transport Ridership Model lacking Route or Alighting Location, the case of TransMilenio in Bogotá
Abstract
We present a detailed ridership model for a public transport system that can continuously forecast user waiting times as well as bus and station occupancy based on automatic fare collection (AFC) data. These models usually have one of two restrictions. For subway/metro systems the entry and exit stations can be known, but the specific route within the system is unknown; for bus systems usually the exit station is unknown, but the route is known.
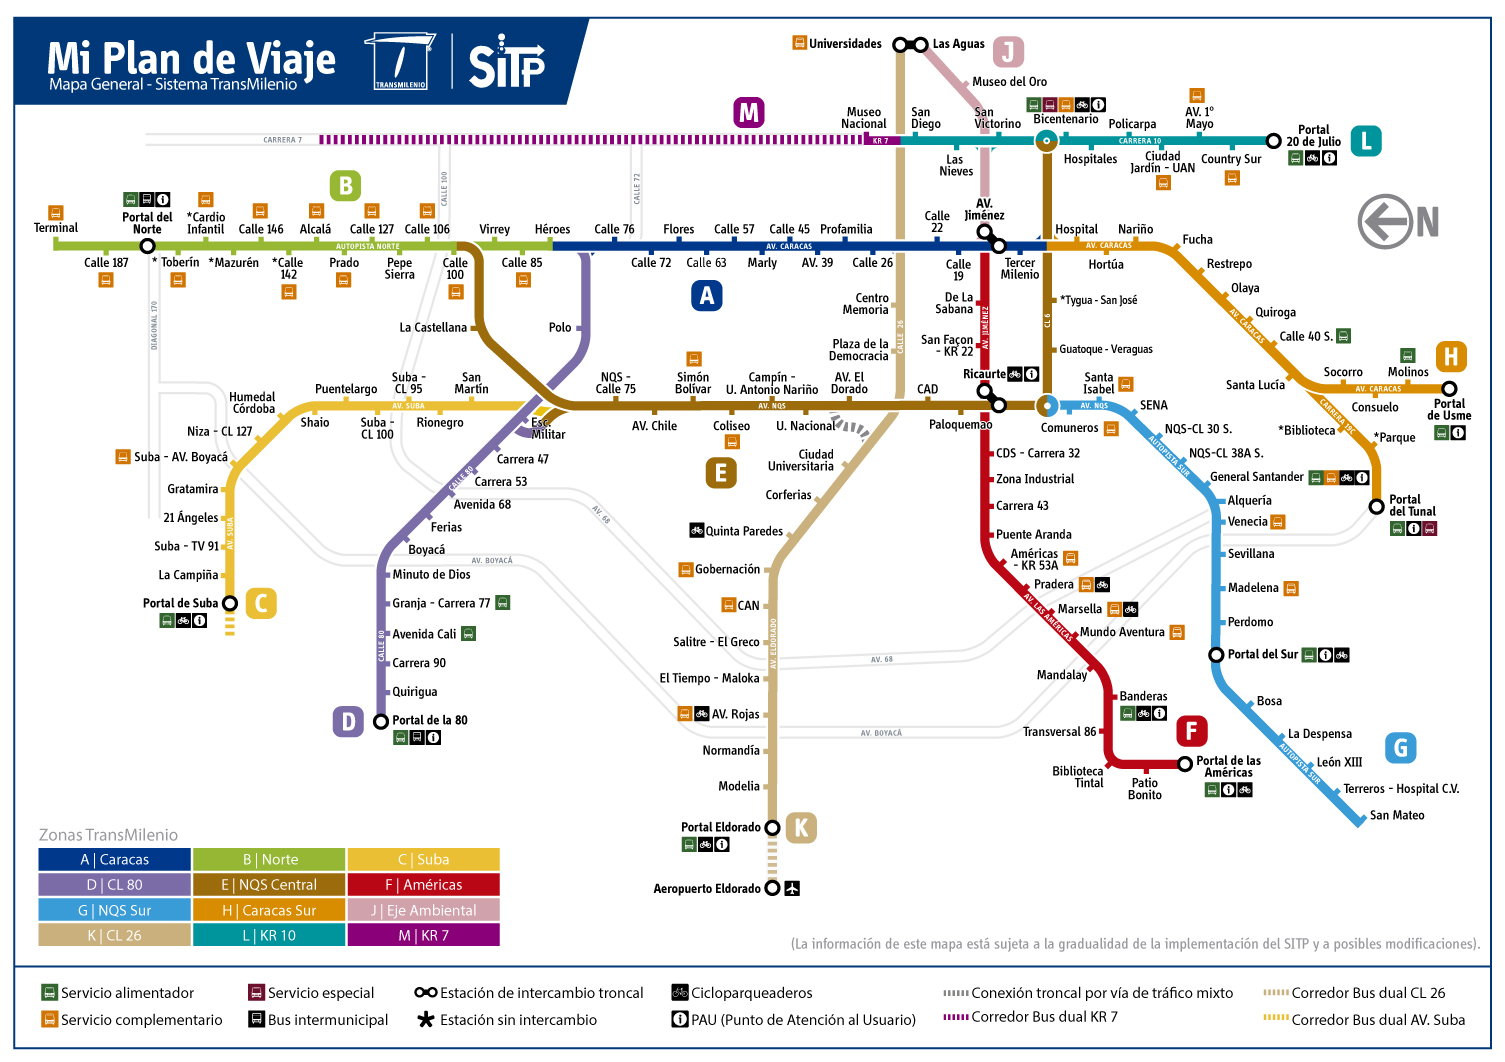
Bus Rapid Transit systems share some elements of bus and subway/metro systems, which makes them flexible options for public transport. Moreover, this also implies that they can not be modeled as either of them. Take the case of TransMilenio, the Bus Rapid Transit (BRT) system that is the backbone of public transport in Bogotá. Users pay a flat fare that does not depend on the length of the trip, and the ticket is validated on at the entry station, not on bus. Therefore, TransMilenio data has both restrictions; it lacks the information on the alight location and the particular route taken by users. We propose a model that allows to forecast bus and station occupation in such transit systems; and show an example of implementation of the model over the troncal component of TransMilenio.
We compare the average bus occupation of two particular days: 17 of May 2020, during the sanitary crisis caused by Covid-19; and on December 1, 2020, after most of the mobility restrictions had been lifted in Bogotá. In the former, very rarely the average bus occupation distribution exceeds 0.5; while in the latter most buses exceed this threshold. The model can be used to improve the quality of public transport, as well as to reduce costs of operation. Keywords: Ridership Model, TransMilenio, Bus Rapid Transit, Bus Occupancy, Network Model, Destination Inference Problem
1 Introduction
Transit systems are able to store usage information by means of automatic fare collection (AFC). Users validate their tickets either before entering the station or from within the system itself. In principle the granularity of the AFC data could be aggregated to have a detailed picture of the usage of the system; with the goal of estimating the temporal and spacial passenger flow distribution spread over the system.
If both entry and exit locations are recorded in the AFC data the origin destination (OD) matrices can be constructed. These matrices can be classified as time dependent or equilibrium, and in a simulation model could be used to generate the passengers as discussed by Yao et al. [YHYR17]. A possible way to generate the OD matrix is to utilize the GPS information of the buses and the AFC information, as done by Munizaga and Palma [MP12].
According to Si et al. [SHL20], models to solve the urban transit assignment problem can be divided in two categories. Firstly the frequency-based models, in which the average section flow through sections of the urban network are calculated with long-term planning in mind. Secondly the schedule-based models, in which the activity of each passenger is considered; which renders information for specific planning.
There are two general sources of uncertainty on the granularity of the AFC data. Firstly, the AFC may not record which particular route the user took within the system; as is the case in most subway or metro systems [SFL16]. The second uncertainty in the AFC information is known as the destination inference problem; which is the situation in which the route within the system is known but the initial or final stations are unknown. It is usually the case for bus systems in which the validation is taken inside the bus.
The mass transit systems based on buses (also known as bus rapid transit or BRT) share some characteristics with both subway/metro and bus systems. In terms of the information available for modeling, they may both lack the information on the selected route and face the destination inference problem. Moreover, equilibrium models may not be suitable, due to the uncertainty due to traffic even in dedicated streets.
In this paper we present a schedule-based simulation model for a BRT system. The main contributions of our work are:
-
•
It acknowledges for two kinds of uncertainty, both on the route choice and the destination inference. Therefore, can be used for BRT systems who share characteristics of both metro and bus systems.
-
•
It implements the network loading model based on AFC data, providing the temporal and spatial flow distribution spread over the system.
Our model can tackle both the route uncertainty and the destination inference problems. The goal with the model is to estimate temporal and spacial passenger flow distribution, taking into account the capacity of the buses. As an application we implement it for the case of TransMilenio, the BRT that constitutes the backbone of the public transport system of the city of Bogotá.
In the remainder of the introduction we present a literature review of the transit assignment models. We also go through the specific literature related to TransMilenio. In the next section we present a description of the model and the source of data that is used to make the simulation. After that we discuss the results of the model and present further work.
1.1 Literature Review of Transit Assignment Models and Route Choice
In the schedule-based model by Tong and Wong, [TW99], the transit system is represented by a graph with nodes links and lines. Nodes represent the source or sink of passengers, links can be either transit or walk links among the nodes, and lines are the paths taken by transit vehicles. Given the network a minimum path algorithm that takes into account walking time, in-vehicle time and line change penalty is calculated. The optimal path is obtained with Dijkstra’s algorithm [Dij59]. This model assumes fixed schedules, and does not have a capacity restraint provision in the buses, queuing at the stations or delay due to congestion in the departing of the buses. Moreover, assumes that passengers choose the minimum weighted time path. Tian and Huang extended the model including capacity constrains [TH07] for a monocentric city, and forcing the equilibrium condition in which commuters departing form the same station have identical generalized travel cost. Si et al. present an equilibrium model with similar conditions, and implement it for Beijing [SHL20].
Yao et al. make the distinction between mathematical models and simulation models, the former being oriented at equilibrium considerations and the latter towards more dynamic aspects of real flows of passengers [YHYR17]. Simulation models also treat individual passengers as agents within the simulation. They place these models within the category of Dynamic Traffic Management (DMS) and Dynamic Traffic Assignment (DTA). In their view a DTA has two components, the route selection model and the network loading model. The former describes how passengers choose the route, the latter represents the evolution of passenger flows on the network. They also introduce the concept of generating the passengers within the simulation out of the AFC data.
Regarding the problem of choosing a particular path within metro systems, Zhang et al. presented a model that combines information obtained from questionnaire surveys -which they call Revealed Preference- and AFC data [ZYZZ18]. Wu and Dong study the performance of metro networks [WQS19]. Their model fixes a routing strategy that optimizes by the number of transfers, and they study the robustness of the network by means of a proposed centrality: the node occupying probability. Cheng et al. propose a method to estimate the route choice by means of analyzing the statistical properties of the distribution of travel times and OD matrices obtained from AFC data [CZX19]. Gordon et al. work on the estimation of OD matrices in the cases for which there is heterogeneity in the methods of payment; for instance if there is a mix of AFC, magnetic cards, and cash [GKW18].
Other aspects that have been studied in the literature of public transit systems include ridership prediction, which refers to forecasting the usage of the public transit systems and their reliability [DDZ18, ATCT16]; as well as passenger flow within the system, [XLL19]; the distribution of time between passenger arrival, [YJWJ17]; and usage of OD matrices to match between demand and supply in transport planning using data, [HLM21, BBC21]. Moreover, passenger flow simulations follow individuals through the transport system to understand the passenger demand and its relation with the schedules of the systems [CYG21, CYY19, CYY19]. An example of the solution of the destination inference problem in a bus system with route information is given by Trepanier et al. [TTC07].
1.2 TransMilenio
BRT systems such as TransMilenio in Bogotá can be implemented as an alternative to metro/subway systems. They share some characteristics, services run through lines that stop at stations, some of which serve as transfer between lines. Users enter the system at a given station, using their AFC card. The main differences are in capacity of the bus compared to the train, and the absence of complete subway/metro lines. TransMilenio has dedicated lines for their BRT buses, but they do interact with other forms of vehicle traffic at intersections. It also uses a flat rate for usage of the system, therefore the AFC card is not used to exit the system; which for the modeler implies that we need to solve the route choice and the destination inference problem.
The availability of automatic fare collection from TransMilenio has helped studies covering fare discrimination [GMG18, GGM20, GBBG21, GG21], out-of-home participation of households [Com17], as well as social fragmentation and relationship to density, land use, and land value [BPM16, BPP13, RVTC16]. The congestion in the stations and comfort within the system has been studied by surveys [GB13, PG19]. To the best of our knowledge there are no models for the congestion of individual lines or buses in TransMilenio.
2 Materials and Methods
We implement a schedule-based simulation model with a multiple node class network model for the buses, a destination inference based on symmetry of trips, and generate the passengers of any given day with AFC data that is publicly available.
2.1 Network Models in Mass Transit
TransMilenio is a complex system in which multiple agents and entities interact. To draw useful conclusions it is necessary to model it by reducing it to its essential information. Networks provide an excellent theoretical framework for these types of systems.
A network is a mathematical object containing two collection of objects: Vertices and edges . Each edge connecting two vertices marks a relationship between them. In the area of transportation and urban planning vertices typically represent physical locations and edges represent connections between them [New18], e.g. airports and airline routes or cities and highways. Networks are interchangeably called graphs in mathematical contexts and especially in graph theory, an active and rich field of study.
The traditional network model used in transportation problems is the Origin Destination Matrix (OD). To construct it cities are divided into predetermined zones and the outgoing and incoming trips are estimated either by direct measurements such as traffic sensors or by indirect methods such as polls. A matrix in which each row corresponds to the geographical origin of a trip and each column corresponds to the destination of that trip is then constructed. The OD may be then interpreted as the adjacency matrix of a directed graph with vertices corresponding to the predetermined zones. In this case edges have a direction (origin to destination) and a weight (number of trips).
A more nuanced network model may include each of the legs of a trip and not simply the “main” destination, usually a home-work-home round trip. The data collected by TransMilenio may allow us to do such a model in which each node corresponds to a station and the edges correspond to the number of travelers assumed to travel between the stations in a given direction[GAL23].
A third approach is to include aditional information of the operation of the system such as bus schedules and routes. This allows one to make predictions about occupancy and gives a more realistic view about the passengers’ use of the system. In the next section we will explain the construction of this model from available TM data.
2.2 Transmilenio hybrid node model
We have modeled the TM system by a heterogenous graph, i.e. a graph with different node or edge types. Our model has directed edges and contains two types of nodes corresponding to stations () and buses ():
TM stations are represented by vertices of type and bus nodes of type . A subset of weakly connected nodes is called a route. Each of the nodes of a route represents a planned stop at a specific station and is connected to that station. Except for the first and last station of the route, all edges between station and bus nodes are bidirectional as passengers may either mount or alight at them. At the first station the edge is directed from the station node to the bus node (as passengers may only mount) and at the last station from the bus node to the station node as passengers may only alight. A node is connected to the next bus node in the route representing the bus movement. Figure 1 shows a toy example with seven nodes (stations) and two routes (A and B).

Using the heterogenous graph model, together with the scheduling information of the routes and the boarding time of passengers, it is possible to assign a route to each passenger that minimizes their traveling time. We have adapted the Dijikstra shortest path algorithm to minimize the expected time of arrival of the traveler. This allows us to calculate the occupation of a bus from a particular route at any given time.
2.3 Dijkstra’s Algorithm
Dijkstra’s Algorithm (DA) finds the shortest path, i.e. the one with the lowest edge sum, between two nodes in a weighted graph. The algoritm guarantees that the minimal cost will be found for graphs with non-negative weights.
In its basic form, DA marks all nodes as unvisited and assigns a tentative distance of infinity to all except the starting node which is assigned 0. A priority queue in which all unvisited nodes are placed in ascending order according to their tentative distances is intialized. The algorithm then visits the first node of the queue and assigns to its neighbors the minimum between their current tentative distance and the tentative distance of the visited node and the edge between them. When all the neighbouring nodes have been updated, the algorithm marks the node as visited and reorders the queue. The algorithm ends either when the desired destination node is marked as visited, in which case the tentative distance of the destination node is the minimum distance from the origin node, or when the priority queue is empty, in which case no path exists between the origin and the destination node.
DA may be used in both directed and undirected static networks as long as the edges are strictly positive. Unfortunately, if we try to model the passenger’s decision as one that minimizes the total time spent in the system the graph’s edge weights become dynamic depending on the hour. Additionally, TM has multiple routes with varying numbers of stops ranging from basic routes (which stop at all stations) to express routes (which make very few stops).
To solve this, edge weights are assigned as follows. Edges from to nodes are assigned an arbitrary cost of 1 minute as alight time. Edges between nodes are assigned a time cost equivalent to the time necessary to traverse the distance between them using the speeds calculated in section 2.4. Finally, the cost of mounting from to is calculated as the time between the estimated time of arrival in the station, either by entering the system or descending from another bus, and the next departure of the bus. To do this efficiently a table with all estimated arrival/departure times is assigned to each node and calculated using the departure schedules and the distance between stations.
The DA calculates ideal trajectories for users which would only work under the assumption that all users have perfect information and can calculate optimal routes. A more realistic model, beyond the scope of the present work, is to assign user trajectories based on minimal number of bus transfers or minimal average waiting time.
2.4 Passenger Flow Model
The passenger flow model calculates the dynamics of the users on the nodes of the mass transit network. Take a bipartite graph representing the network as , where are the nodes and the links. Nodes can be either stations, ; or lines .
With the model introduced in the previous section we calculate the path through the network that minimizes the travel time for a passenger at different moments in time. The model takes into account the schedule and capacity of the line. We use the word ’bus’ in our model to refer to a service that runs through a line at a particular time. The model allows us to assign to each passenger the ordered set of ordered nodes to go through. If for instance it may start at station , take line , goes to station , take line , and end at station : .
The system evolution follows the dynamics of an event driven simulation discrete time (seconds) since the beginning of the day. The main events that generate the change of the internal state of the agents in the system is the arrival of a bus to a station.
The flowchart of the model is represented in Figure 2. Firstly, the recorded information of the system (location of the stations, list of stations within the lines) is read out from public TransMilenio records. With this we internally generate stations, buses, and their lines. Empty buses are assigned to their corresponding lines and their initial station arrival time is set up according to the public TransMilenio schedule. Then we read the ridership data, including optimal user trajectories that were obtained by the network model. The changes of the optimal trajectory that result from differences in arrival times of buses due to the different schedules at different moments of the day makes almost every optimal individual trajectory unique.
With this information we schedule the arrival of each user agent to the station in which they enter the system according to the timestamp of their AFC data. The system clock runs through one day of operation of the system. Bus agents follow the trajectory in their lines within the system with a given average speed (randomly assigned for each bus from a gamma distribution with mean 15 km/h), until they arrive to their next station.
The arrival of a bus to a station triggers the updating of the state of those users within the bus that arrived to their station, explained in Figure 3. For each user in the bus we find out whether it leaves this bus. If they finished their trip they are taken out of the model, otherwise their status is updated.
Next we go through a subroutine that updates the status of users within the station, explained in 4. It runs over each user at the station. First it checks if it has arrived to the station with the AFC data. For those, checks whether they want to take this route; if affirmative gets queued to get in the bus, as the bus capacity and occupation affect whether it can take any more passengers. After it runs through every user at the station, it runs through users in the queue, to allow them to go into the bus; until it is full.
This model allows us to estimate how many passengers are there at every single bus -corresponding to individual services for each line- and waiting at each of the stations throughout the day. Takes into account the service schedules and occupation of the buses.
2.5 TransMilenio
2.5.1 Structure and definitions
The bogotanian mass transit has the following components [Tra23]: troncal, covered by large buses of either two or three bodies, capacity of 150 and 270 respectively, using mostly dedicated streets, and the AFC card validation is done in the station; zonal, covered buses with capacity of either 40 or 50 passengers, shares streets with private traffic, has AFC card validation within the bus; alimentador, uses buses with capacity to move 90 people, covers short distances in a feeder capacity to the troncal system, may or may not have AFC card validation; complementario and especial, with a very few lines, connecting to nearby towns, with buses of capacity of either 50 or 80 passengers.
The present model is aimed at the troncal system, since it is the largest part of the mass transit system, is already complex enough as to have a dedicated implementation for itself, and in our view its optimization has the higher potential to improve the quality of the service.
2.5.2 Open Data
TransMilenio has made public several datasets: AFC card data sets, that are updated daily; names and locations of the stations; routes and lines of the system. The data set include the following information:
-
•
User card validation: which includes the localization, time, and anonymized card ID [Tra21b]. In some cases users are able to use the feeder system without validating. Users do not validate egress of the system. There are single usage cards sold at the stations as well as multiple usage cards, in which several trips are pre-paid. These files are updated daily.
-
•
Planned bus departure schedules for weekdays and weekends [Tra21a]. This data set not reflect daily service incidents.
The TransMilenio data uses the word line to denote a list of stations that can be traveled in both directions; each of which correspond to a route.
We now discuss the destination inference problem. Remember that for this situation the BRT systems more closely resemble a metro/subway rather than a bus system in the sense that we do know which is the entry station to the system. To tackle the problem we have constructed histograms of validations from the data set corresponding to May 17 of 2020 Figure 5. In this day about a third of the validations are unique; the card numbers appear only once on the data set of that day. In Figure 5 it is represented in the green histogram. Of the remaining validations, another third correspond to the first validation of a card that was used more than one time, and another third to the second validation of those cards. Notice that the first validation is unimodal, and has its peak is close to 6 am; likewise the distribution of the second validation has a peak close to 17:00. Those characteristics are an indication that those users are following a schedule of 8 am to 5 pm; be it laboral or educational.
To infer the destination of those trips in which there are two validations we use follow the procedure described in [RLK09]. For the first trip the origin corresponds to the location of the first validation, and the destination to the location of the second validation; this is coherent with the distribution of trips shown in the histograms of Figure 5. For the second trip those are reversed, the entry point to the system is the station of the second validation of the day and the exit point of the system is the station of the first validation of the day. This is called the symmetry assumption by Navick et al. [NF02].

For those cards that have a single validation, we assign the destination point of a trip with a weighted random function. The weights of a particular end point correspond to the fraction of the trips that were inferred from the cards that had more than one validation. Figure 7 depicts the chord diagram for the trips of the day between the different zones of TransMilenio. The line joins source zones with destination zones, and its color corresponds to the source. It can be seen that the Caracas zone is the backbone of the system, having the larger fraction of trips, and being the endpoint of trips from every other zone. Zones Autonorte,Américas,NQS,Cr 7-10, Eje Ambiental, Calle 80, Calle 26 share a similar behavior: have trips that start and end on the same zone and are relatively connected by trips with other zones. NQS for its part has a negligible fraction of trips starting and ending on the same zone. The smallest ammount of trips correspond to those of the zone Calle 6.

As a caveat take in mind that there are users who skip the payment by entering the system through unautorized locations. Therefore, bus occupation in the system will in general be larger than what we can predict with our model. Since we do not have reliable data to take this issue into account we are not going to model it.

3 Results and Discussion
Now we will showcase the application to the model to the particular case of TransMilenio. Fistly we will compare the results of the model for two particular of the Covid-19 pandemic. The lock-down of the city provides a way to test whether the system does capture how a difference in public transport usage translates into different aggregate conditions for the system. Secondly we analize the occupation of the system and test different ways in which strategies of passengers can evolve through a repeated use of the system.
3.1 Comparison of two different days within the Covid-19 pandemic
Since our simulation follows every passenger throughout the system, and we run every single instance of a route (what we call a bus), we are able to find calculate the occupation of every bus. As the occupation only changes at the stations we have a discrete set of times at which to calculate the occupation of each bus. Furthermore, for each bus we can calculate both the average and the maximum occupation during its transit through a route. Figure 8 shows the histogram of average bus occupation for May 17, 2020. At this point in the COVID-19 pandemic the usage of public transport in Colombia was down 78% from pre-pandemic levels [Goo21, ABC20]; which in terms of the occupation of the buses implied that very few buses had an average occupation above 40% and the distribution of bus occupations is peaked around 0%.
Compare this with the occupation for December 1, 2020, in Figure 9. At this point there was a 15% decrece in public transport usage from pre-pandemic levels; thus it was higher than on the previously studied case. Accordingly, we see that bus occupations are qualitatively different. Firstly, there are many buses having an average occupation above 60%, about 1200.


A more detailed description of the bus occupation can be obtained by taking a particular line. For instance, Figure 10 displays both the average occupation and the maximum occupation of every bus in the line C15 towards Portal Suba on the 17 of May 2020, sorted by their departure time. On this date the bus occupancy had a low variability throughout the day, with a range between 0 and 0.3; and the average occupancy was close to the maximum occupancy for each particular bus. Compare with Figure 11 for December 1, 2020. In this case there is in general a larger spread of both average and maximum occupancy, with a range betwen 0 and 1; there is a larger gap between any individual bus average and maximum occupancy; and there is a drop of both quantities for buses starting their route at 17:30. All those characteristics indicate that there was an increased use of the line on December 2020 compared to May 2020. This is consistant with the known dynamics of public transport usage throughout the first year of the Covid Pandemic.


We also calculate the number of persons that have arrived to a station and are waiting for the route. Take for instance the station Calle 76. In Figure 12 this quantity takes values smaller than 10 throughout the day of May 17, 2020. Compare with Figure 13, representing December 1, 2020; here the number of people in the station increases drastically, taking values close to 80, and peaking both at 7:30 and at 15:30.


4 Conclusions and Closing Remarks
The situation in which Bogotá transit authorities find themselves with regard to the ridership of its main public transport system is certainly not unique; the automatic fare collection (AFC) systems allow collecting massive amounts of data that nonetheless in its raw form does not convey the information that can be used to improve the transport systems.
We have presented a model that takes into account the structure of the networks, the capacity of the buses, and the AFC data in order to calculate individual user trajectories and aggregate them; thus allowing us to make conclusions about the system. Our model can be applied to improve the system for users, find the points of failure, and in general understand and model the ridership of the system.
As an application of the model, we have shown how the distribution of average bus occupation on a particular day of the Covid-19 sanitary crisis, 17 of May 2020, was remarkably different to a day in which the mobility restrictions were lifted, 1 of December 2020. This can be seen as a validation of the model, and an example of how it can be used to understand the usage of the system and to improve the public transport experience.
There are several paths that can be taken in order to improve the present model. Our model implements a simple approach to simulate the traffic of buses, by having a distribution of speeds. A better model for the traffic of BRT buses would take into account the traffic induced by themselves in their restricted lanes, as well as congestion resulting in queues in accessing the stations. We plan to include these in future iterations of the model.
Although we are confident that we have a solid basis to infer the destination of the trips, a possible way to reduce the uncertainty would be to have direct information of the exit station. A Big Data approach to this problem will be to use the location of individual cellphones of users out of cell network provider information; this presents a more precise location of each passenger, but may include a sampling bias if there are technological differences among the usage of cellphone and coverage of service related to the income of passengers.
Contributions
A.A., J.G., and G.V. worked on the conceptual structure of the model. J.G. wrote the network model for TM. A.A. and G.V. wrote the computer code for the users. G.V. and J.G. cleaned the data, and wrote the article. G.V. ran the simulations and post-processed the data.
Competing Interests and Funding
The present work lies within the research project ID E5 2023 8, Escuela Superior de Administración Pública. Besides that, it did not receive any specific grant from funding agencies in the public, commercial, or not-for-profit sectors.
References
- [ABC20] Ahmet Aktay, Shailesh Bavadekar, Gwen Cossoul, John Davis, Damien Desfontaines, Alex Fabrikant, Evgeniy Gabrilovich, Krishna Gadepalli, Bryant Gipson, Miguel Guevara, et al. Google covid-19 community mobility reports: anonymization process description (version 1.1). arXiv preprint arXiv:2004.04145, 2020.
- [ATCT16] Saeedeh Anvari, Selcuk Tuna, Metin Canci, and Metin Turkay. Automated box–jenkins forecasting tool with an application for passenger demand in urban rail systems. Journal of Advanced Transportation, 50(1):25–49, 2016.
- [BBC21] Krishna N.S. Behara, Ashish Bhaskar, and Edward Chung. A dbscan-based framework to mine travel patterns from origin-destination matrices: Proof-of-concept on proxy static od from brisbane. Transportation Research Part C: Emerging Technologies, 131:103370, 2021.
- [BPM16] Juan Pablo Bocarejo, Ingrid Portilla, and David Meléndez. Social fragmentation as a consequence of implementing a bus rapid transit system in the city of bogotá. Urban Studies, 53(8):1617–1634, 2016.
- [BPP13] Juan Pablo Bocarejo, Ingrid Portilla, and Maria Angélica Pérez. Impact of transmilenio on density, land use, and land value in bogotá. Research in Transportation Economics, 40(1):78–86, 2013. Urban Transport in Developing Countries: CODATU Special Issue.
- [Com17] Tabitha S. Combs. Examining changes in travel patterns among lower wealth households after brt investment in bogotá, colombia. Journal of Transport Geography, 60:11–20, 2017.
- [CYG21] Xiaopei Cai, Huimin Yang, and Yongxin Gao. Evaluation of urban rail transit operation considering rider and operator satisfaction. In Proceedings of the Institution of Civil Engineers-Transport, pages 1–15. Thomas Telford Ltd, 2021.
- [CYY19] Feng Chen, Huimin Yang, and Yang Yang. Mas-based model for evaluating train timetables to minimise the waiting time. KSCE Journal of Civil Engineering, 23(3):1360–1368, 2019.
- [CZX19] Gang Cheng, Shuzhi Zhao, and Shengbo Xu. Estimation of passenger route choices for urban rail transit system based on automatic fare collection mined data. Transactions of the Institute of Measurement and Control, 41(11):3092–3102, 2019.
- [DDZ18] Chuan Ding, Jinxiao Duan, Yanru Zhang, Xinkai Wu, and Guizhen Yu. Using an arima-garch modeling approach to improve subway short-term ridership forecasting accounting for dynamic volatility. IEEE Transactions on Intelligent Transportation Systems, 19(4):1054–1064, 2018.
- [Dij59] Edsger W Dijksta. A note on two problems in connexion with graphs. Numerische mathematik, 1(1):269–271, 1959.
- [GAL23] Juan D Garcia-Arteaga and Laura Lotero. A network-based analysis to assess covid-19 disruptions in the bogotá brt system. Environment and Planning B: Urban Analytics and City Science, page 23998083221150646, 2023.
- [GB13] Gonzalo Guerra and J Bocarejo. Congestion cost in mass transit systems; pricing and investment policy implications—case study: Bogota’s brt system. In 13th world conference on transportation research, Rio de Janeiro, 2013.
- [GBBG21] Luis A. Guzman, Carlos Beltran, Jorge A. Bonilla, and Santiago Gomez Cardona. Brt fare elasticities from smartcard data: Spatial and time-of-the-day differences. Transportation Research Part A: Policy and Practice, 150:335–348, 2021.
- [GG21] Luis A. Guzman and Santiago Gomez Cardona. Density-oriented public transport corridors: Decoding their influence on brt ridership at station-level and time-slot in bogotá. Cities, 110:103071, 2021.
- [GGM20] Luis A Guzman, Santiago Gomez, and Carlos Alberto Moncada. Short run fare elasticities for bogotá’s brt system: ridership responses to fare increases. Transportation, 47(5):2581–2599, 2020.
- [GKW18] Jason B. Gordon, Haris N. Koutsopoulos, and Nigel H.M. Wilson. Estimation of population origin–interchange–destination flows on multimodal transit networks. Transportation Research Part C: Emerging Technologies, 90:350–365, 2018.
- [GMG18] Luis A Guzman, Carlos A Moncada, and Santiago Gómez. Fare discrimination and daily demand distribution in the brt system in bogotá. Public Transport, 10(2):191–216, 2018.
- [Goo21] GoogleLLC. [dataset] google covid-19 community mobility report, 2021. Data retrieved from https://www.google.com/covid19/mobility/ on February 5 2021.
- [HLM21] Natalia Selini Hadjidimitriou, Marco Lippi, and Marco Mamei. A data driven approach to match demand and supply for public transport planning. IEEE Transactions on Intelligent Transportation Systems, 22(10):6384–6394, 2021.
- [MP12] Marcela A. Munizaga and Carolina Palma. Estimation of a disaggregate multimodal public transport origin–destination matrix from passive smartcard data from santiago, chile. Transportation Research Part C: Emerging Technologies, 24:9–18, 2012.
- [New18] Mark Newman. Networks. Oxford university press, 2018.
- [NF02] David S. Navick and Peter G. Furth. Estimating passenger miles, origin–destination patterns, and loads with location-stamped farebox data. Transportation Research Record, 1799(1):107–113, 2002.
- [PG19] Juan Camilo Pinzón Guerrero et al. Análisis de la congestión en las estaciones de sistemas de transporte masivo: solución mediante una aproximación con diferentes ajustes operacionales-caso bogotá, colombia. Master’s thesis, Uniandes, 2019.
- [RLK09] Alla Reddy, Alex Lu, Santosh Kumar, Victor Bashmakov, and Svetlana Rudenko. Entry-only automated fare-collection system data used to infer ridership, rider destinations, unlinked trips, and passenger miles. Transportation research record, 2110(1):128–136, 2009.
- [RVTC16] Daniel A. Rodriguez, Erik Vergel-Tovar, and William F. Camargo. Land development impacts of brt in a sample of stops in quito and bogotá. Transport Policy, 51:4–14, 2016. Transit Investment and Land Development. Edited by Xinyu (Jason) Cao and Qisheng Pan & Shared Use Mobility Innovations. Edited by Susan Shaheen.
- [SFL16] Bingfeng Si, Liping Fu, Jianfeng Liu, Sajad Shiravi, and Ziyou Gao. A multi-class transit assignment model for estimating transit passenger flows—a case study of beijing subway network. Journal of Advanced Transportation, 50(1):50–68, 2016.
- [SHL20] Bingfeng Si, Zhengbing He, Di Liu, Xiaobao Yang, and Ziyou Gao. Train operation diagram-based equilibrium model for an urban rail transit network with transfer constraints. Journal of Transportation Engineering, Part A: Systems, 146(11):04020126, 2020.
- [TH07] Qiong Tian and Hai-Jun Huang. Commuting equilibria on a mass transit system with capacity constraints. In Transportation and Traffic Theory 2007. Papers Selected for Presentation at ISTTT17Engineering and Physical Sciences Research Council (Great Britain) Rees Jeffreys Road FundTransport Research FoundationTMS ConsultancyOve Arup and Partners, Hong KongTransportation Planning (International) PTV AG, 2007.
- [Tra21a] S.A. Transmilenio. [dataset] horarios despachos rutas troncales y alimentadoras día hábil, May 2021. Datos Abiertos Bogotá,https://datosabiertos.bogota.gov.co/dataset/horarios-de-operacion-componente-troncal-del-sitp.
- [Tra21b] S.A. Transmilenio. [dataset] validaciones tarjeta tullave - sitp, May 2021. Datos Abiertos Bogotá, https://datosabiertos.bogota.gov.co/dataset/validaciones-tarjeta-tullave-sitp.
- [Tra23] S.A. Transmilenio. Buses de transmilenio, Jan 2023. https://www.transmilenio.gov.co/publicaciones/151051/buses-de-transmilenio/.
- [TTC07] Martin Trépanier, Nicolas Tranchant, and Robert Chapleau. Individual trip destination estimation in a transit smart card automated fare collection system. Journal of Intelligent Transportation Systems, 11(1):1–14, 2007.
- [TW99] C. O. Tong and S. C. Wong. A schedule-based time-dependent trip assignment model for transit networks. Journal of Advanced Transportation, 33(3):371–388, 1999.
- [WQS19] Jianjun Wu, Yunchao Qu, Huijun Sun, Haodong Yin, Xiaoyong Yan, and Jiandong Zhao. Data-driven model for passenger route choice in urban metro network. Physica A: Statistical Mechanics and its Applications, 524:787–798, 2019.
- [XLL19] Xinyue Xu, Haiying Li, Jun Liu, Bin Ran, and Lingqiao Qin. Passenger flow control with multi-station coordination in subway networks: algorithm development and real-world case study. Transportmetrica B: Transport Dynamics, 7(1):446–472, 2019.
- [YHYR17] Xiangming Yao, Baomin Han, Dandan Yu, and Hui Ren. Simulation-based dynamic passenger flow assignment modelling for a schedule-based transit network. Discrete Dynamics in Nature and Society, 2017, 2017.
- [YJWJ17] Jingfeng Yang, Jian Gang Jin, Jianjun Wu, and Xi Jiang. Optimizing passenger flow control and bus-bridging service for commuting metro lines. Computer-Aided Civil and Infrastructure Engineering, 32(6):458–473, 2017.
- [ZYZZ18] Yongsheng Zhang, Enjian Yao, Junyi Zhang, and Kangning Zheng. Estimating metro passengers’ path choices by combining self-reported revealed preference and smart card data. Transportation Research Part C: Emerging Technologies, 92:76–89, 2018.