

The DIRECD coronal mass ejection direction catalog: three-dimensional propagation inferred from coronal dimmings
Abstract
Coronal mass ejections (CMEs) are among the primary drivers of space weather disturbances at Earth, yet their early propagation in the low corona remains poorly constrained owing to occultation and projection effects inherent to coronagraph observations. Coronal dimmings offer an alternative diagnostic to infer CME propagation direction directly from the low corona. We present the DIRECD CME Direction Catalog, a unified dataset of three-dimensional CME propagation directions derived via the DIRECD (Dimming Inferred Estimation of CME Direction) method, which reconstructs CME cone geometry from SDO/AIA 211 Å coronal dimming observations. The catalog comprises 64 events spanning 2010-2026, combining 31 Solar Cycle 25 (2021-2026) events with 33 events from prior studies. For each event we report the 3D propagation direction, 2D inclination angles, angular width, and cone height. Statistical analysis reveals a systematic asymmetry in low-coronal CME propagation: meridional inclinations exhibit a systematic tendency toward latitude-dependent deflection, with poleward deflections more pronounced at higher source latitudes, while equatorial inclinations show no significant dependence on source longitude. This is consistent with low-coronal CME trajectories being governed primarily by local active-region magnetic topology, with the large-scale coronal field and heliospheric current sheet assuming a progressively dominant role at greater heliocentric distances. Incorporating DIRECD-derived propagation directions into CME arrival forecasts improves predictions of geomagnetic storm intensity, raising the correlation with observed storm strength from to when combined with CME speed. The DIRECD software, catalog, and all associated data products are publicly available to support space weather research.
Keywords:
The Sun — Heliosphere — Solar Physics — Solar coronal mass ejections — Active Sun — Astronomy data analysisshow]shantanu.jain@ingsci.tech
I Introduction
Coronal mass ejections (CMEs) are large-scale eruptions of magnetized plasma from the Sun, propagating at speeds up to several thousand kilometers per second and are major drivers of space weather [37, 18, 62, 6, 67]. Predicting CME arrival times and impacts depends critically on accurate knowledge of the CME propagation direction. In particular, CME impact at Earth, arrival time and speed predictions depend on the assumed propagation direction in heliospheric propagation and ensemble forecasting models. Multiple operational and research-oriented forecasting approaches require early CME direction estimates as input, including cone-based ensemble models, drag-based ensemble methods (DBEM) [68, 14, 1], and physics-based magnetohydrodynamic (MHD) models such as ENLIL [36], EUHFORIA [47], SUSANOO-CME [56], which require CME direction as a direct input parameter, as well as global MHD frameworks such as AWSoM [63] within the Space Weather Modeling Framework, where direction information instead constrains the location and orientation of the inserted flux. For example, ELEvoHI requires the propagation direction and angular width as key input parameters [53, 52, 2]. Beyond Earth, propagation direction determines whether other planetary environments are impacted, an important consideration when interpreting CME and shock related particle and radiation signatures at Mars and along interplanetary trajectories [20, 16]. Finally, CME direction and the resulting magnetic connectivity can influence the access of observers to CME-driven shocks and the observed longitudinal spread and timing of SEP events. As such, constraining CME direction is equally important in SEP modeling and event analysis contexts [40, 13].
Several three-dimensional reconstruction techniques have been developed to investigate the propagation, geometry, and trajectory of coronal mass ejections (CMEs), including their deflection within the heliosphere. Among the most widely used is the Graduated Cylindrical Shell (GCS) model [59, 60], a forward-fitting method that reconstructs the large-scale structure of CMEs from stereoscopic coronagraph images, typically acquired at heliocentric distances beyond a few solar radii. Additional multi-viewpoint approaches include elliptical tie-pointing [5] and geometric triangulation [34, 46], both of which constrain CME kinematics and direction by leveraging simultaneous observations from widely separated spacecraft. These observations rely on coronagraph observations in the outer corona.
However, coronagraphs are limited by the occulting disk, which obstructs the view of the low corona where CMEs originate [4, 55]. This makes it difficult to determine the early direction of CME propagation. However, alternative observational signatures in the low corona, such as coronal dimmings, can provide early direction constraints. Coronal dimmings are localized reductions in extreme ultraviolet (EUV) and soft X-ray emissions in the low corona, caused by plasma depletion during CME eruptions [23, 58, 61]. For a comprehensive discussion on dimming properties and their links to CMEs, we refer to the recent review by [65].
Extensive research has established a close association between dimming signatures and CME properties, including mass, speed and morphological evolution [22, 21, 73, 35, 10, 11, 12, 7, 3, 48, 49]. Coronal dimmings may also serve as a proxy for stellar CMEs [27, 66].
A new approach, the DIRECD (Dimming Inferred Estimation of CME Direction) method, exploits coronal dimming geometry to infer three-dimensional CME propagation directions from observations in the low corona, before CME structures become fully visible in coronagraph data. The DIRECD method has been validated against the GCS model reconstructions and coronagraph observations, demonstrating that dimming observations reliably constrain early CME direction [24, 25, 26, 44].
In this paper, we present and discuss in detail 31 newly analyzed CME events that occurred during solar cycle 25, while publicly releasing the DIRECD CME direction catalog, which additionally includes 33 CME events adopted from earlier DIRECD statistical studies [24], resulting in a total of 64 cataloged CME/dimming events. The catalog provides a complete and standardized set of coronal dimming masks and timing information for all events. The detailed analysis and validation presented in this paper focus on the newly analyzed Solar Cycle 25 events, for which we derive and discuss the full set of DIRECD-derived CME geometry parameters, including the 3D propagation direction, inclination angle, angular width, and the cone height at which the erupting structure remains connected to the dimming footprint, together with associated uncertainty estimates derived in this study. The legacy events are included in the catalog as standardized dimming data products, enabling direct reuse and comparison, while their corresponding DIRECD results are documented in earlier analyses. Minor numerical differences may arise as the software continues to evolve and detection routines are refined.
All data products are released as a unified dataset across solar cycles 24-25 for the time range 2010-2026 that can be used as a direct input for DIRECD, for studies of early CME properties. The catalog is generated using the newly developed open-source DIRECD software available on Github11 1 https://github.com/jain-shantanu/DIRECD and Zenodo22 2 https://doi.org/10.5281/zenodo.20487897, the primary objective of which is to provide the solar and heliospheric physics community with a robust, user-friendly platform for automated dimming detection and early CME direction estimation using the DIRECD method. We demonstrate for the first time that DIRECD operates in near real-time on SDO quick-look data, showing applicability for operational space weather forecasting. The SDO quick-look data consists of near-real-time AIA Level 1 data (JSOC series aia.lev1_nrt2).
This paper is organized as follows. Section II presents two representative CME events - 24 February 2023 and 18 January 2026 and demonstrates the full DIRECD analysis workflow, from automated dimming detection to three-dimensional CME direction reconstruction and validation with coronagraph observations. Section III describes the construction, content, and statistical properties of the DIRECD CME direction catalog, including uncertainty estimation, cross-validation for an event, and the released data products. Section IV summarizes the key findings and outlines future directions for extending the DIRECD method toward operational and off-limb applications.
II Representative Catalog CME Events: DIRECD Analysis of 24 February 2023 and 18 January 2026 events
The DIRECD method uses a 3D cone model to approximate an expanding CME at the end of the dimming impulsive phase and to infer key CME parameters, including the propagation direction, half-width, and the cone height at which the CME remains connected to the dimming, by matching the cone projections on the solar sphere to the observed dimming geometry [26]. To illustrate the method, we present a partial-halo CME (24 February 2023) event, and recent extreme CME (18 January 2026) halo event which are included in the DIRECD CME direction catalog.
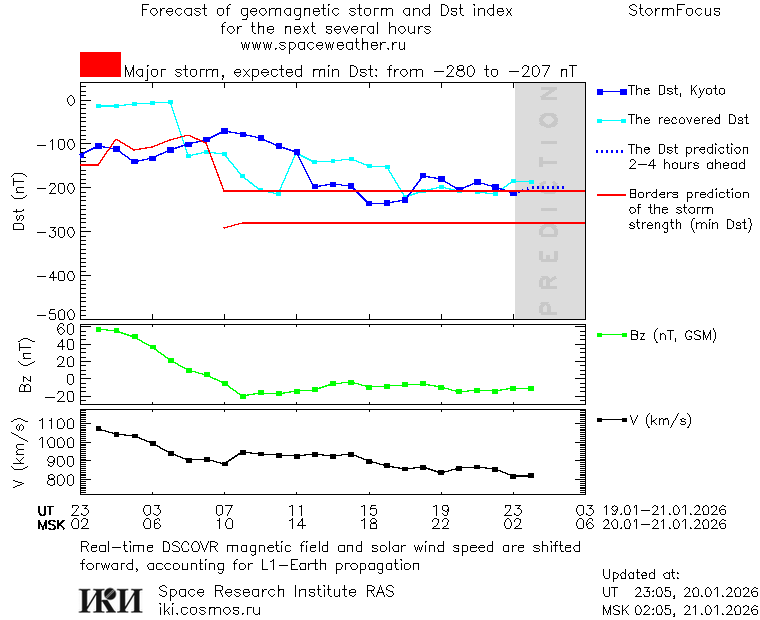
The 24 February 2023 CME was associated with an M3.7-class solar flare, as recorded by the GOES X-ray flux measurements and cataloged in the GOES/HINODE flare catalog [69]. The accompanying coronal mass ejection (CME) was identified in the LASCO CME catalog [70], with a speed of km s-1 in the LASCO coronagraph field of view. The CME struck earth on 26 February 2023, triggering a G1-G2 magnetic storm33 3 https://www.spaceweather.com/archive.php?view=1&day=26&month=02&year=2023. This interaction produced a moderate geomagnetic storm, reaching a peak Dst index of –132 nT on 27 February 202344 4 https://omniweb.gsfc.nasa.gov. In contrast, the 18 January 2026 CME was accompanied by an X1.9-class solar flare and was a very fast halo CME, propagating at approximately speed of 1842 km s-1 as identified in the LASCO CME catalog [70]. The CME traversed the Sun–Earth distance in about 25 hours and impacted Earth nearly head-on 55 5 https://www.spaceweather.com/archive.php?view=1&day=19&month=01&year=2026, triggering a G4-class geomagnetic storm that reached a minimum Dst index of –214 nT on 20 January 2026 at 17:00 UT inspected with OMNI database [41], successfully predicted several hours in advance by the StormFocus service [43, 45]66 6 https://spaceweather.ru/content/extended-geomagnetic-storm-forecast, as shown in the prediction screenshot77 7 http://www.iki.rssi.ru/forecast/data/Archive/2026/en/01/20/Prediction_20260120_2305.gif, and associated with the most intense solar proton event recorded in the 21st century to date.
To generate all figures and data products associated with this event, including the coronal dimming masks and estimated 3D CME geometry we use the newly developed open-source DIRECD software88 8 https://zenodo.org/records/20487897, released as part of the DIRECD catalog. The software provides automated routines for coronal dimming detection, CME cone reconstruction, uncertainty estimation, and visualization of results. Detailed information on the software architecture, installation, input/output formats, and user-level operation is provided in the accompanying online documentation and user manual99 9 https://direcd.readthedocs.io/en/latest/.
We identify coronal dimmings associated with the CME events using automated detection methods [10, 8] applied to SDO/AIA (Solar Dynamics Observatory/Atmospheric Imaging Assembly) 211 Å observations [33, 42]. All SDO/AIA images are processed using the SunPy library [38], which involved selecting exposure times ( s), correcting for differential rotation, and resampling to a uniform pixel resolution. The procedure constructs logarithmic base-ratio images relative to a pre-event reference time (30 min before the flare) and segments dimming regions through adaptive thresholding combined with a region-growing algorithm to derive instantaneous and cumulative dimming masks. A variable threshold between and is used to segment dimming regions based on histogram thresholding, which are subsequently processed with morphological operations and median filtering ( pixel kernel) to suppress noise. For the two example events, we use the mean value of for segmentation, which was selected by visual analysis of dimming development. The detection of coronal dimmings is performed within a subfield centered on the eruption site. The detected dimming pixels are accumulated in time to construct a cumulative dimming map, and the dimming area is calculated by estimating the surface area of the solar sphere for every pixel following the approach of Chikunova et al. [8], which accounts for projection effects, particularly near the solar limb.
Following the approach established in previous studies [11, 25, 26, 24], we define the end of the dimming impulsive phase as the time when the cumulative dimming area growth rate decreases to 15% of its maximum value. The cumulative dimming mask at the end of this phase serves as the primary observational constraint for reconstructing the CME geometry. To identify the dominant direction of dimming expansion, we divide the solar disk into angular sectors centered on the source region and evaluate the cumulative dimming area in each sector [25]. Figure 1 shows the dimming detection map at the end of the impulsive phase for the two events under study. For each event we show 4 plots in a row: the calibrated SDO/AIA image, the logarithmic base-ratio (LBR) image, the instantaneous dimming detection superimposed on LBR image and the cumulative dimming detection map on LBR image respectively.
We note that the 18 January 2026 event exhibits an unusually short impulsive phase (13 minutes) compared to the other events (Table 1 in section III.1), consistent with it being the fastest event in our sample (X1.9 flare, 1842 km/s CME speed). At the 1-minute cadence used throughout this study, the impulsive phase for this event is sampled by 13 data points, sufficient to identify the 15% area-growth-rate threshold but coarser in time resolution than for the longer-duration events in the catalog. We verified that the cumulative dimming mask at the identified end-of-impulsive-phase time is not sensitive to the precise choice of threshold within the adjacent one-to-two cadence steps for this event, supporting the robustness of the derived CME geometry despite the short phase duration. Figure 2 shows the angular sector scheme and cumulative dimming contours for both events. The blue radial lines indicate the 12 equally-spaced sectors, and the gray shaded regions show the cumulative dimming extent at the end of the impulsive phase. For the 24 February 2023 event (Figure 2(a)), the cumulative dimming area reaches its maximum in sector 11, indicating the dominant dimming, and thus CME propagation direction. For the 18 January 2026 event, the dominant dimming direction is in sector 6 (Figure 2(b)).


.


Using this dominant direction and the dimming edges that define the surface extent of the CME footprint, we construct an ensemble of CME cones with varying heights, angular widths, and inclinations relative to the radial direction. For each cone, we compute orthogonal projections onto the solar sphere and compare the resulting projected footprints with the observed dimming extent at the end of the impulsive phase. We select the CME parameters by identifying the cone configuration that best reproduces the dimming geometry while maximizing the fraction of dimming pixels enclosed within the projected cone boundaries [24]. This procedure results in an estimate of the CME propagation direction in 3D, together with associated geometric parameters such as inclination angle, angular width, and CME cone height, at which the CME remains connected to the dimming.


The resulting best-fit cones for both events are shown in Figure 3. For the 24 February 2023 event, the reconstruction yields a cone height of , an angular width of , an inclination angle of relative to the solar radial direction, with the cone axis tilted toward the north and toward the west. For the 18 January 2026 event, the best-fit cone has a height of , an angular width of , an inclination angle of , with the axis inclined toward the south and toward the east.


We plot the CME directions inferred from coronal dimmings on the white-light coronagraph observations from SOHO/LASCO. The projected CME cones derived from the dimming analysis are overlaid onto LASCO and STEREO images, enabling a direct comparison between the low-coronal propagation directions inferred from dimmings and the CME morphology seen higher in the corona (Figure 4). For both events, the cone projections are oriented towards the center of the CME bubble in LASCO and STEREO-A observations, providing confidence that the dimming-inferred directions reliably capture the early CME propagation.
III The DIRECD CME direction catalog
The example above illustrates the full DIRECD workflow applied to two events. In the following section, we extend this analysis to a systematically selected set of CME events, forming a homogeneous catalog of dimming-derived CME propagation directions.
III.1 Event selection and data processing
The catalog is based on dimming evolution derived from full-disk SDO/AIA EUV observations. We use the 211 Å band because it provides strong dimming contrast at relevant coronal temperatures [10, 32]. For each event, we analyze a 2.5-hour interval sampled at a one-minute cadence, starting 30 minutes before the associated flare onset. We preprocess the data and detect coronal dimmings using the same pipeline described in Section II; for consistency across the catalog, we apply the detection within a arcsec subfield around the source region and use LBR thresholding in the range of to DN.
The catalog includes 31 CME events from Solar Cycle 25 selected according to a set of uniform criteria designed to ensure reliable dimming identification and robust CME association. The event selection criteria is similar to the one outlined in [24]. Each of the events must exhibit well-defined, coherent coronal dimming signature in SDO/AIA 211 Å base-ratio images. Moreover, each dimming event must be associated with a confirmed solar flare with clear onset time and source coordinates, verified using the GOES flare catalog 1010 10 http://www.ngdc.noaa.gov/stp/satellite/goes/index.html, the HINODE flare catalog [69], or NOAA’s Space Weather Prediction Center records 1111 11 https://www.swpc.noaa.gov/products/goes-x-ray-flux. Additionally, the associated flare’s source region is constrained to within (potentially upto depending on dimming morphology) of the solar disk center to minimize projection effects in the dimming identification process.
Columns 1-6 of Table 1 gives an overview of the 31 newly analyzed Solar Cycle 25 events and their associated dimming parameters such as the date of the event, start and end of the impulsive phase of the dimming and the heliographic location of the associated flare.
| # | Event Date | Start Time | End Time | Lat. | Lon. | Best Height | Best Incl. | Meridional | Equatorial |
| (UTC) | (UTC) | (∘) | (∘) | () | (∘) | (∘) | (∘) | ||
| 1 | 28-09-2021 | 05:23 | 07:52 | 40 | 0.85 | 8.1 1.8 | 3.3 0.7 | 8.1 1.7 | |
| 2 | 09-10-2021 | 06:20 | 07:07 | 19 | 0.93 | 12.7 1.9 | 4.1 0.6 | 13.1 1.8 | |
| 3 | 02-11-2021 | 01:20 | 02:59 | 23 | 0.67 | 6.3 1.9 | 5.9 1.8 | 0.7 | |
| 4 | 14-01-2022 | 12:17 | 13:40 | 35 | 0.80 | 0.2 1.6 | 0.0 0.1 | 1.6 | |
| 5 | 28-03-2022 | 10:46 | 11:45 | 16 | 4 | 1.10 | 2.5 1.6 | 2.4 1.6 | 0.1 0.1 |
| 6 | 30-03-2022 | 17:21 | 18:38 | 13 | 32 | 1.15 | 14.9 1.9 | 1.6 | 1.0 |
| 7 | 04-04-2022 | 20:22 | 22:07 | 0.79 | 0.6 1.6 | 0.6 1.5 | 0.2 0.5 | ||
| 8 | 25-05-2022 | 17:22 | 18:38 | 41 | 0.81 | 7.1 1.7 | 1.6 | 2.2 0.5 | |
| 9 | 16-07-2022 | 02:31 | 05:00 | 37 | 5 | 1.00 | 15.6 2 | 13.7 1.5 | 11.8 1.3 |
| 10 | 14-10-2022 | 21:38 | 23:08 | 36 | 0.65 | 3.7 1.9 | 1.3 | 1.4 | |
| 11 | 10-02-2023 | 02:30 | 03:42 | 27 | 24 | 0.31 | 3.7 3 | 3.5 2.8 | 1.4 1.1 |
| 12 | 24-02-2023 | 19:40 | 21:30 | 32 | 19 | 0.95 | 15.9 2.1 | 11.9 1.3 | 14.6 1.6 |
| 13 | 25-02-2023 | 18:40 | 20:00 | 27 | 37 | 0.62 | 13.1 2.1 | 1.7 0.3 | 11.7 2.1 |
| 14 | 09-04-2023 | 17:55 | 20:13 | 43 | 0.79 | 0.7 1.6 | 0.9 | 1.3 | |
| 15 | 17-04-2023 | 11:28 | 13:43 | 10 | 0.74 | 11.4 2 | 1.9 | 0.5 | |
| 16 | 21-04-2023 | 17:44 | 18:53 | 13 | 1.17 | 1.9 1.3 | 1.1 | 0.7 | |
| 17 | 14-12-2023 | 16:45 | 17:24 | 5 | 49 | 0.98 | 17.7 2.2 | 1 | 15.8 2 |
| 18 | 20-01-2024 | 08:20 | 09:18 | 0.60 | 8.3 2 | 3.3 0.8 | 1.8 | ||
| 19 | 10-02-2024 | 22:45 | 23:40 | 13 | 0.40 | 0.5 2.5 | 0.3 1.7 | 0.4 1.8 | |
| 20 | 03-05-2024 | 02:06 | 03:12 | 25 | 0.75 | 13.0 2.2 | 11.4 1.7 | 1.2 | |
| 21 | 28-07-2024 | 00:52 | 02:26 | 0.77 | 12.1 2 | 0.4 0.1 | 12.3 2 | ||
| 22 | 22-04-2025 | 06:31 | 08:30 | 0.72 | 13.7 2.1 | 2.1 | 1.6 0.2 | ||
| 23 | 30-05-2025 | 23:31 | 00:51 | 14 | 0.36 | 0.4 2.7 | 0.1 0.7 | 2.6 | |
| 24 | 05-08-2025 | 15:37 | 16:17 | 6 | 4 | 0.90 | 20.5 2.4 | 1.4 | 16.8 2 |
| 25 | 03-10-2025 | 04:48 | 05:43 | 12 | 11 | 0.85 | 14.0 2 | 5.0 0.7 | 1.9 |
| 26 | 12-10-2025 | 13:04 | 15:22 | 23 | 11 | 1.29 | 3.3 1.3 | 3.1 1.2 | 1.2 0.5 |
| 27 | 05-11-2025* | 22:00 | 22:33 | 30 | 0.94 | 14.8 1.9 | 0.2 | 13.2 1.9 | |
| 28 | 09-11-2025* | 07:00 | 09:00 | 25 | 0.82 | 12.0 1.9 | 11.6 1.8 | 0.6 | |
| 29 | 11-11-2025* | 09:45 | 10:48 | 24 | 23 | 0.82 | 9.7 1.8 | 1.3 | 1.2 |
| 30 | 14-11-2025* | 08:30 | 09:42 | 22 | 60 | 0.54 | 1.5 2.1 | 2.1 | 0.1 0.1 |
| 31 | 18-01-2026 | 18:00 | 18:13 | -9 | -15 | 1.01 | 13.2 2.1 | 1.5 | 1.5 |
III.2 Catalog content and data products
The DIRECD CME catalog provides a standardized set of data products derived consistently for all cataloged events using the DIRECD software. For each event listed in Table 1, we apply the full analysis pipeline, from coronal dimming identification to CME direction estimation in a uniform and automated manner.
The end-to-end DIRECD processing produces a standardized set of data products for each cataloged event. All products are archived and publicly available through the Zenodo database1212 12 https://doi.org/10.5281/zenodo.20488339. The released dataset contains a total of 64 cataloged CMEs spanning 2010-2026. The dataset comprises 31 newly analyzed CMEs that occurred during solar cycle 25 (2021-2026) that are discussed in detail in this study, plus 33 additional events adopted from earlier DIRECD statistical samples (2010-2021). The core output of the DIRECD analysis is the 3D CME propagation direction inferred from coronal dimming geometry at the end of the dimming impulsive phase. The 3D CME propagation direction is specified by the heliographic longitude and latitude of the source and the 3D coordinates of the cone apex, together with the inclination angle relative to the local radial direction. In addition, the catalog provides the CME angular width and the cone height at which the erupting structure remains connected to the dimming footprint. For completeness, two-dimensional projections of the inclination angle onto the meridional and equatorial planes are also included. Quantitative DIRECD results, including CME cone parameters, and dimming area time series (where available), are provided as plain-text files. Spatial products, including cumulative and timing-resolved coronal dimming masks, are distributed in FITS format. The availability of pre-computed dimming masks allows users to bypass the dimming detection step and proceed directly to CME direction analysis, optionally adjusting model parameters for specific applications and research needs. These products are provided for all 31 newly analyzed Solar Cycle 25 events listed in Table 1; the public repository also includes the corresponding dimming masks and DIRECD parameters for the additional legacy events adopted from earlier DIRECD statistical samples [24].
These derived geometrical parameters inherently contain uncertainties arising from both the intrinsic challenges of coronal dimming detection and fundamental observational limitations. To rigorously quantify these uncertainties, we developed a statistical framework that propagates the two dominant sources of error through Monte Carlo simulations. We assume that the precision of CME source location on the solar disk carries a conservative range of uncertainty of 20 pixels corresponding to approximately 48 arcseconds given the plate scale of 2.4 arcseconds per pixel for a SDO image. Concurrently, the determination of CME cone height exhibits a relative uncertainty of 10%, translating to approximately 0.1 solar radii, which reflects the limitations in reconstructing precise three-dimensional geometry from two-dimensional projected imagery. We employ comprehensive Monte Carlo simulations with 10,000 iterations to propagate these uncertainties through the DIRECD geometrical model. For each CME event, the simulation incorporated random perturbations within the specified uncertainty ranges for both source location and cone height. The standard deviation of all valid simulations provides our uncertainty estimate for each CME’s inclination angle. Columns 7-10 of table 1 lists the derived best-fit height, 3D inclination angle and 2D angles in planes obtained from DIRECD method for the events under study. A subset of the catalog events were analyzed using SDO/AIA ’quick-look’ data products (Table 1, marked with asterisks*), which are made available within minutes of acquisition, rather than the standard level 1.5 data products that undergo full calibration. Quick-look data are generated by an expedited, automated pipeline designed to prioritize minimal processing time, thereby making solar observations available to the scientific community and space weather forecast centers within minutes of downlink. For the AIA images, quick-look processing applies only the most rudimentary calibrations, such as bias subtraction and a basic flat-field, to facilitate rapid browsing and event detection. Despite these differences, quick-look products retain sufficient quality for dimming detection and CME direction estimation. To quantify this, we reprocessed all four quick-look events in our catalog (events #27–30; Table 1) using the standard, fully calibrated SDO/AIA Level 1.5 data products, applying identical detection parameters, thresholds, and impulsive-phase criteria to those used for the quick-look analysis. For each event, we compare the resulting best-fit cone height and inclination angle derived from the two data products. As evident from Table 2, the quick-look and Level 1.5 results agree to within in cone height (mean difference ) and in inclination angle (mean difference ) across the four events, with the largest discrepancies occurring for event #30 in the quick-look subset. In all four cases the differences remain within, or comparable to, the Monte Carlo uncertainties reported for each event in Table 1, confirming that the rudimentary calibration applied to quick-look data does not measurably degrade the DIRECD-derived CME geometry, supporting its use for near-real-time, operational CME direction estimation.
| # | Event Date | Data | Height (H) | Inclination (I) | (QLL1.5) |
| () | (∘) | ||||
| 27 | 05-11-2025 | QL | 0.94 | 14.8 | H: 0.01, I: 1.0, |
| L1.5 | 0.95 | 13.8 | |||
| 28 | 09-11-2025 | QL | 0.82 | 12.0 | H: 0, I: 0, |
| L1.5 | 0.82 | 12.0 | |||
| 29 | 11-11-2025 | QL | 0.82 | 9.7 | H: 0.01, I: 0.6, |
| L1.5 | 0.81 | 9.1 | |||
| 30 | 14-11-2025 | QL | 0.54 | 1.5 | H: 0.08, I: -1.8, |
| L1.5 | 0.46 | 3.3 |
A particularly strong independent validation of the DIRECD method is provided for the March 28, 2022 event (event #5), for which a detailed multi-spacecraft case study was performed by [44]. In that study, the DIRECD method was applied to coronal dimming detected in STEREO-A/EUVI 195 Å observations, yielding a best-fit cone height of 1.12 , a full angular width of , and a CME propagation direction inclined from the radial direction. The present catalog derives equivalent parameters for the same event using an entirely independent instrument and passband - SDO/AIA 211 Å- obtaining a cone height of 1.1 , a full angular width of , and an inclination angle of . The angular separation between the SDO and STEREO-A was . The two results show a difference of only 0.02 ( 2%), obtained from two different spacecraft, different viewing geometries, and independent detection pipelines. The angular width likewise agrees to within , well within the combined uncertainties of the method. The small residual difference in inclination angle ( vs. ) and filament directions ( vs 11 ∘) is within reasonable limits. This agreement across instruments confirms that the DIRECD-derived cone geometry is robust and not an artifact of a particular passband, threshold choice, or viewing angle. The convergence of results across two independent observational chains for this event therefore constitutes a strong available cross-validation of the DIRECD methodology.
Figure 5 presents the distributions of heights, inclination angles in 3D and angles in plane derived from coronal dimming geometry using DIRECD. The histogram of inclination angles reveals that approximately half of the CMEs (16/31 events) have low inclination angles (), while another 15 events exhibit moderate inclinations in the range. The best-fit cone height distribution shows a pronounced concentration of events between 0.6 and , comprising 23 of 31 CMEs (74%) in our catalog. This finding has significant implications for understanding CME initiation: This height range corresponds to the altitude to which the dimming signatures extend in our observations. The DIRECD cone height is determined by the height at which the dimming area growth rate stabilizes; above this height, the dimming geometry no longer constrains the cone geometry. This does not imply loss of magnetic connectivity- the CME remains connected to the solar surface at all heights-but rather reflects the limit of geometric constraints available from coronal dimming observations. To further characterize the 3D propagation directions, we show the histograms of meridional and equatorial components. The histograms of the projections of the 3D inclination into the meridional (longitidudinal) and equatorial (latitudinal) planes reveals that half of the events have a low deflection of in longitudinal and latitudinal direction.


Figure 6 displays the heliographic distribution of source locations as a function of heliographic longitude and latitude, for each of the three inclination measures. The inclination angles vary between while the heights are located within the low corona (typically ). The spatial spread across longitudes and latitudes reflects the broad distribution of source active regions, without strong preferential latitudinal bias or longitudinal bias.
Panels (a) and (b) show the total 3D inclination against latitude and longitude respectively. Panel (a) shows that there is a weak positive trend (slope = , r= , p=0.06) which is close to the 5% significance level. Against longitude (panel b), no trend is found (r = , p = ). The more informative picture comes from separating the inclination into its meridional and equatorial components. Panel (c) shows the meridional component against latitude. The positive slope (, r = , p = ) indicates that events from the northern hemisphere reveal a tendency to be deflected northward, while those from the southern hemisphere tend to be deflected southward. As a robustness check, Appendix A repeats this analysis including the 33 legacy events adopted from earlier DIRECD statistical samples. Panel (d) of figure 6 shows that the equatorial component does not show any strong dependence on longitude (slope = , r = , p = 0.70) and the values are distributed symmetrically about zero across the full spatial range sampled. This east–west symmetry is consistent with the large-scale axial symmetry of the coronal magnetic field about the solar rotation axis, and serves as an internal consistency check: unlike the meridional component, which has a geometrically preferred direction (the equator), there is no equivalent large-scale structure that would systematically bias CME propagation eastward or westward. Furthermore, no clear relationship was found between CME speed and longitudinal deflection, suggesting that east-west propagation in the low corona is not strongly controlled by eruption kinematics, but is instead dominated by local and likely stochastic variations in the surrounding magnetic environment.
These results indicate a systematic tendency for early CME propagation to occur away from the heliographic equator, in contrast with the equatorward deflection commonly observed at larger heliocentric distances, where global magnetic pressure gradients associated with the heliospheric current sheet (HCS) redirect trajectories toward the solar equatorial plane [9, 28]. Within the low corona (), the initial trajectory is therefore governed primarily by local active-region magnetic field geometry, with erupting flux ropes expelled preferentially along paths of lower magnetic confinement away from the dense, strongly magnetised core of the source region. This local control is nevertheless modulated by the large-scale coronal environment: low-latitude source regions sit closer to the HCS, where the equatorward pressure gradient of the global field may partially offset the poleward tendency, whereas high-latitude regions erupt into an environment where that gradient is weaker and local field geometry dominates more completely. The latitude dependence of deflection within each hemisphere thus suggests that the transition from local active-region control to global coronal-field guidance may already begin to manifest within the low corona, before becoming the dominant influence at greater heights. Southern-hemisphere statistics are too sparse for a comparable latitude-dependent analysis, though the available events are predominantly poleward, consistent with the overall hemispheric trend. The longitude analysis offers no analogous structure: whether events originate from eastern or western longitudes has no bearing on the equatorial deflection component, confirming the absence of any systematic east–west geographic dependence.
The catalog is designed to be reusable and extensible. In addition to the 31 newly analyzed Solar Cycle 25 events presented in Table 1, the publicly released dataset incorporates CME events from earlier statistical samples [24] analyzed using the same DIRECD methodology. For these events, the corresponding coronal dimming masks and dimming-derived CME direction parameters are included in the online catalog, forming a unified dataset spanning multiple event samples.
III.3 CME Geoeffectiveness and Geomagnetic Storm Prediction
The prediction of geomagnetic storm intensity remains one of the most pressing challenges in operational space weather forecasting. Current operational forecasts rely almost exclusively on coronagraph-based observations when CMEs reach heights of 3–5 R⊙. This temporal delay critically constrains early warning capability and limits the window for hazard mitigation. Here we demonstrate that integration of early directional information can help with geoeffectiveness forecasting, one that operates in near real-time and explicitly accounts for whether a CME will actually impact Earth’s magnetosphere.
The three-dimensional CME propagation directions determined from low-coronal dimming observations can be leveraged to improve space weather forecasting, particularly the prediction of geomagnetic storm intensity. To assess the practical utility of the DIRECD-derived directions, we computed the correlation between observed geomagnetic disturbance indices from OMNI hourly data [41] and a composite measure combining the measure of early CME direction and reliable CME speed obtained from CDAW/LASCO catalog [18] for 28/31 events. For the remaining 3 events, the CME was either classified as a ”poor-event” or its speed was not available in the catalog.
To quantify CME direction, we use the angular miss distance , defined as the angular separation between the CME’s inferred propagation direction axis (determined from DIRECD analysis of coronal dimming geometry) and the Sun-Earth line, approximated using the CME’s launch location. Here, Lat and Lon denote the heliographic latitude and longitude of the CME launch site, which is estimated by the flare source region for on-disk events (within –). If is the meridional angle and is the equatorial angle obtained from DIRECD, then the angular miss distance E is given by:
| (1) |
For each CME in the sample, the associated geomagnetic response was identified through a multi-step temporal association procedure. An expected arrival window at Earth was first estimated from the CME launch time and the plane-of-sky speed measured from LASCO coronagraph imagery, using a simple ballistic propagation model that assumes constant velocity over the Sun–Earth distance of 1 AU:
| (2) |
Within this window, the OMNI solar wind dataset [41] was inspected for signatures consistent with an interplanetary CME (ICME) or driven shock arrival: a sustained enhancement in solar wind speed, an increase in magnetic field magnitude (Bz), a rise in proton density, and, where present, a coherent rotation in the magnetic field vector indicative of a magnetic cloud. For each CME, we identified the minimum Dst value within an expected CME arrival window.
We acknowledge that for events producing only weak geomagnetic responses (Dst above approximately nT), a unique one-to-one attribution between a specific CME and the observed Dst perturbation is inherently ambiguous: the disturbance could equally originate from a co-rotating interaction region (CIR), a high-speed stream (HSS), or a different, temporally proximate CME. Furthermore, not every CME in the catalog is expected to impact Earth’s magnetosphere; a CME may miss Earth entirely or produce no discernible geomagnetic signature. For closely spaced or interacting CMEs, the assigned Dst values represent the associated geomagnetic response within the arrival window and do not imply a unique physical attribution. Nevertheless, we retain all events, including non-storm cases, in the statistical sample to avoid selection bias toward geoeffective events and to sample the full spectrum of CME–geomagnetic coupling, from negligible disturbances to intense storms. The Dst values listed in Table 3 should therefore be interpreted as the geomagnetic activity level temporally associated with each CME, rather than as a definitive causal attribution in every individual case.
| (3) |
where is the absolute magnitude of the Dst geomagnetic disturbance index. Since the predictors are in different units, we standardize them as to ensure fair relative weighting, preventing the speed variable (which spans 200–1800 km s-1) from dominating the geometric term (which spans 10–60 degrees). Linear regression of Equation (3) on the 28 events with complete data results to a of , indicating that the model has a moderate-high correlation with the geomagnetic storm intensity. The resulting best-fit regression coefficients (n = 28) are = 75.9 8.8 nT, = -24.3 9.1, and = 41.5 9.1, where uncertainties denote 1 standard errors. We note that these coefficients apply only to inputs standardized using the sample mean and standard deviation of E and V; they are not intended for direct application to raw, unstandardized values. This is a substantial improvement over speed alone, which achieves (best-fit regression coefficients: = 75.9 9.8 nT and = 36.1 9.8) as shown in Figure 7. The adjusted R2 increases from 0.32 for the speed-only model to 0.45 once the angular miss distance term is included, indicating that the improvement is not simply an artifact of the additional free parameter. It must be noted that the geo-effectiveness also critically depends on the CME’s magnetic field strength and orientation at 1 AU, in particular the duration of southward interplanetary magnetic field (IMF) [29, 43, 45]. While captures the geometric encounter probability, it does not incorporate the CME’s internal magnetic structure.
Following the standard classification [17], the sample comprises 7 non-storm events ( nT), 7 weak storms ( nT), 6 moderate storms ( nT), and 8 intense storms ( nT), with 3 events lacking speed measurements excluded from the classification. All eight intense storms are associated with angular distances below 35∘, and six of the eight have angular distances below 25∘. Conversely, no event with an angular miss distance exceeding 45∘ produces a storm of moderate or greater intensity, regardless of CME speed: events #27 and #30, with speeds of 920 and 1308 km s-1 respectively, yield Dst minima of only -58 and -25 nT owing to their angular miss distances of 63.5∘ and 63.3∘. This can be attributed to the geometrical interpretation that at large angular offsets Earth intercepts only the magnetic flank of the ejecta, where the field strength and southward component are substantially reduced relative to the flux-rope core [54, 51, 15, 72].
Among events with angular distances below 25∘, the four events exceeding 1300 km s-1 (#3, #12, #29, #31) all produce intense storms with Dst -105 nT, whereas slower events at comparable angular distances produce weak to moderate responses. However, speed alone is insufficient, as demonstrated by events #27 and #30, that even fast CMEs fail to produce significant geomagnetic activity when the propagation direction deviates substantially from the Sun–Earth line. The joint condition of angular miss distance below approximately 35∘ and plane-of-sky speed above approximately 500 km s-1 correctly identifies the moderate-to-intense storm events in all but one case (#23, 496 km s-1, 17.4∘, Dst = nT), which marginally violates the speed threshold yet produces an intense storm, likely reflecting a particularly favourable magnetic field orientation at Earth for that event. Across the moderate storm class, the observed vs predicted Dst agreement is closest, with residuals generally within 15 nT. For the seven non-storm events, the model consistently overpredicts the geomagnetic response, in several cases by large margins, for example events #18, #19, #22, and #30 are predicted to produce moderate storms of -63, -95,-68, and -63 nT respectively, yet the observed Dst minima remain below -30 nT in all four cases. As noted above, these events are characterised by angular miss distances exceeding 37∘, and the overprediction at large angular offsets suggests that the angular miss distance term in the regression, while necessary, does not fully capture the nonlinear attenuation of geomagnetic impact at high miss angles. A CME flank encounter not only reduces the peak field strength but also shortens the duration of southward field exposure at Earth, both effects acting to suppress ring-current injection below what a linear angular correction would predict [54, 51, 15, 72].
At the opposite extreme, the model underpredicts the most intense storms in the sample although still classifying as extreme-storm events. Events #16, #28, and #31 all exceed their predictions by 50 nT or more while still being in the severe storm category. This may be because of the several reasons: first, the plane-of-sky speeds used here are projection-corrected only approximately, and for events propagating close to the Sun–Earth line the true radial speed may substantially exceed the LASCO measurement; second, exceptionally large and sustained southward excursions, which are not predictable from coronagraph data alone, can drive ring-current injection far beyond what speed-based empirical relations anticipate [50]; third, events #28 and #29 occur within 48 hours of one another and may represent a compound or cannibalism scenario in which the preceding ejecta preconditions the magnetosphere, lowering the threshold for ring-current injection and amplifying the Dst response of the trailing event [51]. The underprediction of extreme storms is a known and widely reported limitation of empirical Dst forecasters [30] and further shows that the physics-based modelling, incorporating in-situ magnetic field data, is necessary to supplement the early-warning capability demonstrated here. The early CME propagation direction is the primary binary classifier of geoeffectiveness, while speed modulates intensity for well-directed events, and residual variance is attributable to interplanetary magnetic field evolution that is inaccessible to near-Sun remote sensing.
| # | Date | Start Time | Speed | Angular | Dst | Observed Dst | Predicted Dst |
| (km/s) | Distance (°) | Peak Time | (nT) | (nT) | |||
| 1 | 28-09-2021 | 05:23 | 524 | 44.7 | 01-10-2021/14:00 | 31 | -20 |
| 2 | 09-10-2021 | 06:20 | 712 | 25.0 | 12-10-2021/14:00 | 65 | -70 |
| 3 | 02-11-2021 | 01:20 | 1473 | 19.4 | 04-11-2021/13:00 | 105 | -152 |
| 4 | 14-01-2022 | 12:17 | 1341 | 49.3 | 14-01-2022/22:00 | 91 | -90 |
| 5 | 28-03-2022 | 10:46 | 702 | 13.5 | 31-03-2022/17:00 | 37 | -89 |
| 6 | 30-03-2022 | 17:21 | 641 | 23.9 | 01-04-2022/06:00 | 46 | -65 |
| 7 | 04-04-2022 | 20:22 | 271 | 35.1 | 08-04-2022/00:00 | 26 | -12 |
| 8 | 25-05-2022 | 17:22 | 1134 | 46.7 | 28-05-2022/07:00 | 63 | -75 |
| 9 | 16-07-2022 | 02:31 | — | 24.2 | - | - | - |
| 10 | 14-10-2022 | 21:38 | 424 | 43.1 | 17-10-2022/03:00 | 20 | -14 |
| 11 | 10-02-2023 | 02:30 | — | 32.6 | - | - | - |
| 12 | 24-02-2023 | 19:40 | 1336 | 20.6 | 27-02-2023/12:00 | 132 | -137 |
| 13 | 25-02-2023 | 18:40 | 1170 | 34.8 | 27-02-2023/21:00 | 111 | -98 |
| 14 | 09-04-2023 | 17:55 | 490 | 47.1 | 15-04-2023/10:00 | 21 | -12 |
| 15 | 17-04-2023 | 11:28 | 322 | 20.0 | 19-04-2023/14:00 | 36 | -42 |
| 16 | 21-04-2023 | 17:44 | 1284 | 26.5 | 24-04-2023/05:00 | 213 | -122 |
| 17 | 14-12-2023 | 16:45 | 948 | 33.4 | 17-12-2023/16:00 | 77 | -79 |
| 18 | 20-01-2024 | 08:20 | 850 | 37.2 | 24-01-2024/04:00 | 15 | -63 |
| 19 | 10-02-2024 | 22:45 | 817 | 16.3 | 14-02-2024/03:00 | 20 | -95 |
| 20 | 03-05-2024 | 02:06 | 808 | 19.4 | 06-05-2024/01:00 | 43 | -89 |
| 21 | 28-07-2024 | 00:52 | 522 | 28.2 | 30-07-2024/11:00 | 31 | -47 |
| 22 | 22-04-2025 | 06:31 | 1042 | 45.2 | 24-04-2025/20:00 | 29 | -68 |
| 23 | 30-05-2025 | 23:31 | 496 | 17.4 | 03-06-2025/10:00 | 108 | -63 |
| 24 | 05-08-2025 | 15:37 | 338 | 14.1 | 09-08-2025/10:00 | 85 | -53 |
| 25 | 03-10-2025 | 04:48 | 196 | 7.5 | 07-10-2025/12:00 | 46 | -51 |
| 26 | 12-10-2025 | 13:04 | — | 22.2 | - | - | - |
| 27 | 05-11-2025 | 22:00 | 920 | 63.5 | 08-11-2025/07:00 | 58 | -26 |
| 28 | 09-11-2025 | 07:00 | 792 | 18.5 | 11-11-2025/04:00 | 217 | -89 |
| 29 | 11-11-2025 | 09:45 | 1772 | 23.4 | 13-11-2025/07:00 | 143 | -174 |
| 30 | 14-11-2025 | 08:30 | 1308 | 63.3 | 16-11-2025/23:00 | 25 | -63 |
| 31 | 18-01-2026 | 18:00 | 1842 | 33.1 | 20-01-2026/16:00 | 236 | -165 |

IV Discussion and Conclusion
This paper presents a CME direction catalog that combines 31 newly analyzed Solar Cycle 25 events with 33 events adopted from earlier DIRECD statistical samples, resulting in a total of 64 cataloged CMEs and providing a validated, extensible reference dataset for early CME propagation studies. The catalog provides a standardized and reusable set of dimming-derived CME propagation parameters in the low corona, including the three-dimensional direction, inclination in the meridional and equatorial plane (lat/lon), angular width, and the cone height at which the erupting structure remains connected to the dimming footprint, together with coronal dimming masks, timing information, and dimming area evolution products used to derive these parameters. The DIRECD software successfully operationalizes the DIRECD method, offering a user-friendly, web-based interface that automates the workflow from SDO/AIA data acquisition and calibration to dimming detection and 3D CME cone modeling.
Using two representative events from the catalog (24 February 2023 and 18 January 2026), we demonstrated that the DIRECD workflow can robustly reconstruct CME cone geometries directly from the dimming footprint at the end of the dimming impulsive phase, i.e., at heights well below the coronagraph occulting disk where traditional white-light reconstructions are unavailable. The resulting catalog distributions show that the majority of events exhibit low-to-moderate inclination angles, ranging from to , with 16 of 31 events (52%) having inclinations and 14 events (45%) falling in the – range. The best-fit cone heights span – and cluster strongly in the low corona, with 23 of 31 events (74%) concentrated between and . The catalog supports quantitative downstream use in CME modeling, inter-comparison studies, and space weather forecasting applications by providing the best-fit CME geometry parameters and associated uncertainties derived from Monte Carlo propagation of the dominant error sources.
The decomposition of inclination angles into meridional and equatorial components reveals a clear asymmetry in early CME propagation behaviour. Meridional inclinations exhibit a systematic tendency toward latitude-dependent deflection, with poleward deflection being more pronounced at higher source latitudes, whereas equatorial inclinations remain symmetrically distributed about zero with no significant dependence on longitude. This indicates that the early propagation direction of CMEs is influenced by source latitude, but not by source longitude. The observed poleward behaviour for CMEs occurring at high latitudes, in contrast to the equatorward deflections reported from coronagraph observations at larger heliocentric distances, provides observational evidence of a distance-dependent CME deflection. The results suggest that the earliest stages of CME propagation are governed primarily by the local magnetic field geometry of the source active region, while the influence of the large-scale coronal magnetic field and the heliospheric current sheet becomes increasingly important at greater heights. The tendency for lower-latitude events to exhibit weaker poleward deflections further suggests that this transition between local and global magnetic control may already begin within the low corona for eruptions occurring close to the solar equatorial plane. This highlights the diagnostic value of dimming-based direction estimates for probing the earliest phase of CME propagation. Since DIRECD derives its directional estimates from low-coronal EUV observations during the impulsive phase of the eruption, these constraints become available well before the CME enters the coronagraph field of view, offering a complementary pathway for early CME-driven geomagnetic storm forecasting analogous to what coronal hole observations provide for CIR/HSS-driven storms [39].
Independent cross-validation for March 28, 2022 event against STEREO and SDO spacecrafts further supports the reliability of the dimming-inferred propagation directions and shows strong morphological consistency between the dimming-derived direction and the observed CME expansion axis at larger heliocentric distances. In this sense, the DIRECD catalog provides a bridge between low-coronal signatures and the height ranges commonly used in heliospheric propagation modeling.
We further demonstrate the practical utility of DIRECD-derived directional constraints for space weather forecasting. By constructing a linear geoeffectiveness model that combines the standardized CME speed and the angular miss distance E, a geometric measure of how closely the CME propagation axis aligns with the Sun–Earth line, derived from coronal dimming geometry - we show that incorporating early directional information improves the correlation with observed geomagnetic storm intensity, with correlation increasing from to when directional information is added to CME speed. Moreover, the regression correctly classifies the moderate-to-intense storm events with the joint condition of angular miss distance below approximately 35∘ and CME speed above 500 km s-1 in all but one case in our study. Since DIRECD derives its directional estimates from low-coronal EUV observations during the impulsive phase of the eruption, these constraints become available well before the CME enters the coronagraph field of view, offering a meaningful extension of the early warning window for operational space weather forecasting.
An important distinction of the present analysis is that we use the initial plane-of-sky CME speed measured close to the Sun from the CDAW/LASCO catalog [18], rather than the in-situ ICME speed measured at 1 AU that is commonly employed in CME–Dst correlation studies [57, 71, 30]. This choice is deliberate and motivated by the forecasting context of this work: the DIRECD-derived propagation directions become available within minutes of eruption onset from low-coronal EUV observations, and the LASCO speed is typically measured within 1–2 hours thereafter, whereas in-situ speeds are only available upon CME arrival at Earth, at which point forecasting is no longer relevant.
Correlations based on initial (near-Sun) CME speeds are generally expected to be lower than those using in-situ speeds, because CMEs undergo significant acceleration or deceleration during interplanetary transit [19]. Indeed, previous studies using in-situ ICME speeds have reported correlations with Dst in the range – [57, 71], whereas Yurchyshyn et al. [71] obtained a moderate correlation of only between CME initial speed and Dst for halo CMEs. The fact that our combined model achieves using initial speeds is therefore notable and suggests that the inclusion of the angular miss distance , which captures whether the CME nose or flank encounters Earth, compensates for the additional scatter introduced by using the near-Sun speed. In direct comparison, our model achieves using initial speed alone and when the DIRECD-derived angular miss distance is included. The improvement demonstrates that directional information partially compensates for the absence of in-situ data, making our correlation coefficients comparable to those achieved by Srivastava and Venkatakrishnan [57] using in-situ speeds, despite relying exclusively on remote-sensing parameters available within hours of eruption onset.
More broadly, Richardson and Cane [50] demonstrated that the southward component of the interplanetary magnetic field () remains the dominant driver of storm intensity, with CME speed playing a secondary modulating role, and that correlations based solely on CME speed rarely exceed – unless magnetic field information is incorporated. Using in-situ parameters, Kim et al. [30] developed an empirical Dst prediction model based on solar wind speed and , achieving prediction efficiencies of approximately 0.6–0.7 for moderate-to-intense storms, later refined for two-step forecasting by Kim et al. [31].
Beyond single-event dynamics, Rodríguez Gómez et al. [51], Vennerstrom et al. [64] showed that successive CME impacts systematically enhance storm intensity beyond what single-event models predict. A comparable forecasting framework for a different class of geomagnetic storms was developed by Nitti et al. [39], who showed that CIR/HSS-driven storms can be predicted from coronal hole areas and magnetic polarity, achieving correlations of – for the Dst index with a lead time of several days. That approach targets the recurrent, slowly evolving component of geomagnetic activity, whereas the present work addresses the impulsive, CME-driven component. Crucially, coronal dimmings are available within minutes of eruption onset, well before the CME enters the coronagraph field of view. This opens a complementary pathway for early geomagnetic storm forecasting from solar EUV observations, extending warning times for CME-driven events in a manner analogous to what coronal hole observations provide for CIR/HSS-driven storms.
A key additional outcome is the demonstrated potential for near real-time operation. For events processed using SDO “quick-look” data, the DIRECD pipeline successfully reproduced the full workflow, indicating that dimming-based CME direction estimation can be executed using promptly available EUV observations. This capability is relevant for operational space weather settings, where early estimates of CME direction and angular extent are needed as inputs to heliospheric propagation and ensemble forecasting tools, and where rapid updates can improve warning lead times.
Future extension of the catalog and continued development of the DIRECD software will focus on expanding its compatibility with near real-time data from additional EUV imagers (e.g., STEREO and future missions) to enhance its potential for operational space weather forecasting. In addition, a promising direction for future work is the extension of the DIRECD concept to off-limb EUV observations, which would allow dimming-based constraints on CME geometry to be applied to eruptions originating near or beyond the solar limb. Such developments would further strengthen the linkage between low-coronal signatures and coronagraph observations, enabling more continuous tracking of CME direction and expansion from the low corona into the outer corona. The public availability of both the catalog and software aims to encourage community adoption, validation, and collaborative improvement of this tool for CME direction analysis. As the catalog grows, it can also support statistically robust investigations of how low-coronal direction and geometry relate to CME evolution at larger LASCO/STEREO heights and to heliospheric consequences, strengthening the end-to-end connection from eruption onset to space weather impacts.
Author contributions.
S.J. and T.P. developed the method and led the writing of the paper. A.V., K.D., and A.R. contributed to the conceptualization of this study, data analysis, and writing. S.J. developed the DIRECD software. All authors discussed the results and provided feedback on the manuscript.References
- [1] (2025) Coronal mass ejection arrival forecasting with the drag-based assimilation of satellite observations. The Astrophysical Journal Supplement Series 281 (2), pp. 29. External Links: Document Cited by: §I.
- [2] (2021) Evaluation of CME Arrival Prediction Using Ensemble Modeling Based on Heliospheric Imaging Observations. Space Weather 19 (1), pp. e02553. External Links: Document, 2008.02576 Cited by: §I.
- [3] (2006) Using the Evolution of Coronal Dimming Regions to Probe the Global Magnetic Field Topology. Sol. Phys. 238 (1), pp. 117–139. External Links: Document Cited by: §I.
- [4] (2004) Role of projection effects on solar coronal mass ejection properties: 1. a study of cmes associated with limb activity. Journal of Geophysical Research: Space Physics 109 (A3), pp. None (english). External Links: Document Cited by: §I.
- [5] (2010) Propagation of an Earth-directed coronal mass ejection in three dimensions. Nature Communications 1 (6), pp. 74. External Links: Document, 1010.0643 Cited by: §I.
- [6] (2017) Origin and Structures of Solar Eruptions I: Magnetic Flux Rope. Science China Earth Sciences 60, pp. 1383–1407. External Links: Document, 1705.08198 Cited by: §I.
- [7] (2020) Coronal Dimmings Associated with Coronal Mass Ejections on the Solar Limb. ApJ 896 (1), pp. 17. External Links: Document, 2005.03348 Cited by: §I.
- [8] (2023) Three-dimensional relation between coronal dimming, filament eruption, and CME. A case study of the 28 October 2021 X1.0 event. A&A 678, pp. A166. External Links: Document, 2308.09815 Cited by: §II.
- [9] (2004) On the three-dimensional configuration of coronal mass ejections. Astronomy & Astrophysics 422 (1), pp. 307–322. External Links: Document Cited by: §III.2.
- [10] (2018) On the Detection of Coronal Dimmings and the Extraction of Their Characteristic Properties. ApJ 855 (2), pp. 137. External Links: Document, 1802.03185 Cited by: §I, §II, §III.1.
- [11] (2018) Statistics of Coronal Dimmings Associated with Coronal Mass Ejections. I. Characteristic Dimming Properties and Flare Association. ApJ 863 (2), pp. 169. External Links: Document, 1807.05056 Cited by: §I, §II.
- [12] (2019) Statistics of Coronal Dimmings Associated with Coronal Mass Ejections. II. Relationship between Coronal Dimmings and Their Associated CMEs. ApJ 874 (2), pp. 123. External Links: Document, 1810.01589 Cited by: §I.
- [13] (2023) The 17 April 2021 widespread solar energetic particle event. A&A 674, pp. A105. External Links: Document, 2303.10969 Cited by: §I.
- [14] (2018) The drag-based ensemble model (dbem) for coronal mass ejection propagation. The Astrophysical Journal 854 (2), pp. 180. External Links: Document Cited by: §I.
- [15] (2006) Geoeffective analysis of cmes under current sheet magnetic coordinates. Astrophysics and Space Science 305 (1), pp. 37–47. External Links: Document Cited by: §III.3, §III.3.
- [16] (2019) Tracking and Validating ICMEs Propagating Toward Mars Using STEREO Heliospheric Imagers Combined With Forbush Decreases Detected by MSL/RAD. Space Weather 17 (4), pp. 586–598. External Links: Document, 1904.10859 Cited by: §I.
- [17] (1994) What is a geomagnetic storm?. Journal of Geophysical Research: Space Physics 99 (A4), pp. 5771–5792. External Links: Document Cited by: §III.3.
- [18] (2009) The SOHO/LASCO CME Catalog. Earth Moon and Planets 104 (1-4), pp. 295–313. External Links: Document Cited by: §I, §III.3, §IV.
- [19] (2001) Predicting the 1-AU arrival times of coronal mass ejections. J. Geophys. Res. 106 (A12), pp. 29207–29218. External Links: Document Cited by: §IV.
- [20] (2018) Modeling the Evolution and Propagation of 10 September 2017 CMEs and SEPs Arriving at Mars Constrained by Remote Sensing and In Situ Measurement. Space Weather 16 (8), pp. 1156–1169. External Links: Document, 1803.00461 Cited by: §I.
- [21] (2003) Coronal dimming and the coronal mass ejection onset. A&A 400, pp. 1071–1083. External Links: Document Cited by: §I.
- [22] (2000) A spectroscopic study of coronal dimming associated with a coronal mass ejection. A&A 358, pp. 1097–1108. Cited by: §I.
- [23] (1996) A Long-Duration Solar Flare with Mass Ejection and Global Consequences. ApJ 470, pp. 629. External Links: Document Cited by: §I.
- [24] (2025) Validating direcd: statistical evaluation of coronal mass ejection direction estimates from coronal dimmings. Astrophysical Journal Supplement Series 281, pp. 14. External Links: Document Cited by: Appendix A, §I, §I, §II, §II, §III.1, §III.2, §III.2.
- [25] (2024) Coronal dimmings as indicators of the direction of early coronal mass ejection propagation. A&A 683, pp. A15. External Links: Document Cited by: §I, §II.
- [26] (2024) Estimating the early propagation direction of the coronal mass ejection with DIRECD during the severe event on May 8 and for the follow-up event on June 8, 2024. A&A 692, pp. A214. External Links: Document, 2410.18549 Cited by: §I, §II, §II.
- [27] (2020) Coronal dimming as a proxy for stellar coronal mass ejections. In Solar and Stellar Magnetic Fields: Origins and Manifestations, A. Kosovichev, S. Strassmeier, and M. Jardine (Eds.), IAU Symposium, Vol. 354, pp. 426–432. External Links: Document, 2002.06249 Cited by: §I.
- [28] (2015) The heliocentric distance where the deflections and rotations of solar coronal mass ejections occur. The Astrophysical Journal Letters 811 (2), pp. L36. External Links: Document Cited by: §III.2.
- [29] (2017) Coronal mass ejections and their sheath regions in interplanetary space. Living Reviews in Solar Physics 14 (1), pp. 5. External Links: Document Cited by: §III.3.
- [30] (2010) An empirical model for prediction of geomagnetic storms using initially observed cme parameters at the sun. Journal of Geophysical Research: Space Physics 115 (A12). External Links: Document Cited by: §III.3, §IV, §IV.
- [31] (2014) Two-step forecast of geomagnetic storm using coronal mass ejection and solar wind condition. Space Weather 12 (4), pp. 246–256. External Links: Document Cited by: §IV.
- [32] (2015) Solar demon–an approach to detecting flares, dimmings, and euv waves on sdo/aia images. Journal of Space Weather and Space Climate 5, pp. A18. External Links: Document Cited by: §III.1.
- [33] (2012) The atmospheric imaging assembly (aia) on the solar dynamics observatory (sdo). Solar Physics 275 (1), pp. 17–40. External Links: Document Cited by: §II.
- [34] (2010) Reconstructing Coronal Mass Ejections with Coordinated Imaging and in Situ Observations: Global Structure, Kinematics, and Implications for Space Weather Forecasting. ApJ 722 (2), pp. 1762–1777. External Links: Document, 1009.1414 Cited by: §I.
- [35] (2017) Mass-Loss Evolution in the EUV Low Corona from SDO/AIA Data. Sol. Phys. 292 (1), pp. 6. External Links: Document, 1611.00849 Cited by: §I.
- [36] (2017) Modeling solar energetic particle events using enlil heliosphere simulations. Space Weather 15 (7), pp. 934–954. External Links: Document Cited by: §I.
- [37] (2009) Expansion Speed of Coronal Mass Ejections. Sol. Phys. 260 (2), pp. 401–406. External Links: Document Cited by: §I.
- [38] (2015) SunPy—python for solar physics. Computational Science & Discovery 8 (1), pp. 014009. Cited by: §II.
- [39] (2023) Geomagnetic storm forecasting from solar coronal holes. MNRAS 519 (2), pp. 3182–3193. External Links: Document, 2211.16572 Cited by: §IV, §IV.
- [40] (2021) CME Magnetic Structure and IMF Preconditioning Affecting SEP Transport. Space Weather 19 (4), pp. e2020SW002654. External Links: Document, 2102.05514 Cited by: §I.
- [41] (2020) OMNI hourly data set. Heliophysics Digital Resource Library (HDRL) dataset, pp. 1. Cited by: §II, §III.3, §III.3.
- [42] (2012) The solar dynamics observatory (sdo). Springer. External Links: Document Cited by: §II.
- [43] (2012) Extended geomagnetic storm forecast ahead of available solar wind measurements. Space Weather 10, pp. S07001. External Links: Document Cited by: §II, §III.3.
- [44] (2024) Three-part structure of a solar coronal mass ejection observed in low coronal signatures of Solar Orbiter. A&A 691, pp. A344. External Links: Document, 2410.20603 Cited by: §I, §III.2.
- [45] (2018) Geomagnetic storm forecasting service StormFocus: 5 years online. Journal of Space Weather and Space Climate 8, pp. A22. External Links: Document, 1802.06590 Cited by: §II, §III.3.
- [46] (2019) Three-dimensional Reconstructions of Extreme-ultraviolet Wave Front Heights and Their Influence on Wave Kinematics. ApJ 877 (2), pp. 68. External Links: Document, 1904.09427 Cited by: §I.
- [47] (2018) EUHFORIA: european heliospheric forecasting information asset. Journal of Space Weather and Space Climate 8, pp. A35. External Links: Document Cited by: §I.
- [48] (2017) Gradual Solar Coronal Dimming and Evolution of Coronal Mass Ejection in the Early Phase. ApJ 838 (1), pp. L6. External Links: Document, 1707.02480 Cited by: §I.
- [49] (2025) Coronal dimmings from active region 13664 during the may 2024 solar energetic events. Astronomy & Astrophysics 699, pp. A40. External Links: Document Cited by: §I.
- [50] (2011) Geoeffectiveness (dst and kp) of interplanetary coronal mass ejections during 1995–2009 and implications for storm forecasting. Space Weather 9 (7). External Links: Document Cited by: §III.3, §IV.
- [51] (2020) Clustering of fast coronal mass ejections during solar cycles 23 and 24 and the implications for cme–cme interactions. The Astrophysical Journal 899 (1), pp. 47. External Links: Document Cited by: §III.3, §III.3, §III.3, §IV.
- [52] (2016) ElEvoHI: A Novel CME Prediction Tool for Heliospheric Imaging Combining an Elliptical Front with Drag-based Model Fitting. ApJ 824 (2), pp. 131. External Links: Document, 1605.00510 Cited by: §I.
- [53] (2012) Constraining the Kinematics of Coronal Mass Ejections in the Inner Heliosphere with In-Situ Signatures. Sol. Phys. 276 (1-2), pp. 293–314. External Links: Document, 1110.0300 Cited by: §I.
- [54] (2024) Understanding the effects of spacecraft trajectories through solar coronal mass ejection flux ropes using 3dcoreweb. The Astrophysical Journal 973 (2), pp. 150. External Links: Document Cited by: §III.3, §III.3.
- [55] (2005) The association of coronal mass ejections with their effects near the Earth. Annales Geophysicae 23 (3), pp. 1033–1059. External Links: Document Cited by: §I.
- [56] (2016) Magnetohydrodynamic simulation of interplanetary propagation of multiple coronal mass ejections with internal magnetic flux rope (susanoo-cme). Space Weather 14 (2), pp. 56–75. External Links: Document Cited by: §I.
- [57] (2004) Solar and interplanetary sources of major geomagnetic storms during 1996–2002. Journal of Geophysical Research: Space Physics 109 (A10). External Links: Document Cited by: §IV, §IV.
- [58] (1997) Yohkoh SXT Observations of X-Ray “Dimming” Associated with a Halo Coronal Mass Ejection. ApJ 491 (1), pp. L55–L58. External Links: Document Cited by: §I.
- [59] (2006) Modeling of Flux Rope Coronal Mass Ejections. ApJ 652 (1), pp. 763–773. External Links: Document Cited by: §I.
- [60] (2011) Implementation of the Graduated Cylindrical Shell Model for the Three-dimensional Reconstruction of Coronal Mass Ejections. ApJS 194 (2), pp. 33. External Links: Document Cited by: §I.
- [61] (1998) SOHO/EIT observations of an Earth-directed coronal mass ejection on May 12, 1997. Geophys. Res. Lett. 25 (14), pp. 2465–2468. External Links: Document Cited by: §I.
- [62] (2014) An extreme coronal mass ejection and consequences for the magnetosphere and Earth. Geophys. Res. Lett. 41 (2), pp. 287–292. External Links: Document Cited by: §I.
- [63] (2014) Alfvén wave solar model (awsom): coronal heating. The Astrophysical Journal 782 (2), pp. 81. Cited by: §I.
- [64] (2016) Extreme geomagnetic storms–1868–2010. Solar physics 291 (5), pp. 1447–1481. External Links: Document Cited by: §IV.
- [65] (2025) Coronal dimmings and what they tell us about solar and stellar coronal mass ejections. Living Reviews in Solar Physics 22 (1), pp. 2. External Links: Document, 2505.19228 Cited by: §I.
- [66] (2021) Indications of stellar coronal mass ejections through coronal dimmings. Nature Astronomy 5, pp. 697–706. External Links: Document, 2110.12029 Cited by: §I.
- [67] (2018) Genesis and Impulsive Evolution of the 2017 September 10 Coronal Mass Ejection. ApJ 868 (2), pp. 107. External Links: Document, 1810.09320 Cited by: §I.
- [68] (2013) Propagation of interplanetary coronal mass ejections: the drag-based model. Solar physics 285 (1), pp. 295–315. Cited by: §I.
- [69] (2012) Hinode flare catalogue. Solar Physics 279, pp. 317–322. External Links: Document Cited by: §II, §III.1.
- [70] (2004) A catalog of white light coronal mass ejections observed by the SOHO spacecraft. Journal of Geophysical Research (Space Physics) 109 (A7), pp. A07105. External Links: Document Cited by: §II.
- [71] (2004) Correlation between speeds of coronal mass ejections and the intensity of geomagnetic storms. Space Weather 2 (2). External Links: Document Cited by: §IV, §IV.
- [72] (2005) A tentative study for the prediction of the cme related geomagnetic storm intensity and its transit time. Science in China Series E Technological Sciences 48 (6), pp. 648–668. External Links: Document Cited by: §III.3, §III.3.
- [73] (2004) On the nature of EIT waves, EUV dimmings and their link to CMEs. A&A 427, pp. 705–716. External Links: Document Cited by: §I.
Appendix A Robustness check using the full 64-event catalog
To test the robustness of the meridional inclination–latitude relation reported in Figure 6 in Section III.2, we repeat the analysis after incorporating the 33 legacy events adopted from [24], increasing the sample to 64 events. We apply the same linear regression and bootstrap correlation procedure described in Section III.2 to three samples as shown in figure 8: the 31 newly analyzed Solar Cycle 25 events alone (panel (a), same as panel (c) of Figure 6) , the 33 events from [24] (panel (b)), and the full combined catalog (panel (c)).
The meridional (N–S) deflection shows a significant positive trend with source latitude in all three samples: () for the Solar Cycle 25 sample alone , () for the legacy subsample alone, and () for the combined 64-event catalog. The trend is seen independently in both subsamples and it strengthens once the samples are combined, with the bootstrap uncertainty on shrinking from (Solar Cycle 25 alone) to (combined).
