

Measuring the engine of a liquidation cascade:
subcritical branching inside a first-order transition
Abstract
We study seven major crypto-perpetual liquidation cascades (2022–2025), and in the largest of them we can watch the mechanism directly. From the on-chain fill log of a fully transparent venue we measure the branching ratio of that event—the October 2025 crash, the largest on record—in flight, with both of its factors observed and no free constants. It ran deeply subcritical: the structural ratio and the amplification bookkeeping both place it at – throughout, and a third, flow-based estimator—whose calm-market level is mechanically inflated and must be read as a trajectory—falls through the climax rather than rising. All three agree on subcriticality within the venue, not on a common numerical level. Alongside them, of all post-onset forced selling landed within thirty minutes and of it was absorbed off-book by the venue’s backstop, which drives the branching ratio down precisely at the climax. Across the full set of seven, at onset—the minute ending the steepest hour of each crash—the order parameter (mean inter-asset coupling) jumps by between and baseline standard deviations into a near-fully-ordered phase, while the susceptibility proxy collapses in five of the seven events and diverges in none; the jump is invariant under subsampling (–). The transition is abrupt and scale-robust rather than critical, and its in-cascade signature lives in the liquidity sector: price impact spikes on two venues and two instruments (a factor of – regressed, – quoted directly) while open interest clears by –. The natural mechanistic account—a Galton–Watson cascade with (impact per forced dollar forced notional per unit relative move)—is then eliminated as a description of the pre-cascade state: both of its falsifiable predictions fail at simulated power , on proxied and on directly measured regressors alike. Severity is set by shock map-in-path liquidity withdrawal rather than by a diverging multiplier, which is why none of the scalar pre-state measures we can construct grades it.
1 Introduction
Whether large market crashes are critical transitions—endogenous instabilities that a system approaches gradually, shedding resilience until an infinitesimal shock tips it over—is among the oldest questions in the physics of markets. The program has a long lineage, from the log-periodic critical-point picture of Johansen et al. (2000) and Sornette (2003) to its operational arm, the theory of early-warning signals (EWS): near a critical point the dominant relaxation mode slows, so fluctuations grow more autocorrelated and more variable ahead of the transition (Scheffer et al., 2009). Part I of this series (Garcia Seuma, 2026) put that operational claim to the test on seven major BTC perpetual-futures liquidation cascades (2022–2025) and found it wanting: no single-variable early-warning signal is event-invariant, and the failures are structured—critical slowing down is absent precisely where the shock is most abrupt, echoing earlier doubts that financial meltdowns are critical transitions at all (Guttal et al., 2016).
A negative result on indicators poses, but cannot answer, the prior question: what is the order of the transition? Criticality is a statement about collective structure, not about any single series, and a first-order transition can jump discontinuously with no variable slowing beforehand—exactly the signature Part I reported. Order must therefore be measured where it lives, in the market’s correlation fabric, rather than inferred from the memory of one price. Section 3 does this directly.
A leveraged market makes a second, usually inaccessible, question answerable: the mechanism. The feedback laws here are not hidden model assumptions but published exchange rules—the liquidation engine, funding, and the backstop that clears insolvent positions. The natural mechanistic account is a branching cascade, in which each forced sale moves the price and triggers, on average, some number of further liquidations (Thurner et al., 2012; Filimonov and Sornette, 2012; Cont and Wagalath, 2016). On Hyperliquid, a fully on-chain venue, every open position and every forced fill is public, so the offspring mean of that cascade—the branching ratio —can be measured rather than fitted from aggregate reflexivity. We do exactly that, for the October 2025 cascade—the largest single-day liquidation event recorded in crypto-perpetual markets (Marshall, 2025; Chitra, 2025)—and the answer is that it never came near the critical boundary.
We make four contributions, listed here in reading order. (i) We characterize the transition as first-order in its signatures: at onset the order parameter jumps into a near-fully-ordered phase while the susceptibility proxy collapses rather than diverges, and the jump is invariant under subsampling—a control that rules out panel composition and small-panel artefacts as its source (Sec. 3). (ii) We locate the in-cascade signature in the liquidity sector: price impact spikes and open interest clears, on two venues and two independent measurements of impact (Sec. 4). (iii) We eliminate the branching model as an account of the pre-cascade state: both of its falsifiable predictions fail with simulated power , on proxied and on directly measured regressors alike (Sec. 5). (iv) And—the result that motivates the other three—we provide, to our knowledge, the first in-flight measurement of a record cascade’s branching ratio, from Hyperliquid’s fill log, with both factors observed and no free constants: subcritical throughout, front-loaded almost to instantaneity, and with most of the offspring absorbed off-book by the venue backstop, so that the exchange’s own liquidation waterfall suppresses the very feedback the model is built on—a mechanism-design result with a falsifiable cross-venue prediction (Sec. 6). Read together, (iv) explains (iii): a cascade whose multiplier never approaches unity has no diverging quantity for a pre-state variable to track.
The remainder proceeds through data (Sec. 2), the four results, and a synthesis (Sec. 7). The results are presented as a build rather than in order of importance: the collective characterization first (Sec. 3–4), then the branching model and its elimination (Sec. 5), which is where is defined, and only then the in-flight measurement of that same quantity (Sec. 6). Two contemporaneous works frame ours: Shukla et al. (2026) build high-frequency crypto interaction networks in calm markets, a useful contrast to the in-cascade fabric studied here, and a parallel preprint (rs9, 2025) compares CeFi and DeFi microstructure through the same October 2025 event. We cite both as concurrent rather than antecedent.
2 Data
Our analysis draws on three sources, each with boundaries stated at the outset. The first is a panel of the most liquid Binance USDT-margined perpetuals sampled at five-minute resolution across seven event windows; the panel grows from names in May 2022 to in 2024–2025, a composition change we control for explicitly with the finite-size analysis of Sec. 3. The second is the Binance BTC series—one-minute klines and five-minute derivatives metrics—which underpins the impact regressions and the severity designs. The third is Hyperliquid: a per-minute archive of asset contexts, whose quoted impact prices furnish a direct measure of price impact (no regression required) and of open interest across five events, and the venue’s on-chain fill log, which attributes every forced fill to a liquidated user. The fill log is decisive but time-bounded: it begins on 2025-05-25, so a severity test on measured liquidation density across the historical events is structurally impossible—the October 2025 cascade is necessarily the single case-study arm for the in-flight measurement (Sec. 6). One methodological caution recurs: in the fill log the liquidation object rides both legs of each trade, so all totals are deduplicated by the liquidated-user leg or they double-count.
Events and the onset convention.
Every quantity in this paper is measured relative to a single per-event reference time, the onset. We define it mechanically: the onset is the minute that terminates the most negative 60-minute log return of the event, located automatically inside a search window pinned to the documented cascade date. The search window is necessary rather than cosmetic—run unrestricted over a two-month file, the detector selects a different, larger drawdown inside the same file for three of the seven events. Fixing the onset this way makes “pre-onset”, “days since onset” and “the jump at onset” mean the same thing across events with very different durations, and it commits the convention before any statistic is computed. Table 1 lists the seven cascades, their onsets, and the endogenous/exogenous typing we carry through the paper. That typing is empirical, not causal: it labels the two events in which Part I found no critical slowing down in price autocorrelation (Feb 2025, Oct 2025) as exo and the remaining five as endo. Both exo events happen to be abrupt tariff-news shocks, which is the reading that motivated the label, but the correspondence is not clean—the April 2025 tariff cascade carries a news trigger of the same kind and still shows the endogenous price signature. We therefore treat the typing as a hypothesis inherited from Part I and a convenient grouping for the figures, never as a validated taxonomy, and no claim in this paper rests on it.
| label | trigger | onset (UTC) | type | |
|---|---|---|---|---|
| May ’22 | LUNA/UST collapse | 2022-05-11 12:51 | endo | 22 |
| Nov ’22 | FTX insolvency | 2022-11-08 19:32 | endo | 25 |
| Aug ’24 | yen carry-trade unwind | 2024-08-05 01:10 | endo | 30 |
| Dec ’24 | December leverage flush | 2024-12-09 15:56 | endo | 30 |
| Feb ’25 | first tariff announcement | 2025-02-03 02:07 | exo | 30 |
| Apr ’25 | “Liberation Day” tariffs | 2025-04-07 15:17 | endo | 30 |
| Oct ’25 | record liquidation cascade | 2025-10-10 20:50 | exo | 30 |
3 The transition is first-order in its signatures
A word on what we claim. “First-order” here is an empirical classification by signature, not a thermodynamic one: we do not take an limit, control a temperature, or construct a free energy. The operational criterion is the conjunction of three measurable facts—a discontinuous jump in the order parameter, no divergence of the susceptibility proxy through the transition, and persistence of both under panel subsampling—and what it licenses is the rejection of the critical-point reading in this proxy over these windows, not a proof that criticality is absent from leveraged markets in general. A poorly chosen proxy or a strongly non-equilibrium system could hide a signature that is really there. The contribution is making the discrepancy measurable. The classification is also recurrent rather than universal: the sample is heterogeneous, and the two exceptions are named throughout—May 2022, a multi-day grind whose fabric was already ordered and which therefore has no discrete jump to make, and October 2025, whose does not collapse across its own cascade.
We measure the transition in the cross-asset correlation structure. The order parameter is the mean pairwise coupling (equivalently, the weight of the leading market mode); the susceptibility proxy is , the extensive variance of couplings that would diverge at a genuine critical point.
Across the seven events the order parameter jumps at onset by to base standard deviations in six of seven cases, into a near-fully-ordered phase with – and leading-eigenvalue weight that persists for days; the sole exception is the May 2022 grind, whose fabric was already ordered before onset. The susceptibility does the opposite of what criticality requires: collapses through the transition—a negative jump in five of seven events, reaching sd—and diverges in none. The minimum spanning tree contracts abruptly; for October 2025 its normalized length falls from to in a single step, with a second collective mode emerging above the Marčenko–Pastur edge of the random-matrix spectrum (Laloux et al., 1999; Plerou et al., 2002) at the cascade. That last criterion is conservative in exactly this regime, and asymmetrically so. The nominal edge (here , ) is fixed at unit noise scale, whereas in the ordered phase the market mode absorbs most of the trace: with the residual bulk carries variance , so an edge recalibrated on the deflated spectrum sits near . A second eigenvalue clearing the nominal edge in that regime therefore clears the recalibrated one by roughly a factor of nine. The corollary is that the criterion must not be read in the opposite direction—a decline in the count of supercritical modes through the transition is induced mechanically by the growth of and is not evidence that subdominant factors merge. Separating the two requires an adaptive edge recalibrated on the deflated spectrum together with an eigenvector delocalization filter (García-Medina, 2026); we do not attempt it here.
The decisive control is finite size. A discontinuous onset jump could in principle be a crossover artifact of a small, growing panel; the subsampling analysis rules this out. The susceptibility is extensive in every event and regime (for December 2024 the baseline rises from to as grows from to ), yet the onset jump is -invariant: across the subsampling range—now expressed in base-regime sd units ( d, which exclude the pre-onset build-up and therefore read somewhat larger than the pre-10-day units quoted above)—it holds at – (April), – (December), – (August), – (November), – (February), and – (October), and the ordered-phase collapse of persists at every . A scale-invariant jump with a collapsing, extensive susceptibility is the signature of a first-order transition, not a critical point.
Structure and single-variable precursors dissociate. February 2025, which carried no single-variable early-warning signal in Part I, shows the strongest fabric build-up. We summarise a pre-onset trend by the Kendall rank correlation between an observable and time over the three days before onset, so means the quantity drifts upward into the event and measures how monotone that drift is; for February 2025 the mean coupling gives ahead of onset — the only pre-onset trend that survives block resampling on both fabric metrics (; Table 2). October 2025 is the fabric outlier in the opposite direction, de-correlating into onset (pre-onset , jumping ; descriptive under the resampled null) even as it is the most violent event by every liquidity measure below. The order of the transition is thus not readable from any one series—the motivating fact of Part I, now given its structural cause.
Two boundaries are load-bearing. The event windows overlap (adjacent estimates share of their data), so nominal trend significances are optimistic; we re-derive them with a circular moving-block bootstrap against each event’s full pre-onset stretch (block steps the one-day window length, ). Under that null most pre-onset trends are not significant (Table 2): only the February 2025 build-up and the November 2022 order-parameter drift () survive. The onset jumps—the load-bearing result—are regime means, not trend statistics, and are unaffected. And the coupling is a linear correlation proxy, which understates tail co-movement. Neither boundary affects the qualitative result: a jump-with-collapse repeated across seven events and stable under subsampling.
| onset jump | pre-onset trend in | pre-onset trend in | |||||
|---|---|---|---|---|---|---|---|
| event | type | [sd] | [sd] | ||||
| May ’22 | endo | ||||||
| Nov ’22 | endo | ||||||
| Aug ’24 | endo | ||||||
| Dec ’24 | endo | ||||||
| Feb ’25 | exo | ||||||
| Apr ’25 | endo | ||||||
| Oct ’25 | exo | ||||||


4 The liquidity sector carries the universal signature
The in-cascade signature is universal across venues and instruments, and it lives in the price of liquidity—a market-liquidity spiral in the sense of Brunnermeier and Pedersen (2009), and the order-book dry-up mechanism documented for Bitcoin by Donier and Bouchaud (2015). On Binance, a Kyle-style impact regression (Kyle, 1985) gives a coefficient that spikes during every one of the seven cascades (six-hour means elevated –), with only a modest pre-onset build. On Hyperliquid the same quantity is available directly from quoted impact prices, with no regression: the cascade impact-spread spikes for all six major instruments, by a factor of to in the mean and to at the cascade-day maximum, with a positive pre-onset trend in all six ( to ). Open interest clears hard—to – of baseline on Hyperliquid ( to ), against for Binance BTC. That two venues, two margining conventions, and two independent measurements of impact agree that impact spikes in every cascade—– where regressed, – where quoted directly—is the universal fact any mechanism must reproduce.

5 The branching model and its elimination
The natural mechanistic account is a Galton–Watson branching cascade. Forced selling of notional moves the price by , with the impact per dollar of net aggressor flow (units ); a relative move of size sweeps the liquidation-threshold density over an interval of width , forcing a further of notional. The offspring mean of the resulting branching process is therefore
| (1) |
which is dimensionless. Here is the price level, not a free parameter: it appears because is a density per unit price while impact is expressed as a relative move. Writing for the forced notional per unit relative move—the form in which we measure it throughout—the ratio is simply , a product of two measurable quantities with no free constant. The cascade condition is , and the amplification of an initial shock is . The model makes two falsifiable predictions; both fail.
The first is a timing prediction: if the pre-onset rise in reflects a genuine approach to the boundary, it should stand out against declines of comparable depth that did not cascade. It does not. Against placebo onsets matched on the trailing three-day return, only four of seven events sit above the matched median (Fisher ; for )—not significant—and the effect is substantially mechanical: on placebos, tracks the trailing price path itself (: the deeper the trailing decline, the higher reads). The lone exception is February 2025 (matched percentile , ), recorded as a case finding rather than a rule.
The second is a severity prediction: the zero-parameter unit slope relating realized amplification to . It is rejected in both units (Table 3), price-conditioned () and volume-native (), while the simulated power to detect a true unit slope is and and the estimator is unbiased—so the null is informative, not merely underpowered. The reason is structural: the product cancels itself, with and an incremental of over that is zero to four decimal places.
The refutation hardens on directly measured impact. Replacing the proxied with Hyperliquid quoted impact prices across five events, the unit slope is rejected at every scale with power under two designs; the Binance proxy was itself reliable (, above the attenuation boundary), so the proxied null was not an artifact of measurement error. One sign result does not survive the upgrade, and we flag it as a methods lesson: the negative loading seen on proxied vanishes on measured (, not significant); it sat entirely on the Kyle-estimator component orthogonal to true impact. The punchline is uniform across proxied and measured regressors: none of the scalar pre-state measures we can construct grades severity—not the stock of leverage, not measured book fragility, not their product. This is a statement about the quantities we can build from public pre-cascade data, not a proof that no such quantity exists; Sec. 7 names the one candidate that our designs are structurally unable to test.
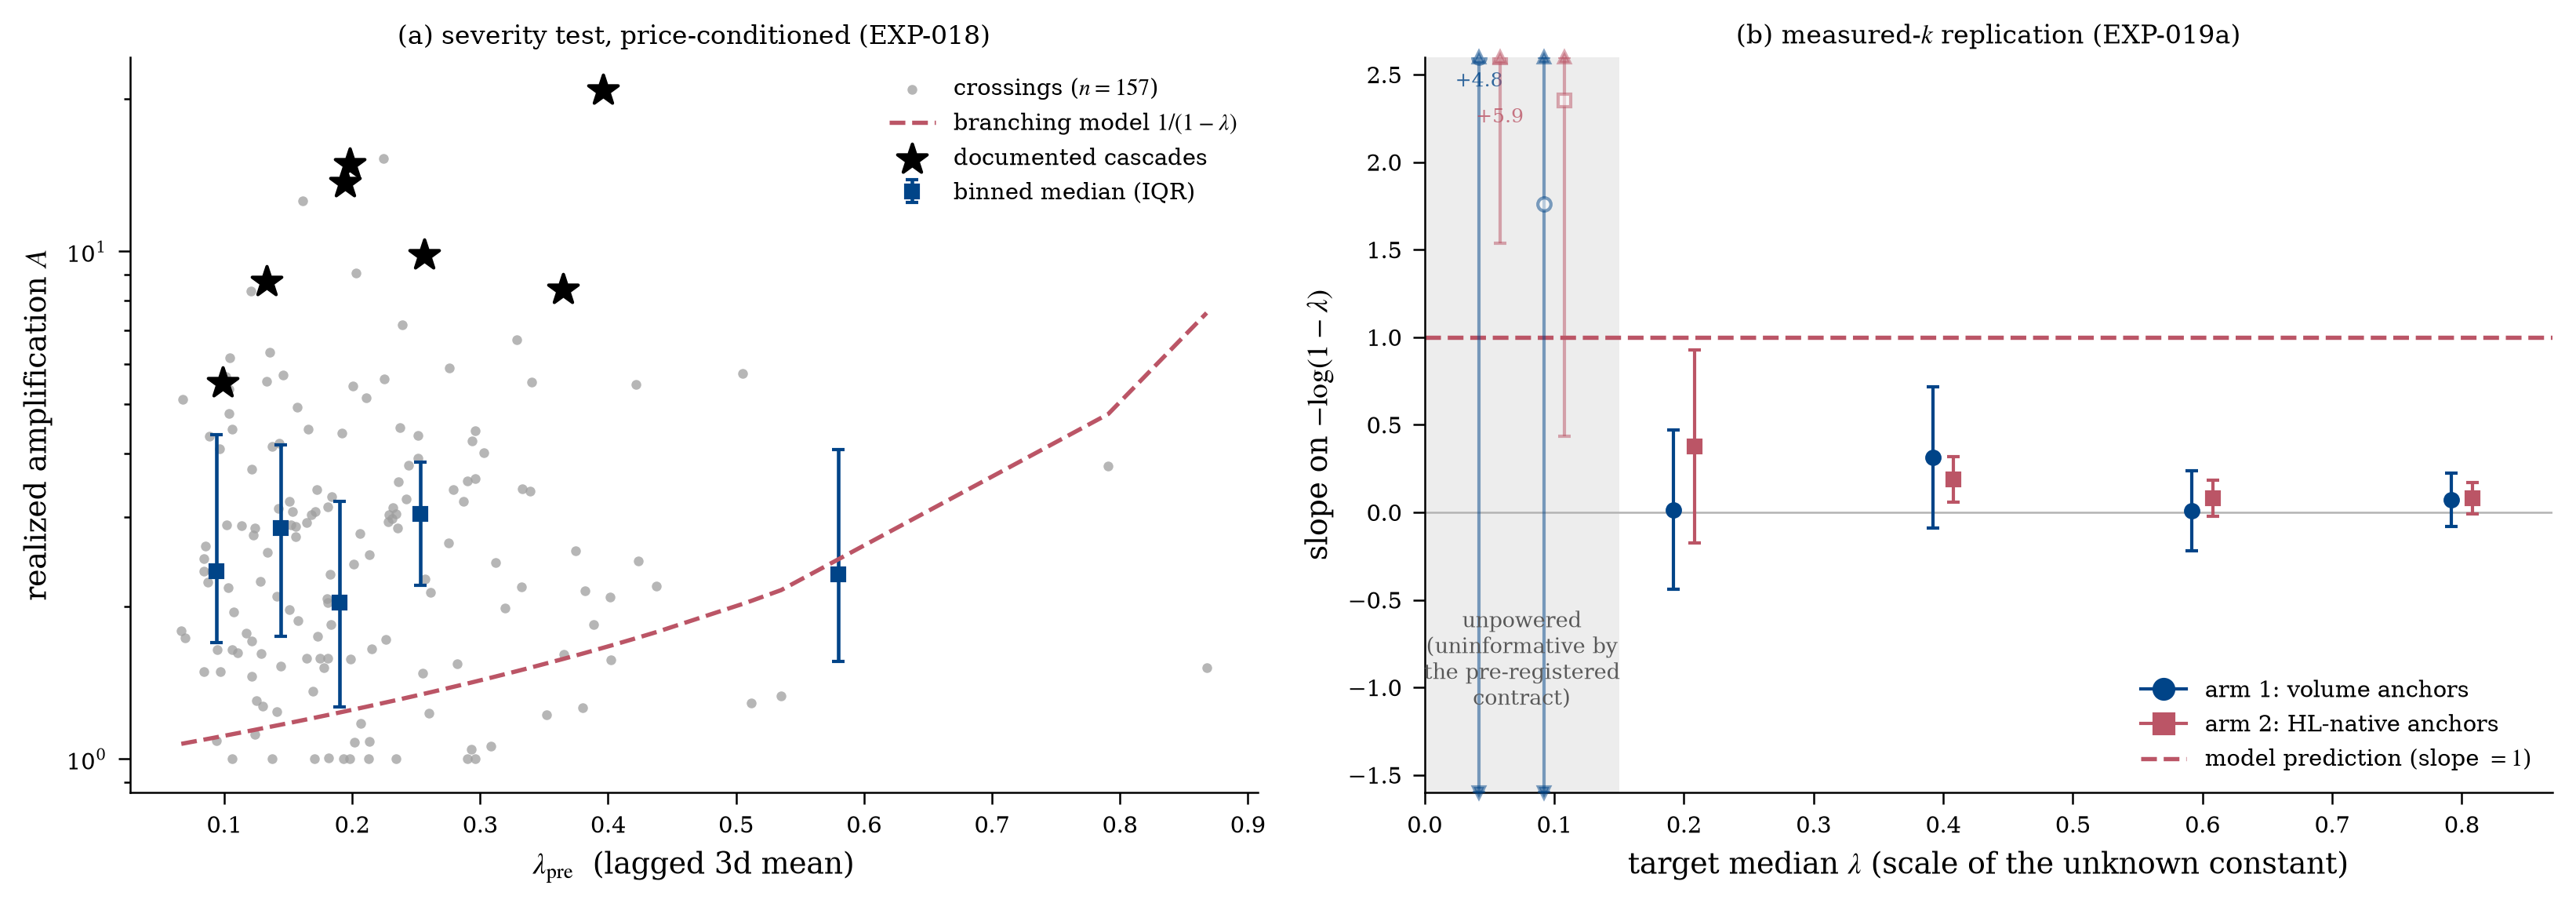
| design | from | slope on | power | |||
|---|---|---|---|---|---|---|
| price-conditioned | Kyle regression | |||||
| volume-native | Kyle regression | |||||
| volume anchors | HL impact px | |||||
| HL-native anchors | HL impact px |
6 The engine, measured in flight
Finally we measure the branching ratio of the record October 2025 cascade in flight, from the Hyperliquid fill log. Three complementary constructions agree. They are not statistically independent—all three read the same event, the same fill log and the same price path, so they share any common timing or classification bias—but they rest on different assumptions, and a shared artefact would have to survive all three to produce the agreement. The structural ratio , with both factors measured in the units of Eq. (1) and no free constants, traces (baseline) (late pre-onset) (nucleation) (peak) (late)—subcritical throughout, with the full regime-by-regime decomposition in Table 4. A flow-based estimator (an INAR/Hawkes read of one-minute forced-sell counts, whose calm-market level sits near from mechanical clustering and must be read as a trajectory, not a level (Hardiman et al., 2013; Kirchner, 2017)) falls to through nucleation rather than rising. And a direct amplification bookkeeping—nucleation-window forced notional M against a full-cascade total M over the following h—gives and an implied . All three place the record cascade firmly below the critical boundary.
The cascade was not a slow chain reaction but an exogenous front-loaded sweep: of all post-onset forced selling occurred in the first 30 minutes ( within an hour), sweeping $733M of book-hitting forced sales across fifty-eight -wide price buckets. Over the full Oct-9 to Oct-11 window the same population sweeps $0.96B across eighty buckets spanning $100.7k–$122.7k, the additional $225M having been swept before onset; the two totals are the same fills under the same sign and deduplication conventions, differing only in the time window. Crucially, most of the offspring never touched the order book. The venue backstop absorbed of post-onset forced-sell notional off-book; in the worst minute (21:19 UTC) M was force-sold, of which the backstop took M against only M on the book. The branching ratio is, in effect, engineered down at the climax—an instance of the automated-deleveraging trilemma (Chitra, 2025)—which yields a concrete, falsifiable design prediction: venues without such a backstop vault should run a hotter realized .

| window (UTC) | [$-1] | [$] | forced | ||
|---|---|---|---|---|---|
| baseline (Oct-9) | $80M | ||||
| pre (Oct-10 00–18) | $91M | ||||
| late-pre (18–20:50) | $55M | ||||
| nucleation (20:50–21:20) | $644M | ||||
| peak (21:20–22:10) | $71M | ||||
| late-casc (22:10–24:00) | $1M | ||||
| aftermath (Oct-11 am) | $18M |
7 Discussion
These four results are one story. Severity is set by shock map-in-path liquidity withdrawal: a first-order jump in the correlation fabric, a subcritical engine that clears its fuel almost instantly, and a pre-cascade state that grades nothing, together explain why Part I found no reliable early-warning signal—the EWS failures are the single-series shadow of a transition that is collective and abrupt rather than gradual and critical.
The central boundary is the venue scope of . Our measured branching ratio is within-venue; the system-level feedback loop runs through the price shared across venues, whose transparent, mirrored coupling we documented separately. Within-venue subcriticality does not preclude system-level amplification, and the network version of the branching measurement is left to future work.
The backstop result speaks to mechanism design: the vault acts as a circuit breaker on branching, trading against the automated-deleveraging trilemma of Chitra (2025). The contrast case is instructive—Binance’s $283M reimbursement and its pre-oracle collateral pricing during the same event (Marshall, 2025) are what the absence of that circuit breaker looks like.
Finally, the results define what a mechanistic model must reproduce, a falsifiable target list for Part III: (a) a first-order order-parameter jump with collapsing; (b) impact spiking – in-cascade; (c) a subcritical in-flight with front-loaded forced flow; and (d) no single-variable early-warning signal yet a fabric-level build-up, as in the February 2025 signature. One pre-state object remains untested by this program: the accumulated map of liquidation thresholds near price—measurable from the fill log—which is not a scalar but a measure swept by the path, and is therefore exactly the kind of state variable our scalar severity designs cannot rule out, and the natural place for a sequel to begin.
A further boundary is the aggregation itself. Equation (1) is a local, differential statement in , whereas and are window estimates over regimes in which price moves by several percent and the book is visibly non-stationary. The regime windows are chosen short enough that the two factors are not averaged across the nucleation boundary, but the product of two window means is not the window mean of the product, and no part of our argument should be read as identifying an instantaneous offspring mean.
Limitations: seven events; BTC-centric severity designs; open-interest-proxied on the historical events, since the fill archive begins 2025-05-25; a single case-study event for the in-flight measurement; and a backstop that actively suppresses the very quantity we measure on the one venue where we can measure it.
8 Conclusion
Across seven major crypto-perpetual liquidation cascades, the transition is first-order and its signature lives in the liquidity sector, not in the memory of any single price. None of the scalar pre-state measures we were able to construct grades severity—leverage stock, measured book fragility, or their product—while the one candidate our designs cannot reach, the accumulated map of liquidation thresholds along the path, remains open: leverage is the fuel, not the fire alarm, and the fire is in the book. On the one venue where the engine can be watched directly, it never went critical—the record cascade of October 2025 ran subcritical, front-loaded, and backstop-absorbed. Whether that subcriticality survives the cross-venue loop is the question we would put next.
Appendix A Spurious dark causality from timestamp misalignment
A cross-venue analysis of the October 2025 event by Pattern Causality yields a methodological result worth isolating, because it can silently corrupt any mixed-source high-frequency study. Binance metrics dumps stamp the interval end, while kline timestamps mark the interval start (empirically, the metric taker ratio and the kline-derived ratio correlate at at exactly min, versus at every other lag). Pairing the two conventions naively—flow one bar ahead of returns—converts the transparent, mirrored leverage–price coupling into an apparent spectrum that is roughly zero-positive, half-negative, and half-dark at twice the surrogate null, including a statistically significant cascade-week “dark causality” rise (Mann–Whitney ) that evaporates entirely under correct alignment. Cross-mapping spectra are alignment-fragile; mixed-source financial pipelines—the principal use case of Pattern Causality—require a timestamp-semantics audit before any spectral claim. This exhibit also cautions linear-Granger network studies built on mixed feeds, such as Shukla et al. (2026).
Reproducibility
Every figure and number in this paper is produced by a script from a frozen experiment record, cited inline as EXP-012–EXP-019b; the records fix the question, data, method, numbers and verdict at run time and are append-only. All three data sources are public and reconstructible without proprietary feeds: Binance panel and BTC series from the public data.binance.vision dumps; the Hyperliquid per-minute asset-context archive from s3://hyperliquid-archive (requester-pays); and the Hyperliquid node fill log from s3://hl-mainnet-node-data. Two conventions are load-bearing for anyone reproducing the numbers and are stated where they are used: Binance metrics dumps stamp the interval end while klines stamp its start (a min realignment, Appendix A), and the fill log’s liquidation object rides both legs of a forced trade, so totals must be deduplicated by the liquidated-user leg. Analysis code is available from the author on request.
References
- rs9 (2025) Same shock, same assets, different microstructure: A comparative analysis of CeFi and DeFi venue performance during the october 10, 2025 cryptocurrency cascade. Research Square preprint rs-9459584, https://www.researchsquare.com/article/rs-9459584/v1, 2025.
- Brunnermeier and Pedersen (2009) Markus K. Brunnermeier and Lasse Heje Pedersen. Market liquidity and funding liquidity. The Review of Financial Studies, 22(6):2201–2238, 2009. doi: 10.1093/rfs/hhn098.
- Chitra (2025) Tarun Chitra. Autodeleveraging: Impossibilities and optimization, 2025. arXiv:2512.01112.
- Cont and Wagalath (2016) Rama Cont and Lakshithe Wagalath. Fire sales forensics: measuring endogenous risk. Mathematical Finance, 26(4):835–866, 2016. doi: 10.1111/mafi.12071.
- Donier and Bouchaud (2015) Jonathan Donier and Jean-Philippe Bouchaud. Why do markets crash? Bitcoin data offers unprecedented insights. PLoS ONE, 10(10):e0139356, 2015. doi: 10.1371/journal.pone.0139356. arXiv:1503.06704.
- Filimonov and Sornette (2012) Vladimir Filimonov and Didier Sornette. Quantifying reflexivity in financial markets: toward a prediction of flash crashes. Physical Review E, 85(5):056108, 2012. doi: 10.1103/PhysRevE.85.056108.
- García-Medina (2026) Andrés García-Medina. Iterative detection of global factors near the BBP phase transition. 2026. arXiv:2607.06908.
- Garcia Seuma (2026) Ramon Marc Garcia Seuma. Where does the criticality live? early-warning signals are event-heterogeneous across seven crypto-perpetual liquidation cascades, 2026. arXiv:2607.27070 [q-fin.ST].
- Guttal et al. (2016) Vishwesha Guttal, Srinivas Raghavendra, Nikunj Goel, and Quentin Hoarau. Lack of critical slowing down suggests that financial meltdowns are not critical transitions, yet rising variability could signal systemic risk. PLoS ONE, 11(1):e0144198, 2016. doi: 10.1371/journal.pone.0144198.
- Hardiman et al. (2013) Stephen J. Hardiman, Nicolas Bercot, and Jean-Philippe Bouchaud. Critical reflexivity in financial markets: a hawkes process analysis. The European Physical Journal B, 86:442, 2013. doi: 10.1140/epjb/e2013-40107-3.
- Johansen et al. (2000) Anders Johansen, Olivier Ledoit, and Didier Sornette. Crashes as critical points. International Journal of Theoretical and Applied Finance, 3(2):219–255, 2000. doi: 10.1142/S0219024900000115.
- Kirchner (2017) Matthias Kirchner. An estimation procedure for the hawkes process. Quantitative Finance, 17(4):571–595, 2017. doi: 10.1080/14697688.2016.1211312.
- Kyle (1985) Albert S. Kyle. Continuous auctions and insider trading. Econometrica, 53(6):1315–1335, 1985. doi: 10.2307/1913210.
- Laloux et al. (1999) Laurent Laloux, Pierre Cizeau, Jean-Philippe Bouchaud, and Marc Potters. Noise dressing of financial correlation matrices. Physical Review Letters, 83(7):1467–1470, 1999. doi: 10.1103/PhysRevLett.83.1467.
- Marshall (2025) Mike Marshall. How $3.21b vanished in 60 seconds: the october 2025 crypto crash explained through 7 charts. Amberdata research report, https://blog.amberdata.io/how-3.21b-vanished-in-60-seconds-october-2025-crypto-crash-explained-through-7-charts, oct 2025.
- Plerou et al. (2002) Vasiliki Plerou, Parameswaran Gopikrishnan, Bernd Rosenow, Luís A. Nunes Amaral, Thomas Guhr, and H. Eugene Stanley. Random matrix approach to cross correlations in financial data. Physical Review E, 65(6):066126, 2002. doi: 10.1103/PhysRevE.65.066126.
- Scheffer et al. (2009) Marten Scheffer, Jordi Bascompte, William A. Brock, Victor Brovkin, Stephen R. Carpenter, Vasilis Dakos, Hermann Held, Egbert H. van Nes, Max Rietkerk, and George Sugihara. Early-warning signals for critical transitions. Nature, 461(7260):53–59, 2009. doi: 10.1038/nature08227.
- Shukla et al. (2026) Shubhangam Shukla, Mahesh Peyyala, and Abhijit Chakraborty. Time-dependent weighted directed networks of cryptocurrency interaction from high-frequency returns, 2026. arXiv:2606.25466.
- Sornette (2003) Didier Sornette. Why Stock Markets Crash: Critical Events in Complex Financial Systems. Princeton University Press, 2003.
- Thurner et al. (2012) Stefan Thurner, J. Doyne Farmer, and John Geanakoplos. Leverage causes fat tails and clustered volatility. Quantitative Finance, 12(5):695–707, 2012. doi: 10.1080/14697688.2012.674301. arXiv:0908.1555.