

TargetFinder: Detecting Widgets from Pixels
on Desktop Interfaces
Abstract.
"Target-aware" pointing techniques, like Bubble Cursor or Semantic Pointing, outperform traditional pointing by leveraging knowledge of target locations. Yet the lack of application-agnostic widget geometry information limits their adoption across the desktop. We present TargetFinder, a computer vision-based system for real-time detection of GUI widgets. TargetFinder leverages several fine-tuned YOLO networks trained on a new dataset of 520 annotated desktop screenshots (38,000 annotations) spanning Windows, macOS, Ubuntu, and web interfaces. TargetFinder uses lightweight screen monitoring and low-latency detection, achieving millisecond responsiveness suitable for interactive use. Evaluations show that TargetFinder outperforms the baseline methods (OmniParser and REMAUI), while system-wide implementations of Bubble Cursor and Semantic Pointing demonstrate the feasibility of deploying universal target-aware techniques that work across applications. We release the dataset, models, annotation tool, and an open-source library for research and applications.
1. Introduction
Widgets, such as buttons, menus, sliders, or text fields, are interactive elements that compose Graphical User Interfaces (GUI). Their nature, position, and dimensional properties often remain encapsulated within application logic, and mostly inaccessible to other applications. This limitation restricts the development of advanced interaction techniques across multiple domains (Jansen et al., 2011). A prominent example is target-aware selection facilitation, i.e. techniques requiring knowledge of all target positions and dimensions on a display, of which many have been proposed in the HCI literature. This includes area cursors (Grossman and Balakrishnan, 2005; Findlater et al., 2010; Kabbash and Buxton, 1995; Worden et al., 1997; Chapuis et al., 2009; Su et al., 2014; Hertzum and Hornbæk, 2007), cursors that dynamically manipulate the control-display ratio (Blanch et al., 2004; Guiard et al., 2004), expanding/movable targets (Zhai et al., 2003; McGuffin and Balakrishnan, 2002; Baudisch et al., 2003), and techniques based on predicting user intent (Asano et al., 2005; Liu et al., 2017; Ziebart et al., 2012). These techniques have been demonstrated only in application-specific prototypes where researchers maintain direct control over the interface, or within web browsers whose layout engine APIs readily expose target geometry (Gajos et al., 2012). The lack of accessible widget geometry prevents system-wide implementation of target-aware pointing techniques, limiting users to “regular” target-agnostic interactions (Casiez and Roussel, 2011), despite research consistently demonstrating the superior performance of target-aware techniques (Grossman and Balakrishnan, 2005; Blanch et al., 2004; Guiard et al., 2004). To our knowledge, the latter have seldom been evaluated in the wild, with the exception of a Bubble Cursor web-browser implementation cited in (Jansen et al., 2011, ref. 8) but no longer accessible. Target-agnostic methods may also benefit from widget information; for example, the transfer function tuning in AutoGain (Lee et al., 2020) could be made more precise with target size data. Accessibility APIs should be the tool of choice for system-wide target-aware techniques, as they theoretically provide the necessary widget information, but are both OS and application-dependent111each OS offers distinct formats and capabilities, the granularity of exposed information is application-dependent making generic inspections unreliable, and DPI scaling inconsistencies can cause mismatches between reported and actual widget locations. Most critically, many third-party applications fail to implement accessibility support (Patel et al., 2020; Bi et al., 2022; MSA, 2020; MSU, 2021), making reliable widget layout information difficult to obtain. For example, sometimes a widget’s higher-level container or the window itself is returned (Malacria et al., 2013).
We present TargetFinder, a cross-platform library built around a computer vision-based tool for identifying interface widgets via real-time analysis of desktop environments. We fine-tune object detectors from the YOLO family (Redmon et al., 2016) on a novel dataset of annotated desktop interface screenshots spanning multiple OS’s and application types.
TargetFinder continuously monitors the screen. Significant changes are detected using fast comparison of low-resolution screenshots, upon which a full-resolution screenshot is processed by the YOLO model, which returns within milliseconds the bounding box coordinates of all visible interface widgets, along with their types: buttons, text fields, sliders etc. The reasonably short processing latency (less than 210 ms on a consumer-grade laptop; see §7) makes the system responsive enough for most interactive applications without introducing perceptible delays in user workflows, and realistically enables real-time use.
A fundamental advantage of our pure computer vision-based approach is its independence from application internals, accessibility APIs, or platform-specific frameworks. Thanks to the diversity of the training set, TargetFinder works across operating systems (Windows, macOS, Ubuntu), application frameworks (native, web, third-party), and even legacy software. The contributions of this article are as follows:
- New annotated widget dataset::
-
We present a new dataset of 520 annotated screenshots covering Windows, macOS, Ubuntu, as well as web interfaces (130 images per category, each image containing multiple widgets). The entire dataset consists of about 38,000 annotations. We additionally provide a test set of 71 annotated screenshots, with 4,206 annotations, from older software covering diverse visual themes (light, dark, etc.) and varying image resolutions.
- Trained YOLO networks and evaluation::
-
We trained several YOLO models on our dataset and evaluated the performance of each of them to optimize TargetFinder. We then present a comprehensive comparison of multiple widget detection methods. TargetFinder outperforms the existing baselines (OmniParser and REMAUI) evaluated in our study. We also analyze generalization, including cross-OS transfer, desktop/mobile adaptability, and transfer to legacy software.
- Library::
-
We provide a library that includes a Python module (TargetFinder) for real-time widget detection, enabling easy integration into external applications or interaction techniques. The library is cross-platform and hosted on PyPI, provides a command-line interface to visualize detections in real time through an overlay, and includes the two interaction techniques, Bubble Cursor and Semantic Pointing, tested on several versions of Windows and Ubuntu with X11.
- System-wide proof-of-concept::
All the above contributions are released as open resources, including the public datasets222https://osf.io/fr6y4/overview and the library333https://github.com/AHMEDBENAKOUCHE/target˙finder˙toolkit.git. This work highlights the potential of computer vision to overcome traditional barriers to accessing GUI widgets programmatically, and opens new perspectives for developing interaction techniques that do not require accessing or modifying application source code.
2. Related Work
2.1. Goals of GUI widget detection
Most research on GUI widget detection has focused on mobile contexts. The primary goal has been interface reconstruction i.e. the automatic generation of functional code from screenshots or prototypes. For instance, REMAUI leverages widget detection to reverse engineer mobile user interfaces, converting images into working UI code (Nguyen and Csallner, 2015). \NoHyperBaulé et al.\endNoHyper review a variety of systems developed for automatic GUI code generation from images (Baulé et al., 2020), including work such as Pix2Code (Beltramelli, 2018). GUI widget detection is also used in other downstream tasks; for example, predicting the tappability of widgets (Swearngin and Li, 2019), or content description generation (Bai et al., 2021).
In the desktop context, the main goal is to gather widget information for artificial agents that interact directly with GUIs e.g. OS-ATLAS (Wu et al., 2025), WinClick (Hui et al., 2025), see also (Matti et al., 2023; Martínez-Rojas et al., 2024b). These approaches do not aim for exhaustive detection of GUI widgets. Instead, they target instruction-driven interaction tasks where the agent must locate one or several specific widgets relevant to the requested action. An exception is OmniParser (Lu et al., 2024), which performs exhaustive widget detection and associates user actions to them.
2.2. Identifying widgets from pixels via computer vision
Identifying GUI widgets from images has been addressed through classical image processing and deep learning approaches. Classical image processing approaches rely on low-level operations like edge detection, dilation, and component segmentation. They are computationally efficient and unsupervised, i.e. they do not require annotated training data, but often involve manual tuning of hyperparameters, and can lack robustness. These techniques tend to over-segment small or decorative non-interactive elements, such as tiny icons or text, which can clutter the results and reduce practical usefulness. An example is REMAUI (Nguyen and Csallner, 2015), which detects non-textual elements using the Canny edge detection (Canny, 1986), followed by dilation to merge close components and close gaps in contours.
Object detection models based on supervised neural networks, such as YOLO (Altinbas and Serif, 2022), Faster R-CNN (Chen et al., 2020), and SSD (Zhang et al., 2021), offer greater flexibility and accuracy. Their main strength is their ability to detect widgets without having to rely on rules or intuitions specified by researchers. Many of these models are pre-trained on large datasets, so only fine-tuning on GUI-specific data is needed. The main limit of these supervised methods is that they require labeled data i.e. datasets of images where all GUI widgets are identified. Building or acquiring such datasets is costly, since a single desktop GUI image may contain more than 200 widgets. While several neural network-based object detection for exhaustive widget identification exist for mobile interface recognition (Xie et al., 2020a; Altinbas and Serif, 2022; Chen et al., 2020), these trained models fail to generalize to desktop interfaces444We tested the model from \NoHyperChen et al.\endNoHyper (Chen et al., 2020), trained on 40k images of the RICO dataset, with poor results; examples are provided in the supplementary materials.. In the desktop domain, OmniParser (Lu et al., 2024) uses a YOLOv8 model trained on automatically labeled web screenshots (derived from the DOM), combined with optical character recognition (OCR) and icon features extracted with BLIP-v2 to support a vision-enabled language model (GPT-4V). Another notable work is that of \NoHyperMartínez-Rojas et al.\endNoHyper (Martínez-Rojas et al., 2024b), which employs a multi-model detection pipeline consisting of five separately trained YOLOv8 networks, each specialized in detecting widgets at a different hierarchical level. We include both systems as baselines in §4.3. Hybrid approaches, that combine classical computer vision techniques with deep learning, like UIED (Xie et al., 2020a), also exist.
Segmentation models such as SAM (Ravi et al., 2025) and MobileSAM (Zhang et al., 2023) are an alternative solution. These models generate precise masks for visible objects, which can help refine the boundaries of GUI widgets. However, limitations are that they segment everything visible in the image, including non-interactive regions and are computationally demanding. A final work that should be mentioned, and that predates modern computer vision, is Prefab (Dixon and Fogarty, 2010), which attempts to recover widget structure directly from pixels from manually constructed visual prototypes. Prefab was namely used for a Windows 7 implementation of a Bubble Cursor (Dixon et al., 2012).
2.3. Alternate methods to detect widgets
Other than image processing, we found three other methods in the literature to detect widget information. In all three cases, the author’s goal was to perform a field study of Fitts’ law, which requires information about the target sizes and locations.
Several works have exploited the Accessibility/Automation API555On Windows, Microsoft Active Accessibility (MSAA) has been originally introduced to expose information about UI elements (MSA, 2020). From 2005, it has been progressively replaced by UI Automation (UIA) but both remain available today (MSU, 2021). They are both natively supported by languages such as C++ and C# but other languages, such as Java and Node.js, provide limited or complex support. Frameworks, like Qt, do not natively support UIA. In all cases, accessibility is not enabled by default and the developer needs to write more or less code to support accessibility in an application. . Chapuis and colleagues (Chapuis et al., 2007; Chapuis, 2005) tried to access target size and location via the accessibility API on Mac OS X, and Linux with GTK, but reported having to use undocumented functionalities to access additional information such as stacking order, and report being able to extract about 22% of possible target bounds. \NoHyperHurst et al.\endNoHyper report that the Windows accessibility API alone enabled them to find 74% of on-screen targets (Hurst et al., 2010), while \NoHyperEvans and Wobbrock\endNoHyper achieved 67% precision in their work with the Windows automation API (Evans and Wobbrock, 2012). In all these cases, the accessibility API was always leveraged to determine the selected widget, and not all widgets on screen.
\NoHyperEvans and Wobbrock\endNoHyper used the automation API to prelabel selected widgets before submitting them to Amazon mechanical Turk for final annotation (Evans and Wobbrock, 2012). To improve reliability, each image was labeled by three independent workers, though the agreement rate was according to the authors unexpectedly low, at around 40%.
Application-specific implementations: \NoHyperGajos et al.\endNoHyper developed a Firefox extension that leveraged the web browser’s layout engine to access webpage geometry, including most clickable elements (Gajos et al., 2012). While they did not report the accuracy of their method, it is likely to be high666We developed a similar browser extension and obtained encouraging results, though we do not report on it here, as it does not offer a system-wide solution.. Before that, \NoHyperHurst et al.\endNoHyper had developed a similar system for the open-source image editing software GIMP (Hurst et al., 2007).
2.4. Existing GUI datasets with labeled elements
The majority of existing GUI datasets focus on mobile user interfaces, see for example RICO (Deka et al., 2017) and VINS (Bunian et al., 2021). Fully annotated public desktop GUI datasets are scarce. To date, only a few efforts have attempted to provide comprehensive annotations:
-
•
The Waltteri Github repository (wal, 2020) includes 51 fully annotated desktop screenshots. While annotation documentation is limited, the labels appear to be precise and complete.
-
•
The dataset proposed by \NoHyperMartínez-Rojas et al.\endNoHyper (Martínez-Rojas et al., 2024b) contains 100 manually annotated desktop UI images.
-
•
DAWOD (Zhu et al., 2023) is a dataset of synthetic GUI images, but is not publicly available.
-
•
OmniParser (Lu et al., 2024) relies on a large collection of automatically labeled web screenshots (67k, derived from the DOM). However, the dataset is not publicly available, covers only web interfaces, and does not contain screenshots of native desktop GUIs.
Other datasets, such as OmniACT (Kapoor et al., 2025) and OS-ATLAS (Wu et al., 2025), provide partially annotated desktop and web interface images, primarily aimed at training autonomous agents, but are not designed for comprehensive GUI element detection. OS-ATLAS leverages accessibility APIs for desktop and mobile platforms, and HTML parsing for web interfaces, but images are intentionally partially labeled to preserve diversity. For OmniACT, desktop annotations are manually created by human annotators using a dedicated PyQt interface without aiming for full coverage. The UI-Vision benchmark (Nayak et al., 2025) was designed for GUI perception and interaction in desktop environments. The associated paper claims high-quality annotations including bounding boxes, UI element labels, and actions such as clicks and drags, but the publicly available data includes only a few annotations per image, which are cropped to application windows.
3. Dataset acquisition
3.1. Tool
We developed an annotation tool called WidgetAnnotator 777https://github.com/AHMEDBENAKOUCHE/ui-widget-annotator-a-tool-for-fast-and-efficient-gui-annotation.git for semi-automatic annotations of GUI images. The user can use several prelabeling methods888These include REMAUI and UIED, MobileSAM, and now, our trained YOLO model. and interactively adjust, correct, or complete the annotations directly on the image using direct manipulation (see Fig. 7). In addition, WidgetAnnotator supports multi-class pre-classification through a predefined list of widget categories (buttons, sliders, text fields, etc.), using three existing convolutional neural networks (CNNs) trained on mobile data from (Sahu, 2020). We estimate that the tool reduced annotation time by a factor two.
3.2. Procedure
We sourced partially annotated desktop images from OS-ATLAS (Wu et al., 2025) and OmniACT (Kapoor et al., 2025). We used OS-ATLAS for images of native desktop GUIs, which contains data from Windows, macOS, and Ubuntu operating systems for various versions of the platforms. All images were annotated from scratch using WidgetAnnotator. The web category was populated with images from OmniACT. The partial web annotations were generally accurate and visually aligned, so we retained the existing bounding boxes and completed the labeling.
The annotation process involved the initial pre-labeling phase provided by WidgetAnnotator. We then manually corrected the labeling to ensure bounding boxes precisely enclosed each widget according to rules further detailed in the supplementary materials; notably: when the widget edge was visually identifiable, the bounding box was drawn one pixel away999Note that differences in annotation padding across datasets mainly affect IoU-based metrics, and barely affect classification metrics such as precision, recall or F1-score.; when the boundary was ambiguous, the annotator verified the target’s extent directly on a real system (e.g. by hovering to reveal the interactive region) when possible. Finally, we assigned class labels according to a fixed taxonomy of six GUI widget types (ToggleButton, TextInput, Slider, Text, HyperLink, Button), further detailed in §9.2. Since classification of target type is not critical to our envisioned applications, we do not report extensively on this part, but discuss this further in §7.
To evaluate how closely other annotators can reproduce the annotations contained in our dataset while following the same annotation protocol, we randomly sampled 15 images and asked three independent annotators to re-label them using the same guidelines. We then measured their agreement with the primary annotator as ground truth (see §9.4), and found high agreement (mean F1 score of 0.933, mean mIoU of 0.892), indicating that both the task and protocol are well-defined, and that the present annotations are reliable.

3.3. Dataset presentation
Our final dataset comprises 520 fully labeled images, evenly distributed across the four platforms: Windows (primarily Windows 10 with some Windows 11), Linux (Ubuntu with GNOME environment), macOS and Web (130 images each). It includes typical native OS interfaces such as desktop views, system settings, file browsers, calculators, and system tools. It also covers productivity suites like LibreOffice, Microsoft Word, Excel, PowerPoint, and Draw, as well as developer environments like PyCharm and Visual Studio Code. For the web category, the screenshots come from different websites such as Amazon, Coursera, Booking, Indeed, and Wikipedia. A random selection of labeled screenshots is displayed Fig. 1. The images are predominantly high-resolution; the dominant resolutions for each platform are 25601440 for Windows and Linux, 28801800 for macOS, and 1440900 for web interfaces.
Each image is associated with a YOLO-format annotation file. In total, we annotated 37,919 GUI widgets across six classes. On average, each image contains approximately 73 widgets, with a minimum of 8 and a maximum of 252 per image. As shown in Fig. 2, the dataset exhibits a strong class imbalance, with Button elements being the most frequent, particularly on Linux and macOS, while categories such as TextInput and Slider appear less often; web interfaces contain comparatively more Text and Hyperlink annotations. Since we expect that smaller widgets are more difficult to identify, we also report the distribution of widget sizes in our dataset in §5.1, expressed in YOLO-pixels101010We call YOLO-pixels the geometric dimensions of each widget’s bounding box after the screenshot has been rescaled to YOLO’s default input size (640×X). Thus, it is the size that is meaningul in the widget detection context.. It reveals an asymetric, positive skewed distribution similar to an EMG distribution (Gori and Rioul, 2019), with a median widget size of about 9 YOLO-pixels. The dataset111111https://osf.io/fr6y4/overview will be made open-access and publicly hosted after the review period.

4. YOLO training and technical evaluation
We trained our detection models using the Ultralytics API. The results reported in this section correspond to our main configuration, namely YOLO26n with the default 640640 input resolution and aspect-ratio-preserving letterboxing. This ensures that screenshots are rescaled without distortion. For comparison with prior work relying on YOLOv8-based detectors, we also report results obtained with a YOLOv8n-640121212The YOLO taxonomy used in this paper is as follows: YOLOXy-z, where is the model version (e.g. v8, 11, 26 etc.), y is the model size (e.g. n (nano), s (small), m (medium) etc.), and z is the input resolution (640, 1280, 1920). model. The effect of varying input resolution and YOLO model size, particularly for the detection of small UI elements and inference speed, is examined separately in §5.3.
4.1. Dataset preparation and evaluation metrics
4.1.1. Train/test/validation split
We split the 520 annotated images into three sets: Train0 (80%, 416 images) used for hyperparameter tuning, Val0 (10%, 52 images) reserved for validation during training, and Test (10%, 52 images) held out for final evaluation. All splits are stratified to preserve the distribution of GUI classes and platform categories (Windows, macOS, Ubuntu, Web) across subsets.
4.1.2. Evaluation metrics
We used standard object detection evaluation metrics (more details are provided in §9.3)
-
•
IoU: Intersection over Union is used to evaluate a single object detection, and quantifies how much the detected bounding box overlaps with the true bounding box. An IoU of 0.5 means that the overlapping area is 50% of the union of both boxes.
-
•
F1-score combines precision (the proportion of predicted boxes that are correct) and recall (the proportion of ground truth boxes that are detected), balancing false positives and false negatives.
-
•
mAP@0.5: The mean Average Precision at IoU 0.5 measures the model’s overall ability to correctly detect objects. It is calculated as the area under the precision-recall curve, counting a prediction as correct when the bounding box has an IoU of at least 0.5 with the ground truth.
-
•
mAP@0.5:0.95: The mean Average Precision averaged over IoU thresholds from 0.5 to 0.95 is the same except the metric is computed for increasing IoU, in steps of .05 from .5 to .95, and the average over all these mAP is then taken. This evaluates not only the model’s ability to find the objects, but also how accurately it places the bounding boxes.
-
•
mIoU is the mean Intersection over Union computed over all correctly matched detections (true positives).
These metrics are all between 0 and 1, with 1 indicating the best performance. Throughout the paper, we follow the standard YOLO convention that a detection is counted as correct when IoU 0.5.
4.2. Vanilla training (baseline model)
To estimate the appropriate number of training epochs, we first conducted a baseline training run on the Train0/Val0 split without any hyperparameter tuning. We found performance did not show meaningful gains beyond epochs, which served as a reference for subsequent training. The loss and evaluation metrics over the course of training can be found in the supplementary materials. For hyperparameter tuning, we used YOLO’s built-in genetic algorithm-based optimizer, running 100 iterations over 150 epochs (E/3).131313We chose 150 epochs as a practical compromise: running each candidate for the full epochs would be time-consuming, since the goal of tuning is to compare many configurations efficiently rather than fully train each one. Shorter runs (e.g. 10–50 epochs) would not be sufficient because the model remains too unstable in the early training stages. Using around 150 epochs allows the model to stabilize enough to reveal meaningful differences between hyperparameter sets. For example, with these settings (150 epochs and 100 iterations) on an NVIDIA RTX A6000 GPU, 8-core CPU, and 16 GB RAM of our institution’s computing cluster, the process still took approximately 21 hours. Extending the tuning phase over several days (with more iterations) could yield further improvements.. This automated search explored both augmentation parameters (e.g. mosaic, rotation etc.) and internal YOLO configuration settings, including the classification loss weight, which influences the relative importance of class prediction within the total loss function, which is a key factor in handling class imbalance.
To ensure that the selected hyperparameters did not overfit the initial split, we performed a 5-fold cross-validation with epochs. In each fold, 80 % of the images were used for training and the remaining 20 % for validation, producing five distinct rotations of the 468 images. The results were consistent across folds, with low standard deviations (see supplementary materials).
4.3. Final model evaluation and comparison to competing methods
The final model was trained on the full 468-image training set (Train = Train0 + Val0) with the tuned hyperparameters. Its performance was then evaluated on the held-out 52-image Test set for multi-class (i.e. bounding boxes with widget classification) and mono-class (bounding boxes only), and compared to the state of the art in widget detection: REMAUI (Nguyen and Csallner, 2015) (the prototype141414http://cseweb.uta.edu/~tuan/REMAUI/ was originally made available by the authors, but is no longer publicly accessible; we therefore provide our own implementation) , UIED (Xie et al., 2020a, b), MobileSAM (Zhang et al., 2023) (no public implementation available; we provide our own implementation based on the released model under Ultralytics), \NoHyperMartínez-Rojas et al.\endNoHyper’s instantiation of YOLOv8n-640 (Martínez-Rojas et al., 2024b, a), and OmniParser’s YOLO-based detector (Lu et al., 2024).
OmniParser uses YOLOv8n-640 in the original version presented in their paper, and a larger YOLO11m-1280 model in the more recent release, together with an OCR stage combined with the YOLO detections. Since the OCR stage substantially increases the number of false positives, we report here only the best-performing configuration for object detection, namely the YOLO11m-1280 detector alone (without OCR). A detailed analysis of all OmniParser variants is provided in the supplementary materials.
The results are reported Table 1. Given that the compared methods output a varying number of classes, and some don’t return classes at all, comparisons are made based on mono-class performance.
| Method | Precision | Recall | F1 | mAP@ 0.5 | mAP@ 0.5:0.95 | mIoU |
| TargetFinder | ||||||
| YOLO26n-640 (MC) | 0.769 | 0.695 | 0.723 | 0.738 | 0.510 | 0.866 |
| YOLO26n-640 | 0.936 | 0.840 | 0.885 | 0.899 | 0.697 | 0.872 |
| YOLOv8n-640 | 0.898 | 0.806 | 0.850 | 0.877 | 0.699 | 0.880 |
| Baselines | ||||||
| OmniParser (YOLO11m-1280) | 0.753 | 0.651 | 0.698 | 0.693 | 0.391 | 0.787 |
| REMAUI | 0.430 | 0.484 | 0.455 | N/A | N/A | 0.749 |
| UIED | 0.397 | 0.476 | 0.433 | N/A | N/A | 0.753 |
| MobileSAM | 0.348 | 0.167 | 0.226 | 0.063 | 0.030 | 0.767 |
| Martinez-Rojas (YOLOv8n-640) | 0.276 | 0.181 | 0.218 | 0.093 | 0.029 | 0.684 |
Mono-class vs. multi-class: our model achieves higher scores in mono-class mode (where a true positive is counted if the detection is spatially correct, regardless of the class) compared to multi-class mode (where the predicted class must also be correct), highlighting the impact of class imbalance.
Comparison to other methods: We found that TargetFinder outperformed all baselines, even those using larger YOLO models.
OmniParser is the strongest baseline; it is also the most recent work and its widget detection component was trained on a very large dataset compared to our model. In its best-performing configuration for object detection (YOLO11m-1280 without OCR), it reaches an F1 score of 0.698, compared to 0.885 for TargetFinder with YOLO26n-640 in mono-class mode and 0.850 with YOLOv8n-640. A detailed analysis of all its variants (YOLOv8n-640, YOLO11m-1280, with and without OCR, and OCR+fusion) is provided in the supplementary materials.
Although OmniParser relies on a larger YOLO variant and uses a higher input resolution (12801280) than TargetFinder, making it about 7.5–9 slower in our measurements, its performance remains below that of TargetFinder, even for very small targets (see Table 5 in Appendix §9.6).
Omniparser’s underwhelming performance can be explained: the system is trained exclusively on 67k web screenshots annotated automatically from DOM metadata, with no evidence of human verification. Such automatically-generated labels inevitably contain errors (the OmniParser dataset is not public, but the examples shown in (Lu et al., 2024) already reveal labeling errors), and a model trained solely on web UIs does not transfer well to our test set, which includes native desktop environments (Ubuntu, macOS, Windows). This domain mismatch largely explains the lower performance. This observation aligns with the understanding that model performance depends not only on dataset size, but also on the diversity and quality of the data and training, and highlights that large datasets are not always required to obtain good performance.
Fig. 3 illustrates the performances of our trained YOLO model compared with OmniParser’s YOLO and the ground truth, on an example screenshot from each OS. Comparison with other methods is provided in Fig. 14. Our method is visually close to the ground truth, with some errors remaining perceptible (e.g., the bounding boxes not well aligned on the browser suggestions/shortcuts, 1st column) and appears superior to other methods, in line with the technical evaluation. OmniParser also performs better than the other methods, but still falls short of TargetFinder. On native desktop applications it misses numerous widgets (2nd column) and occasionally produces false positives (3rd column). Its relatively good performance on the browser example (1st column) is expected, since this interface resembles the web domain on which OmniParser was exclusively trained. More detailed evaluations and analyses of all OmniParser variants including on web-screenshots only can be found in the Supplementary materials, which also include other labeled screenshot examples.
Ubuntu/Browser example
macOs Example
Windows 10 Example
Ground truth


 Our YOLO26


 OmniParser YOLO


 Visual comparison of widget detection outputs from other methods and our trained YOLO26 model for three example screenshots: a Firefox browser window in Ubuntu (left), a macOs desktop with white background (middle) and a Windows desktop with blue background and a screensaver that can lead to false detections (right). The first row shows the ground truth annotations, followed by rows showing the outputs from our YOLO26 model, OmniParser YOLO, REMAUI, UIED, MobileSAM, and Martinez-Rojas YOLO respectively. Each method’s output is displayed in a separate row for each of the three examples.
4.4. Generalization to out-of-distribution data
Given that our annotated dataset exclusively consists of modern desktop GUI screenshots of three specific OS’s, evaluating the final model solely on the corresponding test subset might lead to overly optimistic results. We thus evaluated the performance of TargetFinder through three experiments: (i) an evaluation on legacy desktop interfaces, which exhibit diverse visual themes and varying image resolutions, (ii) an evaluation on mobile interfaces, and (iii) an evaluation of cross-operating system transfer capabilities, in which models trained on one OS were tested on the two others.
Legacy Software with Different Themes and Resolutions
We built a test set of 71 manually annotated screenshots from older software covering diverse themes (light, dark) and varying image resolutions, using WidgetAnnotator. The final YOLO26n-640 model, trained on the modern dataset, was evaluated on this legacy set. The results are summarized in Table 2 under the Legacy column.
| Metric | Test-set | Legacy | Mobile (VINS) |
| Precision | 0.936 | 0.724 | 0.295 |
| Recall | 0.840 | 0.669 | 0.347 |
| F1 | 0.885 | 0.695 | 0.319 |
| mAP@0.5 | 0.899 | 0.717 | 0.201 |
| mAP@0.5:0.95 | 0.697 | 0.445 | 0.089 |
| mIoU | 0.872 | 0.804 | 0.714 |
The model maintains reasonable performance across precision, recall, and F1, with relative drops of about 21%. The sharpest decline is observed for mAP@0.5:0.95, with a relative drop of about 36%, suggesting that performance deteriorates under stricter localization criteria while also reflecting a decrease in overall detection performance, as indicated by the drop in F1. However, the small drop in mIoU (only about 7%) suggests that, when detections are successfully matched, their spatial overlap with ground-truth objects remains relatively robust.
Mobile Interfaces
Mobile UIs typically have layouts and design principles that differ significantly from desktop GUIs, so good transfer is a priori not expected. Still, given that desktop interfaces are generally more complex than mobile ones, it is plausible that transfer is possible, but only in the desktop-to-mobile direction. We thus evaluated the model on 100 mobile screenshots (Android and iPhone) sampled from the VINS dataset, reported under Mobile (VINS) in Table 2. The drop in performance confirms that desktop-trained models do not generalize well to mobile UIs. Training on mobile data is thus essential to ensure reliable performance in mobile contexts.
Cross-OS Transfer
A practical question of interest is whether the detection results transfer across modern interface themes; indeed, modern interfaces tend to share many similarities since they are often based on the same heuristics of design151515See e.g. Jakob Nielsen’s 10 heuristics of design: https://www.nngroup.com/articles/ten-usability-heuristics/.. To investigate this, we trained YOLO26n-640 models individually on the Windows-, Ubuntu-, and macOS-only images of our dataset, and evaluated their performance across the other OSs. Each OS-specific dataset comprises 130 images, divided into 80% training, 10% validation, and 10% test subsets. All training used the default YOLO hyperparameters pre-configured for the COCO dataset (Lin et al., 2014), with a maximum of 500 epochs, providing a consistent baseline for comparison.
| Training | Testing | Precision | Recall | F1-score |
mAP@
0.5 |
mAP@
0.5:0.95 |
mIoU |
| Windows | Windows | 0.807 | 0.643 | 0.716 | 0.725 | 0.473 | 0.827 |
| Windows | Ubuntu | 0.666 | 0.576 | 0.618 | 0.634 | 0.324 | 0.751 |
| Windows | macOS | 0.801 | 0.710 | 0.753 | 0.779 | 0.350 | 0.736 |
| Ubuntu | Ubuntu | 0.868 | 0.791 | 0.828 | 0.852 | 0.561 | 0.819 |
| Ubuntu | Windows | 0.472 | 0.362 | 0.410 | 0.339 | 0.130 | 0.722 |
| Ubuntu | macOS | 0.645 | 0.670 | 0.657 | 0.644 | 0.303 | 0.751 |
| macOS | macOS | 0.955 | 0.931 | 0.943 | 0.973 | 0.802 | 0.901 |
| macOS | Ubuntu | 0.561 | 0.555 | 0.558 | 0.525 | 0.199 | 0.696 |
| macOS | Windows | 0.571 | 0.380 | 0.457 | 0.387 | 0.131 | 0.689 |
The results, summarized in Table 3, show that cross-OS transfer clearly exhibits performance declines, particularly when transferring models from macOS or Linux to Windows. Overall, performance is highest for the MacOS(train)/MacOS(test) pair, suggesting that the MacOS interface exhibits less diversity across our dataset. Finally, in many cases, F1 scores and mIoU remain decent; this suggests that, while models trained on a single OS can partially generalize to other platforms for some practical applications, fine-tuning or additional retraining with target-specific data will enhance results significantly.
5. Identifying Small widgets
Small widgets are common in GUI’s, including in our dataset (see Fig. 4). They are usually hard to detect, and small object detection remains an active research topic (Wang et al., 2021). In this section, we first characterize the prevalence of small widgets in our dataset, and then apply and evaluate several methods to enhance their detection.
5.1. Distribution of widget sizes in our dataset and performance on small elements
To characterize the presence of small UI elements in our dataset, we computed the distribution of widget sizes after letterboxing as the minimum between widget width and height, expressed in “YOLO-pixels”161616After resizing each screenshot to 640X while preserving aspect ratio, letterboxing adds padding to obtain the final 640640 input resolution. “YOLO-pixels” do not correspond to physical image pixels, but represent the bounding box’s dimension after resizing. This implies that YOLO-pixels are floats., see Fig. 4.

The performance of TargetFinder was evaluated separately for widgets whose YOLO-pixel size falls below the 50th, 30th, and 10th percentiles (see Table 7 in Appendix 9.6), and found that, in line with the literature, smaller widgets were increasingly difficult to detect, as reflected by the higher false-negative rates (lower recall). The best baseline, OmniParser, suffers from a similar decrease of recall (see Table 5 in Appendix §9.6). REMAUI also exhibits a clear drop in performance across percentiles (see Table 6 in Appendix 9.6), although in this case the degradation appears to affect precision more strongly than recall.
5.2. Enhancing performance for small widgets
We evaluated several methods for improving performance for small widgets. The performances of all relevant YOLO variations, evaluated on the percentile and on mAP@0.5:0.95, are provided in Fig. 5.
-
(1)
Specific small-widget training brings marginal to no improvements. We experimented with several fine tunings of hyperparameters and YOLO augmentations, as well as training with a curated dataset of images containing many small widgets, but found almost no gain in performance, as reported in the Supplementary materials. The problem is that small targets become almost invisible, deep in the CNN-backbone of the YOLO network. For example, a widget of size 5.5 YOLO-pixels becomes sub-pixel in deeper feature maps (0.34 pixels at stride 16).
-
(2)
Specific YOLO architecture. The YOLO family offers various model sizes, denoted n (nano), s (small), m (medium), l (large), and x (extra-large). We fine-tuned models of different sizes and found sizeable gains in detection performance, but at the cost of inference time. Other changes to the YOLO architecture have been reported in the literature. For example, YOLO uses information from multiple convolutional layers for detection (feature pyramids (Lin et al., 2017)). YOLO does not use the P2 layer, which is the layer with the highest resolution i.e. the one most suited to capture information related to small widgets. We experimented with an undocumented YOLO architecture that exploits the P2 layer, but found at best marginal improvements, reported in the supplementary materials.171717The untrained model can be found at https://github.com/ultralytics/ultralytics/blob/main/ultralytics/cfg/models/26/yolo26-p2.yaml. Previous work shows that adding P2 can bring small improvements to detection, e.g. an increase of .04 points in MAP@0.5:0.95 in (Qiu et al., 2025, Table 3), but requires training YOLO from scratch. An alternative, which we considered instead, is to transfer the weights from a previously pre-trained YOLO without P2 and learn the remaining weights by fine-tuning. Other works also suggest changing the loss function during training, moving away from IoU since it becomes very sensitive for small targets, but reported improvements appear even smaller (Qiu et al., 2025, Table 4).
-
(3)
Increasing the input resolution is a simple yet very effective method to increase performance on small widgets: doubling the resolution doubles the size of the objects represented inside the CNN-backbone. We provide YOLO models trained and evaluated at different input resolutions, including 640640, 12801280, 19201920.
-
(4)
In Slicing Aided Hyper Inference (SAHI) the image is cut into overlapping patches. Each patch is fed to a YOLO network, after which the detection results are fused. The advantage is that downscaling the initial image is not necessary anymore, and the extra time needed to run the extra forward inference passes on YOLO can, in theory, be negated by running these in parallel. We indeed found a gain in performance, but at a higher temporal cost than expected. We gained further performance by training the networks on patches rather than on full images.
5.3. Performance tradeoffs
Our evaluations of the different YOLO models reveal that 1) larger models (parameters and input resolution) deliver higher accuracy at the expense of slower inference speeds 2) SAHI provides some gains in performance but for a large increase in inference time 3) A variety of other methods can bring marginal gains in performance. From a practical perspective, the choice of a particular version of the model should be made based on the inference speed requirements. For the use cases presented next, a 200 ms inference time is acceptable, which, with the hardware used to create the Fig. 5 benchmark, suggests using the model. The supplementary materials reports benchmarks for different hardware setups, including high- to low-end CPUs, and a consumer-grade GPU.

6. TargetFinder
6.1. System description and technical evaluation
TargetFinder continuously captures full-screen screenshots at 30Hz181818This parameter can be increased on powerful machines. with a cross-platform screenshot library optimized for speed called mss191919https://pypi.org/project/mss/. To avoid redundant YOLO inferences when the UI remains static and save computational resources, TargetFinder integrates a change detection mechanism. After each screen capture, a downscaled grayscale version of the current frame is compared to the previous one. If the pixel difference exceeds a configurable threshold, a new inference is triggered using our trained model; otherwise, the inference step is skipped.
YOLO inference is configurable through confidence and IoU thresholds. The default confidence threshold is chosen to maximize the F1-score, but can be adjusted to favor precision (fewer false positives but more missed detections) or recall (fewer missed detections but more false positives). The IoU threshold is also adjustable: lower values eliminate overlapping boxes more to reduce duplicates via non-maximum suppression.
The detection runs in a separate thread, ensuring that bounding boxes are updated in real time. Each detection is primarily represented by a dictionary {id, x, y, width, height, score, class_id, class_name}202020x and y are the top-left coordinates of the bounding box; w and h its width and height; score the confidence in ; and class_id the class label., ready to be exploited by downstream modules. Optionally, the library can also provide the cropped image of each detected widget, which can be useful for further processing such as OCR or custom classification. In practice, the speed of TargetFinder depends mainly on the YOLO inference latency and on the cost of the change detection operation. On a Macbook Pro 2023, with a M3 Max chipset (14 cores), 36 GB RAM, the system reaches 10–24 FPS for real-time detection, depending on whether the interface is static or dynamically changing, with CPU usage ranging from 4% (static UI) to 7% (dynamic inference) and RAM usage 390–470 MB.

by TargetFinder.

during real-time use.

feedback about the motor space displayed.
6.2. Toolkit
The TargetFinder library, provided as supplementary material, manages screen capture, low-resolution change detection, and YOLO inference. The library can be imported into any Python application to retrieve real-time bounding boxes of visible interface widgets. It exposes configurable parameters such as loop frequency, change-detection threshold, YOLO confidence, and IoU threshold for non-max suppression. Upon detection of a change, the library provides a callback mechanism to notify the application, providing information about the detected changes (id, position, dimensions, class, confidence score and screen capture of each widget). We also provide all fine-tuned YOLO models considered in this work, allowing end-users to navigate the mAP@0.5:0.95/inference time tradeoff. The detection pipeline is designed to be platform-agnostic. However, overlay rendering using Qt6 and mouse control (used in Bubble Cursor and Semantic Pointing) rely on system-level APIs that differ between operating systems. These components have been validated on Windows and Ubuntu (X11 sessions). Wayland212121https://wiki.archlinux.org/title/Wayland is not currently supported due to limitations in available screen capture libraries, and adaptations are necessary on macOS.
We now present two demonstrations of the functionality enabled by TargetFinder, showing how it allows a system-wide implementation of two existing target-aware pointing facilitation techniques. The techniques are illustrated on an Ubuntu 24.04 system. Videos of the systems working in real-time and system-wide are available in the supplementary materials, as well as further details on the technical solutions used.
6.3. Illustration in bubble cursor
We implemented the Bubble Cursor using TargetFinder, following the algorithm described by \NoHyperGrossman and Balakrishnan\endNoHyper (Grossman and Balakrishnan, 2005) which continuously adjusts the cursor’s radius to select only the closest target inside the active area. To display the bubble cursor (see Fig. 6-b for an example), we use a PyQt overlay while completely hiding the system cursor using low-level system functions222222We used the Python ctypes library. Although PyQt can hide the system cursor, in practice, due to conflicts between screen capture, overlay refresh, and click handling, we chose to hide the system cursor entirely for robustness. More details on our engineering choices are provided in the supplementary materials.. This overlay is updated every 10 ms. When the user clicks, the system automatically redirects the hidden pointer to the center of the nearest widget using the pyautogui232323https://pypi.org/project/PyAutoGUI/ library to simulate a click, then moves the pointer back to its original location to ensure that the interaction remains smooth.
6.4. Illustration in semantic pointing
Semantic pointing (Blanch et al., 2004) dynamically adjusts the control-display ratio (Casiez and Roussel, 2011) (C/D), based on how close the cursor is to nearby targets. Decreasing the C/D ratio when the cursor is near or within a target causes the cursor to slow down, meaning the user must move their hand farther to traverse the same number of pixels, which enlarges the target in motor space while keeping its appearance in visual space unchanged. To implement Semantic pointing, as in the Bubble Cursor implementation, we fully hide the system cursor and render a fake cursor using PyQt, refreshing every 10 ms. We apply the spatial scaling function as defined in the original work by \NoHyperBlanch et al.\endNoHyper (Blanch et al., 2004), parametrized by the semantic importance : for , the cursor moves faster, and the widget appears smaller in motor space; conversely for , the cursor moves slower and the widget appears larger in motor space. Fig. 6-c illustrates242424This additional visual layer can be displayed with the --display option in our implementation, but by default the size in motor space is hidden, and the technique is visually imperceptible to users. the bounding box of a target in visual space as determined by TargetFinder (green), and the associated size in motor space with the semantic pointing technique (red, dashed) for .
7. Limitations
Limited number of widget classes
We considered 6 classes in the current implementation of TargetFinder, but prior work has generally used more, e.g. 27 in (Martínez-Rojas et al., 2024b). Considering that our intended applications do not actually require knowing the type of widget being targeted, and given that performance comparisons with existing techniques are necessarily mono-class, we opted for a limited number of high-level classes. It should also be noted that a universal set of classes does not exist: for example, OS-Atlas uses 34 classes for Linux and 24 for Mac OS (Wu et al., 2025). Another example is in Fig. 11, where it is not obvious whether the DatePicker widget should be classified as Button, a Text field, or a class on its own. Further, the choice of classes is dependent on the application; for example the authors of semantic pointing describe how they reduced the motor space of the [Don’t save] button but increased the motor space of the [Save] button. Thus, a class-aware version of semantic pointing would not consider a Button class so much as classes of recovery-from-error costs. We addressed this limitation in two ways: first, we elected to facilitate the relabeling of widget classes as much as possible by releasing our annotation tool, which is easily extendable to more classes. Second, TargetFinder optionally provides a screenshot of each widget alongside geometric information, allowing further downstream classification e.g. based on OCR (Li et al., 2023).
Limitations of TargetFinder in practice
TargetFinder currently does not identify hierarchies of widgets, such as the fact that the close tab icon belongs to the tab button, nor does it return entire windows, which are sometimes the target of users wanting to deselect or switch focus. These cases are likely better treated with extra post-processing, rather than by adding specific classes such as window or compounded widget. For instance, if a click occurred on an identified target, re-running YOLO within the bounding box of the widget to see if other sub-widgets are found within; and if not, analyzing the whole image looking specifically for windows.
Dataset size
Our dataset contains more than 42,000 annotations from about 600 screenshots, far from OmniParser’s training set, which has more than 60k screenshots. Yet, thanks to manual labeling and inclusion of desktop screenshots, TargetFinder outperforms OmniParser. This result reinforces that the quality of the data is essential (Halevy et al., 2009; Sutton, 2019). That being said, further performance enhancements can likely be gained by increasing the size of training set.
Real-time performance
The end-to-end latency of our system is about 200 ms. While this may seem like a large delay, considering the effect that latency has on pointing performance when evaluated by Fitts’ law (Hoffmann, 1992), this processing delay is not equivalent to adding a constant latency to the pointer: it only affects the brief moment immediately after an interface change (e.g., when a new window is opened), during which the widget information cannot be exploited. Still, since inference time can be traded-off for precision and recall (see §5), it remains an important concern.
8. Conclusion and Future Work
This work introduces TargetFinder, a real-time, computer vision-based library for identifying GUI widgets across desktop environments. Unlike traditional approaches that rely on accessibility APIs or application-specific access, TargetFinder operates independently of platform internals, enabling system-wide widget detection. To support this, we compiled a novel dataset of 520 annotated screenshots spanning multiple OSes and interface types. We fine-tuned multiple YOLO object detection models, of various sizes and input resolution, on this dataset, achieving significantly higher widget detection accuracy compared to existing methods. Finally, we illustrate the immediate applicability of TargetFinder by enabling two classic target-aware pointing techniques, Bubble Cursor and Semantic Pointing, as drop-in enhancements on standard Windows systems. Each of these contributions (annotation tool, annotated dataset, trained models, TargetFinder and pointing techniques code) are made publicly available. These contributions pave the way for wider deployment of advanced interaction techniques without requiring cooperation from application developers or access to source code. Our findings also shed light on the generalization capabilities of object detection methods in desktop GUIs, showing the importance of including images from various OS’s and themes in the training set. Apart from building target-aware interaction techniques, we see two other avenues for future work with TargetFinder:
-
•
Ecological (or “in the wild”) studies of interaction, that evaluate pointing behavior in realistic environments. TargetFinder should facilitate the validation of established models like Fitts’ Law in real-world contexts (Chapuis et al., 2007), ecological comparisons between interaction techniques, and tuning of pointing facilitation mechanisms (Lee et al., 2020).
-
•
As highlighted §2.3, many applications implement accessibility APIs incompletely or incorrectly, creating barriers for assistive technologies. Reliable spatial and semantic information about interface widgets provided by tools such as TargetFinder could contribute to more robust screen readers, magnification tools, or alternative input methods that can operate independently of developer-provided accessibility metadata.
Acknowledgements.
Thanks to Fabio Matti, Ludovico Novelli and Rosie Frost for insightful private discussions. This work was partially funded by ANR-24-CE33-7994-01 HCIMI.References
- (1)
- MSA (2020) 2020. Microsoft Active Accessibility. https://learn.microsoft.com/en-us/windows/win32/winauto/microsoft-active-accessibility. Accessed: 2025-09-10.
- wal (2020) 2020. Waltteri Desktop UI Dataset. https://github.com/waltteri/desktop-ui-dataset. Accessed: 2025-09-10.
- MSU (2021) 2021. Microsoft UI Automation. https://learn.microsoft.com/en-us/windows/win32/winauto/entry-uiauto-win32. Accessed: 2025-09-10.
- Altinbas and Serif (2022) Mehmet Dogan Altinbas and Tacha Serif. 2022. GUI Element Detection from Mobile UI Images Using YOLOv5. In Mobile Web and Intelligent Information Systems: 18th International Conference, MobiWIS 2022, Rome, Italy, August 22–24, 2022, Proceedings (Rome, Italy). Springer-Verlag, Berlin, Heidelberg, 32–45. doi:10.1007/978-3-031-14391-5_3
- Asano et al. (2005) Takeshi Asano, Ehud Sharlin, Yoshifumi Kitamura, Kazuki Takashima, and Fumio Kishino. 2005. Predictive interaction using the delphian desktop. In Proceedings of the 18th Annual ACM Symposium on User Interface Software and Technology (Seattle, WA, USA) (UIST ’05). Association for Computing Machinery, New York, NY, USA, 133–141. doi:10.1145/1095034.1095058
- Bai et al. (2021) Chongyang Bai, Xiaoxue Zang, Ying Xu, Srinivas Sunkara, Abhinav Rastogi, Jindong Chen, and Blaise Agüera y Arcas. 2021. UIBert: Learning Generic Multimodal Representations for UI Understanding. In Proceedings of the Thirtieth International Joint Conference on Artificial Intelligence, IJCAI-21, Zhi-Hua Zhou (Ed.). International Joint Conferences on Artificial Intelligence Organization, 1705–1712. doi:10.24963/ijcai.2021/235 Main Track.
- Baudisch et al. (2003) Patrick Baudisch, Edward Cutrell, Mary Czerwinski, Daniel C Robbins, Peter Tandler, Benjamin B Bederson, and Alex Zierlinger. 2003. Drag-and-Pop and Drag-and-Pick: Techniques for Accessing Remote Screen Content on Touch-and Pen-Operated Systems.. In Interact, Vol. 3. Citeseer, 57–64.
- Baulé et al. (2020) Daniel Baulé, Christiane Gresse von Wangenheim, Aldo Von Wangenheim, and Jean Hauck. 2020. Recent Progress in Automated Code Generation from GUI Images Using Machine Learning Techniques. JUCS - Journal of Universal Computer Science 26, 9 (2020), 1095–1127. arXiv:https://doi.org/10.3897/jucs.2020.058 doi:10.3897/jucs.2020.058
- Beltramelli (2018) Tony Beltramelli. 2018. pix2code: Generating Code from a Graphical User Interface Screenshot. In Proceedings of the ACM SIGCHI Symposium on Engineering Interactive Computing Systems (Paris, France) (EICS ’18). Association for Computing Machinery, New York, NY, USA, Article 3, 6 pages. doi:10.1145/3220134.3220135
- Bi et al. (2022) Tingting Bi, Xin Xia, David Lo, John Grundy, Thomas Zimmermann, and Denae Ford. 2022. Accessibility in Software Practice: A Practitioner’s Perspective. ACM Trans. Softw. Eng. Methodol. 31, 4, Article 66 (July 2022), 26 pages. doi:10.1145/3503508
- Blanch et al. (2004) Renaud Blanch, Yves Guiard, and Michel Beaudouin-Lafon. 2004. Semantic pointing: improving target acquisition with control-display ratio adaptation. In Proceedings of the SIGCHI Conference on Human Factors in Computing Systems (Vienna, Austria) (CHI ’04). Association for Computing Machinery, New York, NY, USA, 519–526. doi:10.1145/985692.985758
- Bunian et al. (2021) Sara Bunian, Kai Li, Chaima Jemmali, Casper Harteveld, Yun Fu, and Magy Seif Seif El-Nasr. 2021. VINS: Visual Search for Mobile User Interface Design. In Proceedings of the 2021 CHI Conference on Human Factors in Computing Systems (Yokohama, Japan) (CHI ’21). Association for Computing Machinery, New York, NY, USA, Article 423, 14 pages. doi:10.1145/3411764.3445762
- Canny (1986) John Canny. 1986. A computational approach to edge detection. IEEE Transactions on pattern analysis and machine intelligence PAMI-8 (12 1986), 679–698. doi:10.1109/TPAMI.1986.4767851
- Casiez and Roussel (2011) Géry Casiez and Nicolas Roussel. 2011. No more bricolage! methods and tools to characterize, replicate and compare pointing transfer functions. In Proceedings of the 24th Annual ACM Symposium on User Interface Software and Technology (Santa Barbara, California, USA) (UIST ’11). Association for Computing Machinery, New York, NY, USA, 603–614. doi:10.1145/2047196.2047276
- Chapuis (2005) Olivier Chapuis. 2005. Gestion des fenêtres : enregistrement et visualisation de l’interaction. In IHM ’05: Proceedings of the 17th international conference of the Association Francophone d’Interaction Homme-Machine. Toulouse, France, 255–258. doi:10.1145/1148550.1148590
- Chapuis et al. (2007) Olivier Chapuis, Renaud Blanch, and Michel Beaudouin-Lafon. 2007. Fitts’ Law in the Wild: A Field Study of Aimed Movements. Technical Report. https://hal.science/hal-00612026 LRI Technical Repport Number 1480, Univ. Paris-Sud, 11 pages..
- Chapuis et al. (2009) Olivier Chapuis, Jean-Baptiste Labrune, and Emmanuel Pietriga. 2009. DynaSpot: speed-dependent area cursor. In Proceedings of the SIGCHI Conference on Human Factors in Computing Systems (Boston, MA, USA) (CHI ’09). Association for Computing Machinery, New York, NY, USA, 1391–1400. doi:10.1145/1518701.1518911
- Chen et al. (2020) Jieshan Chen, Mulong Xie, Zhenchang Xing, Chunyang Chen, Xiwei Xu, Liming Zhu, and Guoqiang Li. 2020. Object detection for graphical user interface: old fashioned or deep learning or a combination?. In Proceedings of the 28th ACM Joint Meeting on European Software Engineering Conference and Symposium on the Foundations of Software Engineering (Virtual Event, USA) (ESEC/FSE 2020). Association for Computing Machinery, New York, NY, USA, 1202–1214. doi:10.1145/3368089.3409691
- Deka et al. (2017) Biplab Deka, Zifeng Huang, Chad Franzen, Joshua Hibschman, Daniel Afergan, Yang Li, Jeffrey Nichols, and Ranjitha Kumar. 2017. Rico: A Mobile App Dataset for Building Data-Driven Design Applications. In Proceedings of the 30th Annual ACM Symposium on User Interface Software and Technology (Québec City, QC, Canada) (UIST ’17). Association for Computing Machinery, New York, NY, USA, 845–854. doi:10.1145/3126594.3126651
- Dixon and Fogarty (2010) Morgan Dixon and James Fogarty. 2010. Prefab: implementing advanced behaviors using pixel-based reverse engineering of interface structure. In Proceedings of the SIGCHI Conference on Human Factors in Computing Systems. 1525–1534.
- Dixon et al. (2012) Morgan Dixon, James Fogarty, and Jacob Wobbrock. 2012. A general-purpose target-aware pointing enhancement using pixel-level analysis of graphical interfaces. In Proceedings of the SIGCHI Conference on Human Factors in Computing Systems. 3167–3176.
- Evans and Wobbrock (2012) Abigail Evans and Jacob Wobbrock. 2012. Taming wild behavior: the input observer for obtaining text entry and mouse pointing measures from everyday computer use. In Proceedings of the SIGCHI Conference on Human Factors in Computing Systems (Austin, Texas, USA) (CHI ’12). Association for Computing Machinery, New York, NY, USA, 1947–1956. doi:10.1145/2207676.2208338
- Findlater et al. (2010) Leah Findlater, Alex Jansen, Kristen Shinohara, Morgan Dixon, Peter Kamb, Joshua Rakita, and Jacob O. Wobbrock. 2010. Enhanced area cursors: reducing fine pointing demands for people with motor impairments. In Proceedings of the 23nd Annual ACM Symposium on User Interface Software and Technology (New York, New York, USA) (UIST ’10). Association for Computing Machinery, New York, NY, USA, 153–162. doi:10.1145/1866029.1866055
- Gajos et al. (2012) Krzysztof Gajos, Katharina Reinecke, and Charles Herrmann. 2012. Accurate measurements of pointing performance from in situ observations. In Proceedings of the SIGCHI Conference on Human Factors in Computing Systems (Austin, Texas, USA) (CHI ’12). Association for Computing Machinery, New York, NY, USA, 3157–3166. doi:10.1145/2207676.2208733
- Gori and Rioul (2019) Julien Gori and Olivier Rioul. 2019. Regression to a linear lower bound with outliers: An exponentially modified Gaussian noise model. In 2019 27th European Signal Processing Conference (EUSIPCO). IEEE, 1–5.
- Grossman and Balakrishnan (2005) Tovi Grossman and Ravin Balakrishnan. 2005. The bubble cursor: enhancing target acquisition by dynamic resizing of the cursor’s activation area. In Proceedings of the SIGCHI Conference on Human Factors in Computing Systems (Portland, Oregon, USA) (CHI ’05). Association for Computing Machinery, New York, NY, USA, 281–290. doi:10.1145/1054972.1055012
- Guiard et al. (2004) Yves Guiard, Renaud Blanch, and Michel Beaudouin-Lafon. 2004. Object pointing: a complement to bitmap pointing in GUIs. In Proceedings of Graphics Interface 2004 (London, Ontario, Canada) (GI ’04). Canadian Human-Computer Communications Society, Waterloo, CAN, 9–16.
- Halevy et al. (2009) Alon Halevy, Peter Norvig, and Fernando Pereira. 2009. The Unreasonable Effectiveness of Data. IEEE Intelligent Systems 24, 2 (2009), 8–12. doi:10.1109/MIS.2009.36
- Hertzum and Hornbæk (2007) Morten Hertzum and Kasper Hornbæk. 2007. Input techniques that dynamically change their cursor activation area: A comparison of bubble and cell cursors. Int. J. Hum.-Comput. Stud. 65, 10 (Oct. 2007), 833–851. doi:10.1016/j.ijhcs.2007.05.001
- Hoffmann (1992) Errol R Hoffmann. 1992. Fitts’ law with transmission delay. Ergonomics 35, 1 (1992), 37–48.
- Hui et al. (2025) Zheng Hui, Yinheng Li, Dan zhao, Tianyi Chen, Colby Banbury, and Kazuhito Koishida. 2025. WinClick: GUI Grounding with Multimodal Large Language Models. arXiv:2503.04730 [cs.CL] https://arxiv.org/abs/2503.04730
- Hurst et al. (2007) Amy Hurst, Scott E. Hudson, and Jennifer Mankoff. 2007. Dynamic detection of novice vs. skilled use without a task model. In Proceedings of the SIGCHI Conference on Human Factors in Computing Systems (San Jose, California, USA) (CHI ’07). Association for Computing Machinery, New York, NY, USA, 271–280. doi:10.1145/1240624.1240669
- Hurst et al. (2010) Amy Hurst, Scott E. Hudson, and Jennifer Mankoff. 2010. Automatically identifying targets users interact with during real world tasks. In Proceedings of the 15th International Conference on Intelligent User Interfaces (Hong Kong, China) (IUI ’10). Association for Computing Machinery, New York, NY, USA, 11–20. doi:10.1145/1719970.1719973
- Jansen et al. (2011) Alex Jansen, Leah Findlater, and Jacob O. Wobbrock. 2011. From the lab to the world: lessons from extending a pointing technique for real-world use. In CHI ’11 Extended Abstracts on Human Factors in Computing Systems (Vancouver, BC, Canada) (CHI EA ’11). Association for Computing Machinery, New York, NY, USA, 1867–1872. doi:10.1145/1979742.1979888
- Kabbash and Buxton (1995) Paul Kabbash and William A. S. Buxton. 1995. The “prince” technique: Fitts’ law and selection using area cursors. In Proceedings of the SIGCHI Conference on Human Factors in Computing Systems (Denver, Colorado, USA) (CHI ’95). ACM Press/Addison-Wesley Publishing Co., USA, 273–279. doi:10.1145/223904.223939
- Kapoor et al. (2025) Raghav Kapoor, Yash Parag Butala, Melisa Russak, Jing Yu Koh, Kiran Kamble, Waseem AlShikh, and Ruslan Salakhutdinov. 2025. OmniACT: A Dataset and Benchmark for Enabling Multimodal Generalist Autonomous Agents for Desktop and Web. In Computer Vision – ECCV 2024, Aleš Leonardis, Elisa Ricci, Stefan Roth, Olga Russakovsky, Torsten Sattler, and Gül Varol (Eds.). Springer Nature Switzerland, Cham, 161–178.
- Lee et al. (2020) Byungjoo Lee, Mathieu Nancel, Sunjun Kim, and Antti Oulasvirta. 2020. AutoGain: Gain Function Adaptation with Submovement Efficiency Optimization. In Proceedings of the 2020 CHI Conference on Human Factors in Computing Systems (Honolulu, HI, USA) (CHI ’20). Association for Computing Machinery, New York, NY, USA, 1–12. doi:10.1145/3313831.3376244
- Li et al. (2023) Minghao Li, Tengchao Lv, Jingye Chen, Lei Cui, Yijuan Lu, Dinei Florencio, Cha Zhang, Zhoujun Li, and Furu Wei. 2023. Trocr: Transformer-based optical character recognition with pre-trained models. In Proceedings of the AAAI conference on artificial intelligence, Vol. 37. 13094–13102.
- Lin et al. (2017) Tsung-Yi Lin, Piotr Dollár, Ross Girshick, Kaiming He, Bharath Hariharan, and Serge Belongie. 2017. Feature pyramid networks for object detection. In Proceedings of the IEEE conference on computer vision and pattern recognition. 2117–2125.
- Lin et al. (2014) Tsung-Yi Lin, Michael Maire, Serge Belongie, James Hays, Pietro Perona, Deva Ramanan, Piotr Dollár, and C. Lawrence Zitnick. 2014. Microsoft COCO: Common Objects in Context. In Computer Vision – ECCV 2014, David Fleet, Tomas Pajdla, Bernt Schiele, and Tinne Tuytelaars (Eds.). Springer International Publishing, Cham, 740–755.
- Liu et al. (2017) Wanyu Liu, Rafael Lucas D’Oliveira, Michel Beaudouin-Lafon, and Olivier Rioul. 2017. BIGnav: Bayesian Information Gain for Guiding Multiscale Navigation. In Proceedings of the 2017 CHI Conference on Human Factors in Computing Systems (Denver, Colorado, USA) (CHI ’17). Association for Computing Machinery, New York, NY, USA, 5869–5880. doi:10.1145/3025453.3025524
- Lu et al. (2024) Yadong Lu, Jianwei Yang, Yelong Shen, and Ahmed Awadallah. 2024. OmniParser for Pure Vision Based GUI Agent. arXiv:2408.00203 [cs.CV] https://arxiv.org/abs/2408.00203
- Malacria et al. (2013) Sylvain Malacria, Joey Scarr, Andy Cockburn, Carl Gutwin, and Tovi Grossman. 2013. Skillometers: reflective widgets that motivate and help users to improve performance. In Proceedings of the 26th Annual ACM Symposium on User Interface Software and Technology (St. Andrews, Scotland, United Kingdom) (UIST ’13). Association for Computing Machinery, New York, NY, USA, 321–330. doi:10.1145/2501988.2501996
- Martínez-Rojas et al. (2024a) A. Martínez-Rojas, A. Rodríguez-Ruíz, J. G. Enríquez, and A. Jiménez-Ramírez. 2024a. uidetection: Implementation of Screen2SOM (YOLOv8). https://github.com/RPA-US/uidetection/. Accessed: 2025-09-10.
- Martínez-Rojas et al. (2024b) A. Martínez-Rojas, A. Rodríguez-Ruíz, J. G. Enríquez, and A. Jiménez-Ramírez. 2024b. What’s Behind the Screen? Unveiling UI Hierarchies in Process-Related UI Logs. In Business Process Management: 22nd International Conference, BPM 2024, Krakow, Poland, September 1–6, 2024, Proceedings (Krakow, Poland). Springer-Verlag, Berlin, Heidelberg, 256–272. doi:10.1007/978-3-031-70396-6_15
- Matti et al. (2023) Fabio Matti, Pierre Dillenbourg, and Ludovico Novelli. 2023. A Click Ahead: Real-Time Forecasting of Keyboard and Mouse Actions using RNNs and Computer Vision. arXiv:2309.12170 [cs.HC] https://arxiv.org/abs/2309.12170
- McGuffin and Balakrishnan (2002) Michael McGuffin and Ravin Balakrishnan. 2002. Acquisition of expanding targets. In Proceedings of the SIGCHI Conference on Human Factors in Computing Systems (Minneapolis, Minnesota, USA) (CHI ’02). Association for Computing Machinery, New York, NY, USA, 57–64. doi:10.1145/503376.503388
- Nayak et al. (2025) Shravan Nayak, Xiangru Jian, Kevin Qinghong Lin, Juan A. Rodriguez, Montek Kalsi, Nicolas Chapados, M. Tamer Özsu, Aishwarya Agrawal, David Vazquez, Christopher Pal, Perouz Taslakian, Spandana Gella, and Sai Rajeswar. 2025. UI-Vision: A Desktop-centric GUI Benchmark for Visual Perception and Interaction. In Forty-second International Conference on Machine Learning. https://openreview.net/forum?id=5Rtj4mYH1C
- Nguyen and Csallner (2015) Tuan Anh Nguyen and Christoph Csallner. 2015. Reverse Engineering Mobile Application User Interfaces with REMAUI (T). In 2015 30th IEEE/ACM International Conference on Automated Software Engineering (ASE). 248–259. doi:10.1109/ASE.2015.32
- Patel et al. (2020) Rohan Patel, Pedro Breton, Catherine M. Baker, Yasmine N. El-Glaly, and Kristen Shinohara. 2020. Why Software is Not Accessible: Technology Professionals’ Perspectives and Challenges. In Extended Abstracts of the 2020 CHI Conference on Human Factors in Computing Systems (Honolulu, HI, USA) (CHI EA ’20). Association for Computing Machinery, New York, NY, USA, 1–9. doi:10.1145/3334480.3383103
- Qiu et al. (2025) Ji Qiu, Wenbo Zhang, Siyuan Xu, and Huiyu Zhou. 2025. DP-YOLO: A lightweight traffic sign detection model for small object detection. Digital Signal Processing 165 (2025), 105311.
- Ravi et al. (2025) Nikhila Ravi, Valentin Gabeur, Yuan-Ting Hu, Ronghang Hu, Chaitanya Ryali, Tengyu Ma, Haitham Khedr, Roman Rädle, Chloe Rolland, Laura Gustafson, Eric Mintun, Junting Pan, Kalyan Vasudev Alwala, Nicolas Carion, Chao-Yuan Wu, Ross Girshick, Piotr Dollar, and Christoph Feichtenhofer. 2025. SAM 2: Segment Anything in Images and Videos. In The Thirteenth International Conference on Learning Representations. https://openreview.net/forum?id=Ha6RTeWMd0
- Redmon et al. (2016) Joseph Redmon, Santosh Divvala, Ross Girshick, and Ali Farhadi. 2016. You Only Look Once: Unified, Real-Time Object Detection. In Proceedings of the IEEE Conference on Computer Vision and Pattern Recognition (CVPR). https://www.cv-foundation.org/openaccess/content_cvpr_2016/papers/Redmon_You_Only_Look_CVPR_2016_paper.pdf
- Sahu (2020) Tezan Sahu. 2020. Smart UI Detector. https://github.com/tezansahu/smart_ui_tf20. Accessed: 2025-09-10.
- Su et al. (2014) Xiaojun Su, Oscar Kin-Chung Au, and Rynson W.H. Lau. 2014. The implicit fan cursor: a velocity dependent area cursor. In Proceedings of the SIGCHI Conference on Human Factors in Computing Systems (Toronto, Ontario, Canada) (CHI ’14). Association for Computing Machinery, New York, NY, USA, 753–762. doi:10.1145/2556288.2557095
- Sutton (2019) Richard Sutton. 2019. The bitter lesson. http://www.incompleteideas.net/IncIdeas/BitterLesson.html. Accessed: 2025-09-10.
- Swearngin and Li (2019) Amanda Swearngin and Yang Li. 2019. Modeling Mobile Interface Tappability Using Crowdsourcing and Deep Learning. In Proceedings of the 2019 CHI Conference on Human Factors in Computing Systems (Glasgow, Scotland Uk) (CHI ’19). Association for Computing Machinery, New York, NY, USA, 1–11. doi:10.1145/3290605.3300305
- Wang et al. (2021) Jinwang Wang, Chang Xu, Wen Yang, and Lei Yu. 2021. A normalized Gaussian Wasserstein distance for tiny object detection. arXiv preprint arXiv:2110.13389 (2021).
- Worden et al. (1997) Aileen Worden, Nef Walker, Krishna Bharat, and Scott Hudson. 1997. Making computers easier for older adults to use: area cursors and sticky icons. In Proceedings of the ACM SIGCHI Conference on Human Factors in Computing Systems (Atlanta, Georgia, USA) (CHI ’97). Association for Computing Machinery, New York, NY, USA, 266–271. doi:10.1145/258549.258724
- Wu et al. (2025) Zhiyong Wu, Zhenyu Wu, Fangzhi Xu, Yian Wang, Qiushi Sun, Chengyou Jia, Kanzhi Cheng, Zichen Ding, Liheng Chen, Paul Pu Liang, and Yu Qiao. 2025. OS-ATLAS: Foundation Action Model for Generalist GUI Agents. In The Thirteenth International Conference on Learning Representations. https://openreview.net/forum?id=n9PDaFNi8t
- Xie et al. (2020a) Mulong Xie, Sidong Feng, Zhenchang Xing, Jieshan Chen, and Chunyang Chen. 2020a. UIED: a hybrid tool for GUI element detection. In Proceedings of the 28th ACM Joint Meeting on European Software Engineering Conference and Symposium on the Foundations of Software Engineering (Virtual Event, USA) (ESEC/FSE 2020). Association for Computing Machinery, New York, NY, USA, 1655–1659. doi:10.1145/3368089.3417940
- Xie et al. (2020b) Mulong Xie, Sidong Feng, Zhenchang Xing, Jieshan Chen, and Chunyang Chen. 2020b. UIED: User Interface Element Detection. https://github.com/MulongXie/UIED. Accessed: 2025-09-10.
- Zhai et al. (2003) Shumin Zhai, Stéphane Conversy, Michel Beaudouin-Lafon, and Yves Guiard. 2003. Human on-line response to target expansion. In Proceedings of the SIGCHI Conference on Human Factors in Computing Systems (Ft. Lauderdale, Florida, USA) (CHI ’03). Association for Computing Machinery, New York, NY, USA, 177–184. doi:10.1145/642611.642644
- Zhang et al. (2023) Chaoning Zhang, Dongshen Han, Yu Qiao, Jung Uk Kim, Sung-Ho Bae, Seungkyu Lee, and Choong Seon Hong. 2023. Faster Segment Anything: Towards Lightweight SAM for Mobile Applications. arXiv:2306.14289 [cs.CV] https://arxiv.org/abs/2306.14289
- Zhang et al. (2021) Xiaoyi Zhang, Lilian de Greef, Amanda Swearngin, Samuel White, Kyle Murray, Lisa Yu, Qi Shan, Jeffrey Nichols, Jason Wu, Chris Fleizach, Aaron Everitt, and Jeffrey P Bigham. 2021. Screen Recognition: Creating Accessibility Metadata for Mobile Applications from Pixels. In Proceedings of the 2021 CHI Conference on Human Factors in Computing Systems (Yokohama, Japan) (CHI ’21). Association for Computing Machinery, New York, NY, USA, Article 275, 15 pages. doi:10.1145/3411764.3445186
- Zhu et al. (2023) Junda Zhu, Jun Ai, Tao Shi, Congran Zhang, and Xinyue Wu. 2023. An Intelligent Labeling and Dataset Generating Method for Desktop Application Element Object Detection. In 2023 10th International Conference on Dependable Systems and Their Applications (DSA). 860–869. doi:10.1109/DSA59317.2023.00121
- Ziebart et al. (2012) Brian Ziebart, Anind Dey, and J. Andrew Bagnell. 2012. Probabilistic pointing target prediction via inverse optimal control. In Proceedings of the 2012 ACM International Conference on Intelligent User Interfaces (Lisbon, Portugal) (IUI ’12). Association for Computing Machinery, New York, NY, USA, 1–10. doi:10.1145/2166966.2166968
9. Appendices
9.1. Semi-automatic annotation tool

9.2. GUI element types
List of GUI widgets:
-
(1)
The ToggleButton class includes all binary state controls such as checkboxes, switches, and radio buttons.
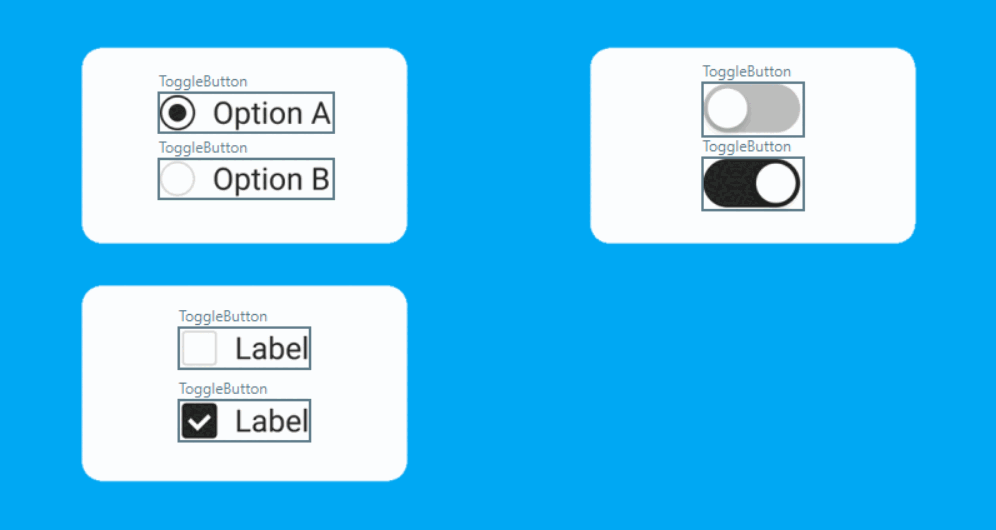
Figure 8. Example of annotated ToggleButtons. Example of annotated ToggleButtons with gray bounding boxes around each button. -
(2)
The TextInput class covers interactive fields that allow users to enter text when selected, such as form inputs or search bars.

Figure 9. Example of annotated TextInput fields. Example of annotated TextInput fields with red bounding boxes around each field. -
(3)
The Slider class refers to sliding controls like volume adjusters or scrollbars; in such cases, we annotate the entire track along which the slider moves, excluding any side buttons, which are labeled as Button.

Figure 10. Example of annotated slider. Example of annotated slider with blue bounding boxes around the slider and buttons. -
(4)
The Text class covers regions containing textual content such as paragraphs, code blocks, or documentation. We do not annotate isolated short words unless they are visually emphasized (e.g. large headings) or grouped together, to avoid confusion with single-word buttons.
-
(5)
The Hyperlink class is restricted to clickable text contained within a Text block, in order to distinguish it from single-word clickable buttons.

Figure 11. Example of annotated hyperlinks and text blocks. Example of annotated hyperlinks and text blocks with orange bounding boxes around textInputs, blue around buttons and green around text blocks. -
(6)
The Button class encompasses all other clickable components not included in the previous categories, such as dropdown triggers, tabs, or general-purpose buttons.

Figure 12. Example of various annotated buttons. Example of various annotated buttons with blue bounding boxes around each button.
9.3. Evaluation metrics for object detection
The evaluation metrics commonly used in the object detection literature are:
-
(1)
Intersection over Union (IoU): This is the ratio between the number of pixels in the intersection of the ground truth object and the predicted object (true positive), and the number of pixels in their union. It measures the localization and size quality of the bounding boxes. See Fig. 13. The mean IoU (mIoU) represents the average IoU over all true positives.

Figure 13. Intersection over Union. Ilustration of Intersection over Union (IoU) with example bounding boxes. -
(2)
Precision: The number of correct detections (true positives) divided by the total number of detections. It reflects the model’s ability to avoid false positives.
-
(3)
Recall: The number of correct detections (true positives) divided by the total number of ground truth instances (i.e., the sum of true positives and false negatives). It reflects the model’s ability to avoid missing targets.
-
(4)
F1 Score: The harmonic mean of precision and recall. It offers a balance between these two metrics and penalizes imbalances (if one is very low, the F1 score will also be low).
In practice, the F1 score can be plotted as a function of the confidence threshold to determine the score that best balances precision and recall.
-
(5)
Mean Average Precision mAP@0.5: The average of the AP@0.5 across all classes, where AP@0.5 is the area under the precision-recall curve measured at IoU > 0.5. It provides an overall measure of model performance.
-
(6)
Mean Average Precision mAP@0.5:0.95: Similar to mAP@0.5, but averaged over IoU thresholds ranging from 0.5 to 0.95 in increments of 0.05 (stricter). This gives better insight into how the model performs as the localization accuracy requirement increases.
9.4. Agreement with the primary annotator
We randomly selected 15 images and asked three independent annotators to re-label them using the same guidelines and the same tool described in Section 3.1. Their annotations were then compared to those of the primary annotator (the version used in the final dataset).
To quantify agreement, we use the F1-score and the mIoU, with matches defined using an IoU threshold of 0.5.
Table 4 reports these metrics for each of the 15 sampled images, for all three annotators, together with their means.
| Image ID | F1 | mIoU | ||||||
| Ann1 | Ann2 | Ann3 | Mean | Ann1 | Ann2 | Ann3 | Mean | |
| img_001 | 0.892 | 0.925 | 0.922 | 0.913 | 0.886 | 0.875 | 0.859 | 0.873 |
| img_002 | 0.952 | 0.972 | 0.993 | 0.973 | 0.917 | 0.918 | 0.912 | 0.916 |
| img_003 | 0.957 | 0.945 | 0.802 | 0.902 | 0.896 | 0.874 | 0.863 | 0.877 |
| img_004 | 0.880 | 0.905 | 0.772 | 0.852 | 0.850 | 0.844 | 0.851 | 0.848 |
| img_005 | 0.901 | 0.913 | 0.907 | 0.907 | 0.915 | 0.893 | 0.912 | 0.907 |
| img_006 | 0.981 | 0.962 | 0.981 | 0.974 | 0.927 | 0.937 | 0.935 | 0.933 |
| img_007 | 0.970 | 0.983 | 0.978 | 0.977 | 0.874 | 0.875 | 0.879 | 0.876 |
| img_008 | 0.989 | 0.994 | 0.989 | 0.991 | 0.956 | 0.959 | 0.960 | 0.958 |
| img_009 | 0.882 | 0.857 | 1.000 | 0.913 | 0.934 | 0.931 | 0.930 | 0.932 |
| img_010 | 0.894 | 0.905 | 0.917 | 0.905 | 0.737 | 0.751 | 0.718 | 0.735 |
| img_011 | 0.937 | 1.000 | 0.975 | 0.971 | 0.946 | 0.932 | 0.939 | 0.939 |
| img_012 | 0.945 | 0.934 | 0.886 | 0.922 | 0.876 | 0.874 | 0.821 | 0.857 |
| img_013 | 0.944 | 0.959 | 0.920 | 0.941 | 0.894 | 0.881 | 0.880 | 0.885 |
| img_014 | 0.948 | 0.924 | 0.931 | 0.934 | 0.922 | 0.922 | 0.918 | 0.920 |
| img_015 | 0.951 | 0.852 | 0.967 | 0.923 | 0.922 | 0.934 | 0.913 | 0.923 |
| Mean | 0.935 | 0.935 | 0.929 | 0.933 | 0.897 | 0.893 | 0.886 | 0.892 |
9.5. Full visual comparison
A visual comparison of widget detection outputs from other methods and our trained YOLO26 model for three example screenshots is presented Figure 14.
Ubuntu example
macOs Example
Windows 10 Example
Ground truth
Our YOLO26
OmniParser YOLO
REMAUI


 UIED
UIED


 MobileSAM


 Martinez YOLO


 Visual comparison of widget detection outputs from other methods and our trained YOLO26 model for three example screenshots: a Firefox browser window in Ubuntu (left), a macOs desktop with white background (middle) and a Windows desktop with blue background and a screensaver that can lead to false detections (right). The first row shows the ground truth annotations, followed by rows showing the outputs from our YOLO26 model, OmniParser YOLO, REMAUI, UIED, MobileSAM, and Martinez-Rojas YOLO respectively. Each method’s output is displayed in a separate row for each of the three examples.
9.6. Other performances
| Size subset | Precision | Recall | F1 | mAP@0.5 | mAP@0.5:0.95 | mIoU |
| All sizes | 0.753 | 0.651 | 0.698 | 0.693 | 0.391 | 0.787 |
| Percentile 50 | 0.588 | 0.478 | 0.527 | 0.383 | 0.185 | 0.757 |
| Percentile 30 | 0.392 | 0.390 | 0.391 | 0.206 | 0.087 | 0.742 |
| Percentile 10 | 0.205 | 0.214 | 0.209 | 0.056 | 0.027 | 0.759 |
| Size subset | Precision | Recall | F1 | mAP@0.5 | mAP@0.5:0.95 | mIoU |
| All sizes | 0.430 | 0.484 | 0.455 | N/A | N/A | 0.749 |
| Percentile 50 | 0.333 | 0.427 | 0.374 | N/A | N/A | 0.742 |
| Percentile 30 | 0.227 | 0.388 | 0.287 | N/A | N/A | 0.751 |
| Percentile 10 | 0.160 | 0.256 | 0.197 | N/A | N/A | 0.801 |
| Size subset | Precision | Recall | F1 | mAP@0.5 | mAP@0.5:0.95 | mIoU |
| All sizes | 0.936 | 0.840 | 0.885 | 0.899 | 0.697 | 0.872 |
| Percentile 50 | 0.901 | 0.700 | 0.788 | 0.674 | 0.470 | 0.839 |
| Percentile 30 | 0.805 | 0.603 | 0.689 | 0.526 | 0.344 | 0.818 |
| Percentile 10 | 0.691 | 0.303 | 0.421 | 0.252 | 0.133 | 0.764 |