SPHEREx 0.75 to 5 m Spectra for a Sequence of Nearby Brown Dwarfs
Abstract
The SPHEREx all-sky survey has now measured the R40-100 infrared spectra of thousands of nearby brown dwarfs in the chemically rich 0.75-5 m range. The survey’s wide spectral coverage and high S/N permits flux measurements that capture several broadband molecular absorption features, and upwards of 80 of the total bolometric luminosity of most brown dwarfs. Atmospheric models are known to yield systematic disagreements in the inferred temperatures and radii of brown dwarfs, necessitating benchmarking against observations. In this work, we present SPHEREx spectra across a broad sequence of 37 nearby field brown dwarfs, ranging from L0 to Y4 (2500-250 K) and compare them to theoretical expectations. We additionally compile spectra for separate low-gravity and low-metallicity objects, and show how they trend with constant spectral type. We fit the measured spectra to the well-known forward model grids Sonora Diamondback, Elf Owl, BT-Settl, ATMO2020 and ATMO2020++ and compare their goodness-of-fit as a function of wavelength, spectral type, and treatment of clouds and chemistry. We find that the models continue to struggle to simultaneously fit the J/H/K peaks and the 4 m opacity window, especially in L/T transition objects. The largest deviations appear around the chemistry-sensitive CO2 and CO features. Despite these offsets, the models broadly capture their trends across the L/T transition, with the observed sample of field dwarfs strongly preferring the weak vertical mixing ( = 104 cm2s-1) Elf Owl models over strong mixing. The spectra shown here along with future SPHEREx data will help guide improvements to models.
show]zafar@caltech.edu
I Introduction
Brown dwarfs, substellar objects not massive enough to sustain stable hydrogen fusion, are an exceptionally colorful and varied group of celestial bodies. Among the 10,000 known brown dwarfs (Gagné et al., 2026), effective temperatures span 250 to 2,500 K while intrinsic luminosities range over four orders of magnitude depending on mass and age (e.g., Sanghi et al., 2023). The vertically thin photosphere of a brown dwarf is the ultimate mediator of its interior heat flux and therefore controls its radius evolution. Unlike stars, brown dwarfs cool, contract, and spin up with age (e.g., Schneider et al., 2018; Vos et al., 2020), resulting in observable population-wide changes in the character of their clouds and chemistry. In this way, their molecule-rich spectra tell stories of the delicate couplings linking their atmosphere, weather, climate, and interior through time.
Compositional trends in brown dwarf atmospheres resemble those of irradiated gas giant exoplanets—the hottest objects show strong H2O, CO, and alkali opacity, with magnesium silicate clouds appearing, then sinking below the photosphere as they cool below 1400 K with age (e.g., Gao et al., 2020; Suárez and Metchev, 2022; Lothringer et al., 2026). At colder temperatures and older ages, sulfide and chloride cloud species appear as CH4 becomes chemically favored over CO below 1000 K in T dwarf atmospheres (e.g., Lodders and Fegley, 2002; Tannock et al., 2022; Burgasser et al., 2025). The coldest brown dwarfs, the Y dwarfs, begin to resemble Jupiter and Saturn, whose CH4 and NH3-dominated atmospheres have vertically stratified clouds of diverse compositions, and with trace quantities of H2S and PH3 (Beiler et al., 2024; Kothari et al., 2024). These objects show diversity in composition and cloud coverage (e.g., Lueber et al., 2026). Unlike mature giant planets and exoplanets, unbound field brown dwarf atmospheres are heated entirely from within. By virtue of their independent thermochemical evolution, field brown dwarfs represent an idealized glimpse into the interacting processes liberating their primordial heat. Yet despite being internally heated, some brown dwarfs exhibit heat sources of uncertain origin manifesting as mysterious thermal inversions, or stratospheres, and chromospheric activity (e.g., Faherty et al., 2024; Reiners and Basri, 2008). Oddities aside, the bulk of brown dwarf fundamental parameters can only be estimated from model fits to their spectra. Namely, for an isolated self-luminous field dwarf, the radius, temperature, and mass estimates rely on the information content encoded by theoretical atmosphere models (Burrows et al., 2001; Baraffe et al., 2003; Saumon and Marley, 2008; Marley et al., 2021). To constrain their ages, these fundamental parameters are compared to evolution models that track the temperature and radius for a brown dwarf of given mass (Filippazzo et al., 2015; Dupuy and Liu, 2017).
Today, forward models gridded along the axes of temperature and gravity only qualitatively represent the major features seen in spectra, with large, 20% systematic differences dependent on the chosen input physics assumptions (e.g., Suárez et al., 2021; Petrus et al., 2024; Zhang et al., 2021). While theoretical and lab-measured molecular databases have been improving, model substellar spectra still differ from observations due to differences in their handling of clouds, chemistry, and the thermal profile. Empirical spectral classification continues to be a useful practice to augment these model-dependent determinations by populating a relative scale upon which to compare different objects.
I.1 Spectral Classification
In this paper, we present sequences of low-mass, low-temperature spectral standards at Solar age/composition, at lower gravities, and at subsolar metallicities. As explained in Kirkpatrick (2005), spectral types for these objects follow the form {metallicity class}+{temperature class}+{gravity class}, where
For the metallicity classes, d = dwarf, sd = subdwarf, esd = extreme subdwarf, and usd = ultra subdwarf. For the gravity classes, = field age and field gravity, with , , and marking objects with progressively lower gravities and younger ages (Cruz et al., 2009). The under temperature class is a gradation that generally ranges from 0 to 9.5 except for the Y dwarfs, for which the range currently runs only from 0 to 2.
For example, a normal field early-L dwarf might have a full spectral type of dL0; however, the d prefix and suffix are almost never appended for these Solar-composition and Solar-age objects so that the type can be written more simply as L0. A late-M subdwarf, which can be interpreted as an old object with subsolar metallicity, might be denoted by sdM9. An even lower metallicity late-T extreme subdwarf would be denoted as esdT8, and an even lower metallicity early-Y ultra subdwarf denoted as usdY0. Likewise, a solar-composition early-L exhibiting mild effects of lower gravity – generally interpreted as a sign of youth, as these objects have not yet contracted to their final equilibrium radii – might be denoted as L2. An even lower gravity and possibly even younger late-M-type brown dwarf might be denoted as M8, and an even lower gravity and possibly even younger mid-T denoted as T5.
Late-M, L, T, and Y dwarf spectral standards were taken from several sources. Standards with typical field age and field composition were taken from Kirkpatrick et al. (2010), who drew from late-M and L primary and secondary standards first established at optical wavelengths by Boeshaar and Tyson (1985), Kirkpatrick et al. (1991), and Kirkpatrick et al. (1999) and further drew from T dwarf spectral standards established in the near-infrared by Burgasser et al. (2006). The latter reference reached as cold as spectral type T8, but later near-infrared standards at types T9 were proposed by Cushing et al. (2011) and Kirkpatrick et al. (2012).
I.2 Brown Dwarf Atmosphere Panorama
The 0.75-5.0 m SPHEREx spectra of brown dwarfs have many features that can be used to study the physical and chemical conditions of their atmospheres. The H2O and CH4 absorption band strengths are a direct probe of temperature (Lodders and Fegley, 2002; Kirkpatrick et al., 2010). Carbon tracers – CH4, CO2, and CO – are thought to provide clues about vertical mixing and disequilibrium chemistry (Kothari et al., 2024); the C/O ratio itself is believed to hold clues about the brown dwarf’s formation pathway (Phillips et al., 2024). The main tracer of nitrogen – NH3 – can independently be used to study vertical mixing, although its presence is dwarfed by overlying bands of H2O and CH4 (Saumon et al., 2006; Cushing et al., 2011), and is unlikely to be detectable with SPHEREx. Another strong absorber is collision-induced absorption (CIA) by H2 centered at 2.1 m (Borysow, 2002), whose broad pressure-sensitive continuum opacity is a probe of the depth of the photosphere (Saumon et al., 1994). Figure 1 shows a representative SPHEREx spectrum with prominent features shaded by the dominant molecular opacity source at a given wavelength. The opacities are taken from the compiled PICASO opacity database (Batalha et al., 2019, and references therein). The spectrum is dominated by H2O, the main oxygen tracer, and CH4 up to the opacity window at 4.2 m, beyond which CO2 and CO become prominent.

I.3 SPHEREx
SPHEREx444https://spherex.caltech.edu, the Spectro-Photometer for the History of the Universe, Epoch of Reionization, and Ices Explorer (Bock et al., 2025), is a NASA medium explorer mission which has been in science operations since 1 May, 2025. SPHEREx is conducting an all-sky near-infrared spectral survey in 102 spectral channels spanning from 0.75 to 5 m with spectral resolution of 40 shortward of 4 m and 120 from 4 to 5 m. SPHEREx will survey the whole sky 4 times during its 25 month prime mission. In addition, SPHEREx observes deep fields in the north and south ecliptic poles, where sources are observed up to hundreds of times per spectral channel. The SPHEREx Science Team goals, from cosmology to ices in the Milky Way, are described in Bock et al. (2025). In the SPHEREx instrument, the focal plane is organized into two sides, both of which include 31 H2RG detector arrays (Korngut, P. et al., 2026). Each detector has been overlaid with a linear variable filter, providing sensitivity to a specific wavelength band, and covers 3.53.5 degrees on the sky with 615 pixels. The SPHEREx observations are a unique all-sky data set that is available at the NASA/IPAC Infrared Science Archive (IRSA)555https://irsa.ipac.caltech.edu.
I.4 Motivation
Before SPHEREx, survey characterization of brown dwarf atmospheres was largely enabled by the broadband near-infrared magnitudes from 2MASS at 1.1-1.36, 1.5-1.8, and 2-2.4 , with 5 depths of AB mag, and from WISE/AllWISE at – and –, with 5 depths of AB mag (Skrutskie et al., 2006; Wright et al., 2010). The combined 2MASS+WISE broadband SED therefore samples brown dwarfs at an effective photometric resolving power of only –. In comparison, SPHEREx achieves 5 per-exposure depths of 19.5 in the 0.7-3.8 range with R40, and 17.5-18.5 AB mag depths in the 3.8-5 range with R110.
With their higher sensitivity, increased spectral resolution, and wide wavelength grasp, SPHEREx spectra are uniquely well-suited for detailed atmospheric characterization of nearby brown dwarfs (2-30 pc, see Table 1). For these reasons, the SPHEREx spectral atlas represents the frontier of brown dwarf survey science. In particular, the poorly studied 3-5 m range encapsulates the main opacity features of CH4, CO2, and CO. These species are sensitive diagnostics of thermochemistry and composition, and so far only a handful of brown dwarfs have been observed at these wavelengths with JWST and AKARI. SPHEREx has now gathered the spectra of thousands of brown dwarfs (e.g., Gagné et al., 2026), with many new discoveries readily possible.
Another important and surprising application of SPHEREx specra is in cosmology, where Y-dwarfs can be mistaken for high-redshift galaxies due to their similar magnitudes and infrared colors. A recent such case of mistaken identity was pointed out in Bradač et al. (2026), where two high-redshift galaxy candidates turned out to be faint, distant brown dwarfs. Thanks to SPHEREx spectra, many instances of such contamination in galaxy surveys can be cleared up by comparing the object’s spectrum to representative templates. Conversely, these spectra may help identify extremely distant brown dwarfs in our galaxy in future surveys.
In this work, we present a curated sample of high-S/N SPHEREx spectra across the full gamut of brown dwarf temperature, gravity, and metallicity to directly compare state-of-the-art theoretical model grids, with the motivation of distilling the most relevant physics to inform the models’ continued improvement. Given that field brown dwarfs are in some ways simpler to model and observe than transiting exoplanets, adequately fitting their observables is imperative to improving the characterization of Jovian and lower mass worlds.
II Observations and Data Analysis
II.1 SPHEREx Pipeline
The SPHEREx science data processing occurs at the SPHEREx Science Data Center (SSDC) at Caltech-IPAC and by the SPHEREx Science Team. The SSDC performs the first three levels of processing, including astrometric and photometric calibrations, while the Science Team produces higher-level image and catalog products. The SSDC pipeline infrastructure is described in Akeson et al. (2025) and the individual pipeline modules are documented in the SPHEREx Explanatory Supplement666https://irsa.ipac.caltech.edu/data/SPHEREx/docs/SPHEREx_Expsupp_QR.pdf at IRSA.
For this work, we use calibrated Level-2 spectral image files from IRSA, with calibration version QR2. Given the sampling strategy employed by SPHEREx (Bryan et al., 2025), the exact spectral sampling is not uniform for each source. These calibrated images are the input for the Spectrophotometry Tool, one of the SPHEREx tools hosted by IRSA. This tool performs photometric measurements of selected sources using position and morphology information provided by the user. Here, we used proper motion corrected positions, specified that all sources are point-like, and used the tool version with the corrected point-spread function (PSF) (as of April 2026). The tool algorithm is based on the community software package Tractor777http://thetractor.org, which uses generative modeling of astronomical images to measure a maximum likelihood solution (Section 3.3 of the Explanatory Supplement). A local background is also calculated and subtracted. If the local region does not contain a sufficient number of unflagged pixels, a global solution is used. In addition to the source flux and uncertainty, a per point fit quality metric is calculated and flags from the image are propagated to the output. The spectra have spectral flux density units, , in Jy. At the time of writing, the spectral absolute gain calibration of SPHEREx has a quoted reliability of for Bands 1-4, and for Bands 5 and 6 in the QR2 data, which are used in this work. The gain calibration is currently being refined to a higher accuracy and reliability in Ashby, M., et al. (2026).
II.2 Target Selection Caveats
The low-gravity and low-metallicity sequences discussed in § III below (Table 1) are sourced entirely from the list of standards discussed in § I.1. Some of the standards for the Solar-age, Solar-metallicity sequence, however, have low S/N compared to other field dwarfs of the same type, have a relatively low number of measurements, or are known binaries, so we have chosen a replacement with the same optical and/or near-infrared spectral type from the 20-pc census of Kirkpatrick et al. (2024) (see Table 1). A few other standards were excluded because their PSF shapes were extended in WCS-aligned and stacked SPHEREx images compared to the SPHEREx PSF, they have obvious contaminators within 3 pixels of their centroid position, or they are known to be currently contaminated by a background object based on their proper motion trajectories (as seen in WiseView imagery888http://byw.tools/wiseview; Caselden et al. 2018). Unlike the spectral standards, these 20-parsec objects should not be used as anchors for the MK Process (Morgan et al. 1943) but should suffice to show the gross changes in spectral morphology through the sequence.
II.3 Data Cleaning
As SPHEREx spectrophotometric measurements can sometimes become affected by cosmic rays, satellite streaks, and Solar particle events, we use the bit-wise pixel quality flags from the Spectrophotometry Tool to apply strict quality cuts to the data. All fluxes with any flag listed in Table 9 of the Explanatory Supplement (other than SOURCE) are excluded to conservatively ensure the cleanliness of the spectra. Visual spot-checks suggest that a poor quality flag does not always reflect an anomalous measurement, and some anomalous measurements do not get flagged, meaning that some objects will show occasional spurious fluxes. There is a known under-flagging of bad pixels in the early data releases, which have since been corrected (as of Dec. 2025). The flagging update was not applied retroactively, so at least half of the observations in this work are subject to underflagging. We remove spurious points by masking fluxes that lie more than 4- away from the smoothed running median of the data.
III Spectral Sequences
In this section, we present our distinct field, low-gravity, and low-metallicity sequences. The field objects are summarized in Table 1, the low-gravity in Table 2, and the low-metallicity in Table 3.
| Spec. Type | Name | Dist. (pc) | Ref. | Standard? | Note |
|---|---|---|---|---|---|
| L0 | 2MASS J17312974+2721233 | 2 | No | A | |
| L1 | 2MASS J21304464-0845205 | 1 | Yes | ||
| L2 | 2MASS J21041491-1037369 | 2 | No | B | |
| L3 | 2MASS J15065441+1321060 | 2 | Yes | ||
| L4 | 2MASS J21580457-1550098 | 1 | Yes | ||
| L5 | 2MASS J15074769-1627386 | 2 | No | C | |
| L6 | 2MASS J10101480-0406499 | 3 | Yes | ||
| L7 | 2MASS J03400942-6724051 | 2 | No | D | |
| L8 | 2MASS J16322911+1904407 | 4 | Yes | ||
| L9 | DENIS J025503.3-470049 | 2 | Yes | ||
| T0 | PSO J319.3102-29.6682 | 4 | No | ||
| T1 | WISE J124629.65-313934.2 | 2 | No | E | |
| T2 | 2MASS J11220826-3512363 | 2 | No | F | |
| T3 | PSO J247.3273+03.5932 | 3 | No | ||
| T4 | 2MASS J22541892+3123498 | 6 | Yes | ||
| T5 | WISE J004542.56+361139.1 | 3 | No | G | |
| T6 | DENIS J081730.0-615520 | 2 | No | H | |
| T7 | 2MASS J03480772-6022270 | 7 | No | I | |
| T8 | 2MASS J04151954-0935066 | 8 | Yes | ||
| T9 | WISE J000517.48+373720.5 | 3 | No | J | |
| Y0 | WISE J205628.91+145953.2 | 3 | No | K | |
| Y1 | WISE J154151.65-225024.9 | 3 | No | L | |
| Y2?aaStandards have not yet been established at types later than Y1, so these classifications should be considered tentative. | WISE J182831.08+265037.7 | 3 | Yes | ||
| Y4?aaStandards have not yet been established at types later than Y1, so these classifications should be considered tentative. | WISE J085510.83-071442.5 | 3 | Yes |
Note. — Reference codes for astrometry: (1) Gaia DR3; (2) Gaia EDR3; (3) Kirkpatrick et al. 2021a; (4) Dahn et al. 2017 + CatWISE 2020; (5) Best et al. 2020; (6) Manjavacas et al. 2013 + CatWISE 2020; (7) Kirkpatrick et al. 2019; (8) Dupuy and Liu 2012. Notes: (A) The L0 standard, 2MASS J03454316+2540233, has much lower S/N than the L0 listed. (B) The L2 standard, Kelu-1 AB, is a known binary. (C) The L5 standard, 2MASS J08350622+1953050, has much lower S/N than the L5 listed. (D) The L7 standard, 2MASS J01033203+1935361, has much lower S/N than the L7 listed. (E) The T1 standard, WISE J083717.17-000020.0, has much lower S/N than the T1 chosen. (F) The T2 standard is 2MASS J12545393-0122474. (G) The T5 standard, 2MASS J15031961+2525196, has poorer SPHEREx spectral coverage than the T5 listed. (H) The T6 standard, 2MASS J16241436+0029158, has poorer S/N and spectral coverage than the chosen T6. (I) The T7 standard, 2MASS J07271824+1710012, has poorer spectral coverage than the T7 listed. (J) The T9 standard, UGPS J072227.51-054031.2, has possible contamination in SPHEREx since it lies deep within the Galactic Plane. (K) The Y0 standard, WISE J173835.53+273259.0, has poorer S/N than the Y0 listed. (L) The Y1 standard, WISE J035000.32-565830.2, has poorer S/N than the Y1 listed.
Note. — The listed spectral types are all near-infrared classifications except for the L3, L6, L8, and T3, whose classifications were done in the optical.


| Spec. Type | Name | Dist. (pc) | Astrometry Ref. | Standard? | Note |
|---|---|---|---|---|---|
| L0 | 2MASS J00325584-4405058 | Gaia DR3 | Yes | ||
| L0 | 2MASS J15525906+2948485 | Gaia DR3 | Yes | ||
| L0 | 2MASS J03454316+2540233 | Gaia DR3 | Yes | ||
| L5 | 2MASS J03552337+1133437 | Gaia EDR3 | Yes | ||
| L5 | 2MASS J04210718-6306022 | Kirkpatrick2021a | Yes | ||
| L5 | 2MASS J08350622+1953050 | CatWISE2020 | Yes |
Note. — The low-gravity objects above are as defined by Cruz et al. (2009). The listed spectral types are all optical classifications except for the L5, whose classification was done in the near infrared.

| Spec. Type | Name | Dist. (pc) | Astrometry Ref. | Standard? |
|---|---|---|---|---|
| esdL0 | 2MASS J00144919-0838207 | Gaia DR3 | Yes | |
| sdL0 | 2MASS J01301256-1047285 | Gaia DR3 | Yes | |
| L0 | 2MASS J03454316+2540233 | Gaia DR3 | Yes | |
| usdL0 | 2MASS J10130734-1356204 | Gaia DR3 | Yes | |
| esdL7 | 2MASS J05325346+8246465 | Gaia DR3 | Yes | |
| L7 | 2MASS J03400942-6724051 | Gaia EDR3 | Yes | |
| sdL7 | 2MASS J14162408+1348263 | Gaia EDR3 | Yes |
Note. — The low-metallicity objects above are as defined by Zhang et al. (2017). The listed spectral types are all near-infrared classifications except for the L0, whose classification was done in the optical.
III.1 Qualitative Description
The brown dwarf spectral sequence is mostly carved by the temperature-sensitive bands of H2O, CH4, CO, CO2, and the opacity windows between them (Fig. 2). Across the field-type L dwarfs, the onset of CH4 becomes visually apparent for objects later than L4, appearing initially as a downward concavity from 3-3.6 m, then completely dominating the blue side of the 4m opacity window all the way through the cooler sequence. CH4 and H2O opacity similarly sculpts the shapes of the NIR J/H/K opacity windows, making them sharper at progressively colder temperatures, and introducing a narrow absorption feature at 1.15 m. When plotted with flux (Jy) on the vertical axis, the relative heights of the J- and K-band peaks (1.3, 2.2 m) begin to reverse at the L/T transition, with the K-band peak falling below the H-band peak (1.6 m) at subtype T0. The H-band peak eventually becomes shorter than the J-band peak at subtype T4. In the mid-IR, CO2 and CO become increasingly apparent beyond subtype L3, with growing absorption notches at 4.15-4.3, and 4.4-4.9 m, respectively. The fundamental vibration band of the CO band is visible as a subtle peak at 4.67 m that appears at subtype L4 and persists through the rest of the sequence. The opacity window near 4 m shifts redward for the late-T and Y dwarfs due to the saturation of the CH4 opacity band, and the declining CO abundance with decreasing temperature. The prominence and sharpness of the 4 m window peak are maximized at the L/T transition, where CH4 and CO opacity together sandwich the peak of the emergent flux.
The low-gravity sequence for subtypes L0 and L5 is shown in Fig. 3. The most noticeable trend with decreasing gravity is the slope from 0.75-1.2 m, which becomes less steep. The L5 object 2MASS J08350622+1953050 shows relatively low-amplitude water features alongside a more clearly defined continuum level, indicative of a more isothermal atmosphere. The field-gravity L5 shows water feature amplitudes roughly 4 times stronger than the equivalent. Furthermore, with decreasing gravity, the height of the 2.2 m flux peak grows by tens of percent relative to the 1.6 m peak.
The low-metallicity sequence for subtypes L0 and L7 is shown in Fig. 4. Decreasing metallicity at a fixed subtype imparts a drastic change in the appearance of the NIR region, showing a reversal in the relative heights of the opacity windows at 1.3 and 2.2 m. For both subtypes, the flux ratios of these features range from 0.5 for the field objects to 2.5 for the esd objects. This change is leveraged for spectral metallicity classification, and is attributed to the onset of H2-H2 pressure-broadened collisionally-induced absorption opacity (CIA). Namely, as the metallicity and therefore opacity of the atmosphere declines, the photosphere moves deeper to higher pressures where the broad continuum H2-H2 CIA feature becomes a dominant opacity source from 1.7-3 m.
IV Model Grids
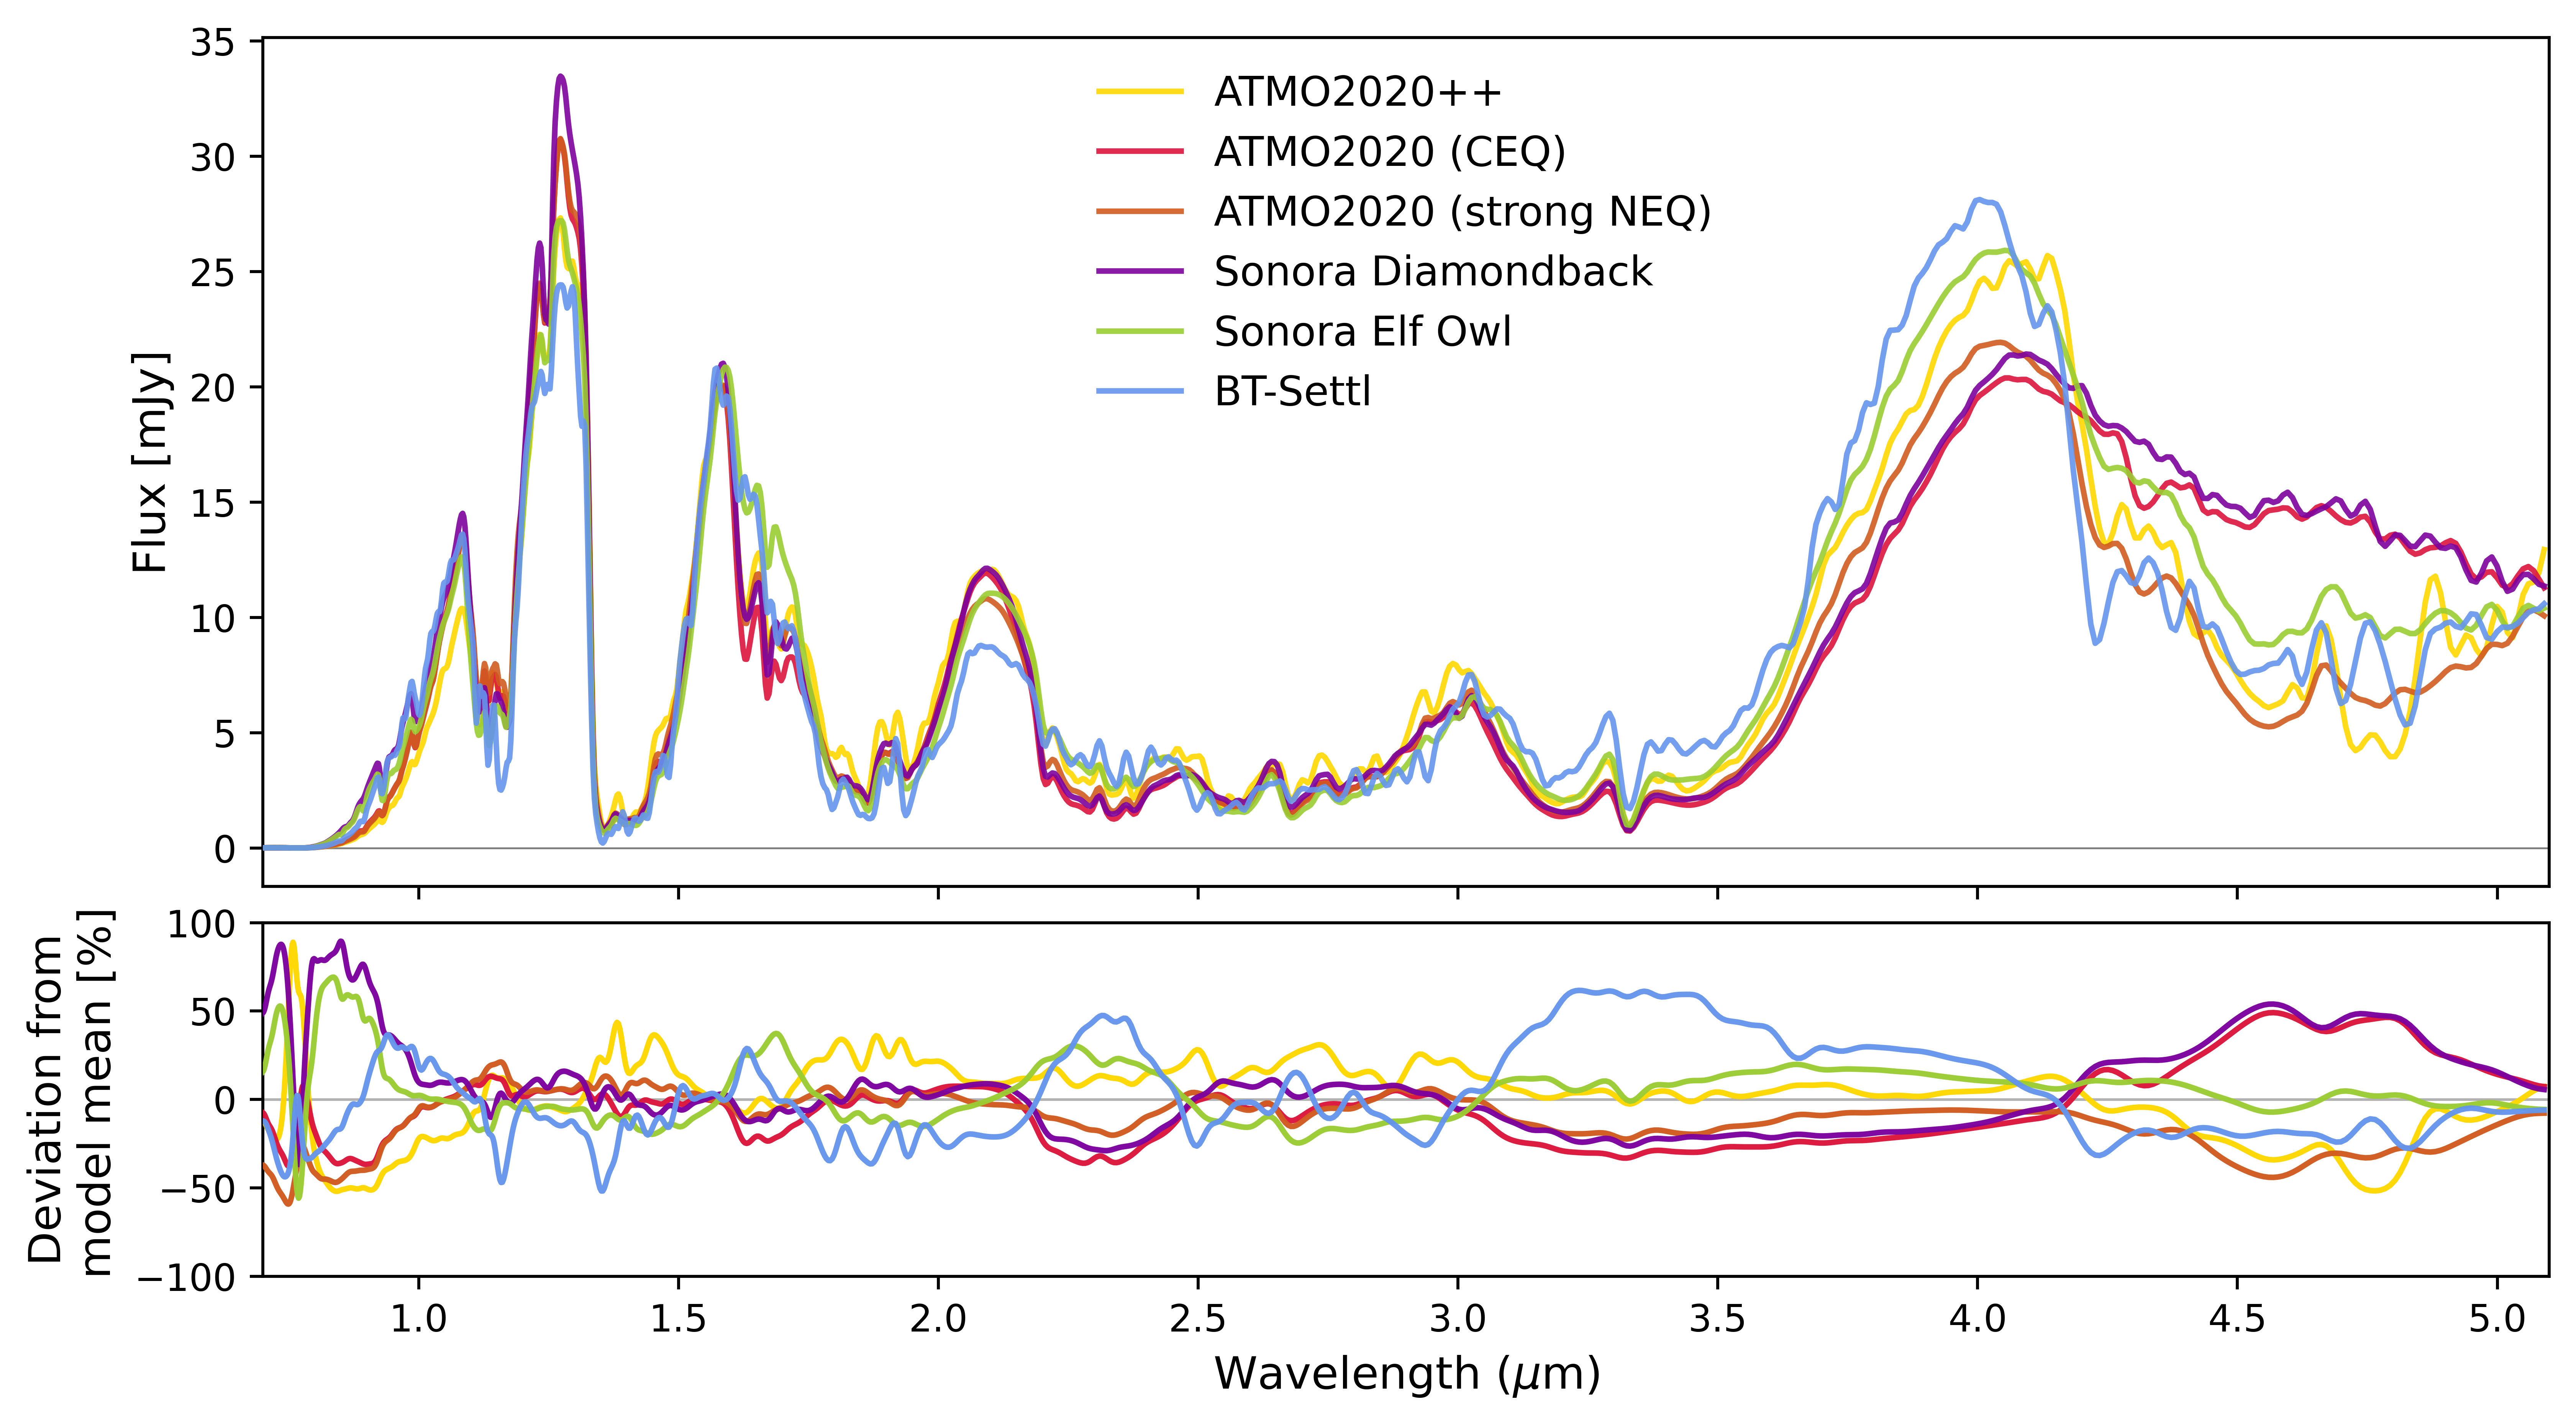
We compare the observed spectra to five separate state-of-the-art model grids (see Table 4), each of which emphasizes different aspects of the thermochemistry, and includes or omits clouds. The grids are mostly spaced by 100 K in and 0.5 in log(), with other variables changing by grid. These models emerge from an enormous variety of subjectively chosen input assumptions that govern the coupled composition, thermodynamics, and radiative transfer of each atmosphere. The selected molecular and continuum opacity databases, equations of state, atomic abundances, chemical reaction rates, thermodynamic coefficients, optical constants, convective mixing length scales—and the computational schemes connecting them—vary greatly from model to model. As we show in Fig. 5, even grid models with the same input temperature, gravity, and metallicity show relative flux differences as high as 2 at some wavelengths due to their different handling of chemistry. The models differ the most in the thermochemistry-sensitive 3-5 m region covering the features of CO, CH4, and CO2. Given that they have more differences than similarities, each grid represents a valiant independent attempt at emulating the delightfully complex atmospheres of brown dwarfs. The aim of our comparison is not to rank their relative “quality” or “truthfulness” but rather to see which input assumptions and parameters correlate with poor agreements between observations and models.
Each grid reports its spectra in different units. We convert each model to the spectral flux density , which is the luminosity per wavelength emerging from a square meter of the object’s photosphere. These flux densities are then rescaled by the scaling factor
| (1) |
where is the radius, and is the measured distance to the object. We finally bring the model units to the Jy units of the SPHEREx observations
| (2) |
where and are the wavelength and speed of light, respectively.
The following subsections describe each model grid in broad terms. Table 4 summarizes their key attributes, including their treatment of clouds and chemistry, their temperature ranges, native resolving power in the SPHEREx bandpass, and the other parameter dimensions. For more detailed descriptions of each model, the reader is referred to the first reference of each subsection, and the references within.
| Grid | Cloud Treatment | Chemistry | (K) | Varied Parameters | models | |
|---|---|---|---|---|---|---|
| ATMO2020++ | Cloud-free | Non-eq. | 200–1200 | , , | 3,000 | 299 |
| ATMO2020 | Cloud-free | Eq., non-eq. | 200–3000 | , , chem. mode | 1,000 | 510 |
| BT-Settl | Microphysical (Rossow) | Eq. | 400–2400 | , | 8,000 | 106 |
| Sonora: Elf Owl | Cloud-free | Non-eq. | 275–2400 | , , , C/O, | 60,000 | 43,252 |
| Sonora: Diamondback | Sedimentation () | Eq. | 900–2400 | , , , | 200,000 | 1,440 |
IV.1 ATMO2020
ATMO2020 (Phillips et al., 2020) is a coupled atmosphere-interior evolution grid computed at Solar metallicity using the state-of-the-art ATMO 1D radiative-convective equilibrium code. The models span 200-3000 K in 50-100 K intervals, and log() 2.5-5.5 in steps of 0.5 dex. This grid includes non-equilibrium chemistry, and parametrizes the vertical diffusion coefficient with a power-law gravity dependence () to impose a constant dynamical timescale for objects of different mass. In addition to including chemical equilibrium models where the timescale for chemical equilibration is infinitesimal, they compute strong and weak non-equilibrium chemistry models, corresponding to and cm s-2 at log() = 4.5, respectively. These values were selected following the finding of Leggett et al. (2017) that this range of vertical mixing best matches the (Spitzer Ch. 2 minus M’ band) colors of late T- and Y-dwarfs at the same fixed gravity. As seen in Figs. 7 and 8 of that work, none of the several plotted model grids successfully predict the color-magnitude behavior across the full LTY span, with systematic departures on the order of 1-2 magnitudes. The models are downloaded from the ERC Opendata server999https://noctis.erc-atmo.eu/sharing/zyU96xA6o.
IV.2 ATMO2020++
The ATMO2020++ model grid (Leggett and Tremblin, 2024) targets late T and Y dwarfs (250-1200 K), and includes a disequilibrium chemistry scheme with a fixed vertical mixing diffusion coefficient of cm s-2. This grid also uniquely computes a diabatic thermal profile in place of the usual adiabatic assumption, to better account for the disruption of convection by the observed rapid rotation of real brown dwarfs. This results in a cooler lower atmosphere, and a warmer upper atmosphere. Leggett and Tremblin (2023) find that this grid better replicates the spectra of late-type brown dwarfs as measured by JWST. The grid is spaced by 25 K from 225 to 350 K, by 50 K from 350 to 450 K, and 100 K onward. The model log-gravity is spaced by 0.5 dex, and ranges from 2.5 to 5.5, which corresponds to a mass range of 0.12 to 120 Jupiter masses, assuming a Jupiter radius. The models are computed with metallicities of [Fe/H] = -0.5, 0.0, and 0.3. We download the full grid from the ERC Opendata server101010https://noctis.erc-atmo.eu/sharing/9puhIZma2.
IV.3 BT Settl
The BT-Settl model grid is computed with the PHOENIX code, and includes a sophisticated parameter-free treatment of cloud formation and settling with vertical mixing (Allard et al., 2012, 2013; Allard, 2014). The radiative-convective equilibrium model self-consistently computes the condensation of 55 optically active condensible species that contribute to a vertical grain size distribution profile informed by separate timescales for nucleation, condensation, and settling. These timescales are derived from more sophisticated 3D hydrodynamics (Freytag et al., 2010) and cloud microphysics (Rossow, 1978) models. BT-Settl uses the now-outdated water opacities of Barber et al. (2006). Despite this, the grid closely reproduces the colors of stars, and also matches the bottom of the Main Sequence as it connects to the L dwarfs. We download the AGSS2009 400-2400 K, log() 3-5.5 Solar metallicity models from the SVO Theory Server 111111svo2.cab.inta-csic.es/theory/newov2/index.php?models=bt-settl-agss.
IV.4 Sonora Diamondback
The Sonora Diamondback coupled atmosphere-interior evolution grid (Morley et al., 2024) includes clouds parameterized using the mass-balance approach of (Ackerman and Marley, 2001). The radiative-convective equilibrium models are computed using the approach of Saumon and Marley (2008) (and references therein). The parameter is held constant with height and encodes the cloud sedimentation efficiency, with small values resulting in thick clouds. The models incorporate the Mie scattering absorption coefficients of the amorphous form of 4 cloud species: MgSiO3, Mg2SiO4, Fe, and Al2O3. These are identified as the main contributors of aerosol opacity. The gradual contraction and cooling of the model interior is coupled to the thermal structure of the atmosphere: when a model atmosphere cools below 1300 K, the clouds suddenly clear, resulting in a brief stalling of the brown dwarf’s cooling and a brief acceleration in its contraction (e.g. Fig. 14 and 15, Morley et al., 2024). This theoretical prediction is seen as a local occurrence rate maximum in the observed population of brown dwarfs at the L/T transition (e.g., Fig. 17 of Kirkpatrick et al., 2024); (e.g., Fig. 13 of Saumon and Marley, 2008). Infrared spectroscopy across the transition with Spitzer shows a similar clearing of the clouds, with rapidly rising below 1300 K and with fits preferring cloud-free models (e.g. Stephens et al., 2009). The Diamondback grid also includes cloud-free models, which show a lack of the distinctive evolutionary radius “bump.” While the models impose chemical equilibrium, they include the effect of vertical mixing via the vertical eddy diffusion coefficient varies with height and is computed using mixing length theory, without including as a free parameter (like Elf Owl). The Diamondback grid ranges from 900 to 2400 K, 3.5-5.5 in log(), with spanning 1-8, and is computed at Solar, +0.5, and -0.5 metallicity. We download Version 2 of the full grid from Zenodo121212https://zenodo.org/records/12735103.
IV.5 Sonora Elf Owl
The Sonora Elf Owl model grid (Mukherjee et al., 2024) is built using the same opacity database and a similar modeling approach to the Diamondback grid, but with an updated python-based implementation (Mukherjee et al., 2023). Unlike Diamondback, Elf Owl includes non-equilibrium chemistry due to vertical mixing, as governed by the fixed vertical mixing coefficient . Also unlike Diamondback, these atmosphere models are strictly cloud-free, and do not couple to an interior evolution scheme. The grid spans a wider range of temperatures than Diamondback, 275-2400 K, with a fine, 25 K spacing at the cold end. The strength of non-equilibrium chemistry governs the relative strengths of the carbon-bearing species in the mid-IR, with the CO/CH4 and CO2/CH4 ratios varying by two orders of magnitude across the span of considered log() values (2-9) for a 700 K object. The resulting effect is a factor of 2 flux difference in the carbon-rich 4.1-4.9 m region. The spread in metallicity has a similarly pronounced effect on the spectra in the same CO/CO2 region, and shows a strong influence on the flux window at 2.2 m, corresponding to the broadband continuum opacity of H2-H2 collisional absorption. The relative strengths of the carbon features are not only sensitive to the vertical mixing and metallicity of the atmosphere, but also the carbon-to-oxygen ratio, which spans values of 0.5 (sub-Solar) to 2.5 (greatly enhanced) in the grid. The Elf Owl grid therefore represents an important early foray into disentangling the competing effects of non-equilibrium chemistry and composition. Future Sonora grids will additionally include clouds alongside non-equilibrium chemistry. We download the latest version of the full grid from Zenodo131313https://zenodo.org/records/15150881.
V Spectral Fitting
We compare each measured spectrum to the ensemble of models, binning the models to the SPHEREx wavelength channels. We bin the models by taking the mean of the model flux values bounded by the bandwidth of each spectral measurement. Given the proximity of these objects, we neglect extinction by the interstellar medium. The stellar radius is fitted as a free parameter, while the distance is fixed to the central value of the distance measurement (see Eq. 1). The distance uncertainty is propagated through the radius uncertainty. The SPHEREx science team has examined repeat measurements of stable calibrators in the deep fields at the same wavelengths, which suggest a typical visit-to-visit RMS scatter of 3 (SPHERE Science Team, private comm.). This term will be added in later data processing, but we add it here in quadrature with the original flux uncertainties. In addition to estimating goodness-of-fit with , we compute the statistic as defined in Eq. 1 of Cushing et al. (2008), which weighs the information content of a spectral channel in proportion to its wavelength width. Given that the SPHEREx spectra vary from R40 in the NIR to R110 in the mid-IR, the statistic prevents the narrower and lower-S/N channels from dominating the fits. We do not include the number of fitted grid variables in our goodness-of-fit estimates, since the goal is not to compare the different grids. Also, since the number of fitted points is in the hundreds to thousands, the effect of adding a couple of free parameters to the denominator is negligible.
The coarse nature of model grids makes for jagged, discretized fit posteriors which do not approximate a normal distribution. In this work, we intentionally restrict our model fits to the original parameter grid points rather than generating continuous posteriors through interpolation in , , [Fe/H], or cloud and chemistry parameters, as is common in the field. As a result, we do not quote formal uncertainties on the best-fitting parameters. The grids are coarsely sampled, with typical spacings of K, dex, and dex. In practice, brown dwarf spectra can vary nonlinearly over comparable scales, especially near the L/T transition where cloud properties, vertical mixing, and chemistry change rapidly. Even sophisticated Bayesian fitting frameworks that account for interpolation uncertainties and correlated model residuals struggle to reconcile the temperatures, radii, metallicities, and gravities of well-studied benchmark objects, often finding systematic differences that are larger than the grid spacings (e.g., Zhang et al., 2021). Using their interpolated Bayesian grid fitting approach, they find offsets on the order of 1.3 dex in and 0.4 dex in [Fe/H] for well-understood benchmark objects, which is much larger than the spacing of their grids. With their “traditional” interpolated grid-fitting approach, they report similar offsets, with uncertainties that are questionably 10 or even 100 times smaller than the grid spacing. Alternatively, sophisticated atmospheric retrievals with flexible atmospheric profiles (e.g., Line et al., 2017; Lothringer et al., 2024) produce true posteriors and covariances, but are beyond the scope of the present work. Therefore, to avoid constructing posteriors with assumptions of the subgrid behavior, and to avoid imposing additional and unjustified systematics, we elect to instead report the best-fitting 10 of native models for each grid, and leave a more sophisticated model fitting analysis for a future study. These best-fitting model parameters along with their goodness-of-fit are included in a machine-readable table, which one may interpolate if they wish to derive sub-grid best-fit parameters and confidence intervals.
A handful of selected spectral fits are shown below, in Figures 6, 7, 8, 10, 11, and 12. The figure legends report the temperature, , radius scaling, metallicity, and gravity for each best-fit model. For the Diamondback and Elf Owl models, the legends also report the model’s and log(), respectively.
The color image in each figure’s inset is a median shift-aligned and distortion-corrected stack 2.5’ x 2.5’ of all available SPHEREx images centered on the target. The blue color channel is assigned to the median of Bands 1 and 2, green assigned to the median of Bands 3 and 4, and red assigned to the median of Bands 5 and 6. The images are aligned to the celestial coordinate grid, with North pointing up and East pointing left.
None of the model grids stand out with exceptional fit quality, with 10 for the majority of spectra with high S/N. In this regime, the best-fit model parameters do not necessarily reflect the true properties of the object. In the next section, we attempt a different approach at comparing the behavior of the models to the observed sequence.


V.1 Model Intercomparison
Population studies of brown dwarfs and exoplanets using the 2MASS/WISE filters, and post-cryo Spitzer/IRAC observations have been conducted (e.g., Patten et al., 2006; Baxter et al., 2021; Sanghi et al., 2023), but these broadband filters do not have the resolution or placement to identify individual chemical features, and therefore fail to distill the chemistry information. To leverage the wavelength and spectral type coverage of SPHEREx, and to better identify specific model deficiencies, we define a set of custom spectral indices corresponding to the thermochemically sensitive carbon species in the 3-5 m range. We define three wavelength ranges centered on the most prominent absorption features of CH4, CO2, and CO, and compute their magnitudes normalized relative to the universally prominent 4 m opacity window, which lands between fundamental water absorption bands and encapsulates a region of declining CH4 opacity. The magnitude of a given index species Mi is given by
| (3) |
where is the mean of the in-band flux, and is the mean of the reference or normalization region. The magnitude uncertainties are given by
| (4) |
where and are the quadrature-summed flux uncertainties within the respective bands. We select the spectral indices visually, using the high-S/N spectrum of the T6 DENIS J081730.0-615520, and the opacity ranges in Fig. 1 to place the region boundaries (see Table 5 and Fig. 13). We find that using narrower ranges does not necessarily improve the color contrast or the strengths of the trends, but does hurt the SNR of the measurements. These regions are somewhat contaminated by overlapping molecules, making them imperfect chemical indicators. Indeed, the lack of a clean continuum baseline flux level in any wavelength region makes brown dwarf spectra a challenge to interpret.
| Index | Feature region (m) | Norm. region (m) |
|---|---|---|
| CH4 | 3.20–3.65 | 3.70–4.14 |
| CO2 | 4.18–4.35 | 3.70–4.14 |
| CO | 4.55–4.80 | 3.70–4.14 |
We next compute the same chemical indices for each model grid as a function of temperature, at a fixed log() of 5, and compare the grids to the models in Figures 14 and 15, showing CO and CO2 as a function of CH4 strength, respectively. Higher values of the indices generally correspond to stronger absorption by that molecule, and this is made apparent by the trend of increasing CH4 index with later spectral subtypes. Each spectral subtype is labeled, and the grid model temperatures are sparsely labeled to minimize visual crowding. The Y-dwarfs are excluded from these figures due to their low SNR in the CH4 band, which is undetected by SPHEREx.
The sequence of observed field brown dwarfs shows fairly continuous and smooth behavior, with the spectral types increasing nearly monotonically from left to right. The Elf Owl models are shown with weak and strong vertical mixing (dashed and solid green lines, respectively), and the Diamondback models are similarly shown with and without clouds (solid and dashed purple lines, respectively). Two chemistry variants of ATMO 2020, chemical equilibrium and strong non-equilibrium, are shown as light and dark orange lines, respectively.


VI Discussion
While no grid matches spectra across the sequence, all of them qualitatively capture the general trend of CO and CO2 with CH4 abundance, showing a gradual rise from subtype L0 through T3 (2300-1200 K), and then rapidly descending by 1.5 magnitudes for the cooler, CH4-dominated objects (Fig. 14, Fig. 15). The CO2 index trend is similar in shape, with a maximum at subtype T5 (1000 K), though the models tend to under-predict the strength of the CO2 feature for the L dwarfs (Fig. 15). The Elf Owl models with weaker vertical mixing (log = 4) much more closely match the observations than the models with stronger mixing (log = 8). The same is seen for the ATMO2020 models, with the data aligning more with the stronger non-equilibrium chemistry model line. The T dwarfs show a CO dropoff of a similar magnitude to the Elf Owl low and ATMO2020 strong non-equilibrium (NEQ) models, while the earlier T and L dwarfs veer more toward the equilibrium models. The addition of clouds to the Diamondback models results in worse agreement in the CO index, and none of the models are able to match the strength of the CH4 feature for objects later than T7. The CO magnitudes of the mid-T dwarfs appear well-represented by the Elf Owl (low ), ATMO2020 (weak NEQ), BT-Settl, and ATMO2020++ model grids alike, and this is corroborated by the relatively good fit statistics for these objects.
The observed CO/CH4 sequence appears to qualitatively lie along a smooth, curved trend line, with deviations on the order of 0.2 mag. The relatively monotonic progression of spectral type with CH4 index, and the fairly regular spacing along this axis, indicates that CH4 opacity varies smoothly with temperature, or more tautologically that it dominates the spectral classification. The lack of stochasticity may be an indication that either our sample size is too small or well-curated to see much astrophysical scatter, or that the chemical trends are relatively robust against individuality, following a well-traveled path in chemistry/cooling space. More objects with well-defined spectral subtypes are needed to comment on this empirical observation. The recent works of Gagné et al. (2026), Brooks et al. (2026), and Tu et al. (2026) present other sequences of SPHEREx brown dwarf spectra. The studies of Brooks et al. (2026) and Gagné et al. (2026) show similar broad H2O, CO, CO2, and CH4 morphology across ultracool spectral types, and the sample of Tu et al. (2026) also quantitatively recovers smooth molecular-index trends and a CO/CO2 turnover near 1000 K.
Lastly, the wide range of parameter space explored by Elf Owl gives a unique opportunity to test their observability and crosstalk. In Fig. 16 of the Appendix, we show the CH4 index against COCO2 for one-parameter slices through the Elf Owl grid to test the coupling of the carbon chemistry in the grid. COCO2 captures the relative behavior of the two carbon-oxygen species, which are chemically linked to CH4 through the temperature-, metallicity-, and mixing-dependent partitioning of carbon among CO, CO2, and CH4 (e.g., Fortney et al., 2020; Sing et al., 2024). The figure shows the same spectral sequence across varying vertical mixing, gravity, metallicity, and C/O ratio. Changing the vertical mixing and metallicity parameters results in the most COCO2 variance at a fixed CH4 index. Namely, increasing the vertical mixing from weak (log() = 2) to Jupiter-like (log() = 7) at SOolar metallicity results in 0-, 0.5-, and 1-dex differences in COCO2 for L’s, mid-T’s and late-T’s, respectively. A population-wide study of T dwarf carbon chemistry shows that they have log() = 5 - 8, which is higher than the log() = 2-4 values inferred from the plot. At Solar metallicity, the COCO2 remains roughly constant, with just 0.5-dex of variation across the sequence. However, at a wider range of modeled [M/H] values, the models overlap at constant CH4 index, making the COCO2 index degenerate in the interpretation of atmospheric metallicity. C/O ratio and log() contribute a further 0.5-dex of scatter, each. The fact that none of the Elf Owl cross-cuts seem to reproduce the sequence suggests that either our sample of objects spans a gradient in composition and thermochemistry, or that the imperfect spectral fits are due to some inherent model deficiency causing the indices to be poor representations of the chemical trends. Above all, the Fig. 16 shows that the chemistry-sensitive carbon species map a complex and degenerate space, and that future population-level inferences will require other thermochemical signatures, such as the NIR water features, to break these degeneracies.
VII Conclusion
In this work, we have presented 37 SPHEREx spectra of the nearest and highest-S/N L0-Y4 brown dwarfs spanning the full range of spectral subtypes (Fig. 2). As SPHEREx continues mapping the sky, these spectra will grow in S/N with the growing spectral sampling density, enabling more detailed investigations of their chemistry and variability. However, even the first-epoch SPHEREx spectra analyzed here reveal that state-of-the-art brown dwarf model grids generally fail to trace their complex features, meaning that our understanding of their nature is limited by model systematics rather than observational uncertainty. By examining the sequence through the lens of the thermochemically active species, which are now readily accessible with SPHEREx, we show that the models generally approximate the smoothly coherent abundance trends of CO and CO2 as they are converted to CH4 with declining temperature and increasing age. We also show that the addition of clouds does not improve Diamondback model fits (see Figs. 14 and 15), especially at the cloudy L/T transition (see Fig. 7), implying the need for more theoretical work connecting clouds with chemistry. Optimistically, the models seem to qualitatively represent the low-gravity and low-metallicity L dwarfs (see Fig. 17, 18, 19, and 20, which probe a more extreme regime of parameter space. Future observational studies with expanded statistical samples will closely explore empirical trends with luminosity and age, while other works will attempt to decipher the competing effects of vertical mixing, metallicity, and bulk composition.


References
- Precipitating Condensation Clouds in Substellar Atmospheres. ApJ 556 (2), pp. 872–884. External Links: Document, astro-ph/0103423 Cited by: §IV.4.
- The SPHEREx Image and Spectrophotometry Processing Pipeline. arXiv e-prints, pp. arXiv:2511.15823. External Links: Document, 2511.15823 Cited by: §II.1.
- Progress in modeling very low mass stars, brown dwarfs, and planetary mass objects.. Memorie della Societa Astronomica Italiana Supplementi 24, pp. 128. External Links: Document, 1302.6559 Cited by: §IV.3.
- Models of very-low-mass stars, brown dwarfs and exoplanets. Philosophical Transactions of the Royal Society of London Series A 370 (1968), pp. 2765–2777. External Links: Document, 1112.3591 Cited by: §IV.3.
- The BT-Settl Model Atmospheres for Stars, Brown Dwarfs and Planets. In Exploring the Formation and Evolution of Planetary Systems, M. Booth, B. C. Matthews, and J. R. Graham (Eds.), IAU Symposium, Vol. 299, pp. 271–272. External Links: Document Cited by: §IV.3.
- Absolute Flux Calibration of the Spectro-Photometer for the History of the Universe, Epoch of Reionization, and Ices Explorer (SPHEREx) Mission. in prep.. Cited by: §II.1.
- Evolutionary models for cool brown dwarfs and extrasolar giant planets. The case of HD 209458. A&A 402, pp. 701–712. External Links: Document, astro-ph/0302293 Cited by: §I.
- A high-accuracy computed water line list. MNRAS 368 (3), pp. 1087–1094. External Links: Document, astro-ph/0601236 Cited by: §IV.3.
- Exoplanet Reflected-light Spectroscopy with PICASO. ApJ 878 (1), pp. 70. External Links: Document, 1904.09355 Cited by: §I.2.
- Evidence for disequilibrium chemistry from vertical mixing in hot Jupiter atmospheres. A comprehensive survey of transiting close-in gas giant exoplanets with warm-Spitzer/IRAC. A&A 648, pp. A127. External Links: Document, 2103.07185 Cited by: §V.1.
- Precise Bolometric Luminosities and Effective Temperatures of 23 Late-T and Y Dwarfs Obtained with JWST. ApJ 973 (2), pp. 107. External Links: Document, 2407.08518 Cited by: §I.
- The SPHEREx Satellite Mission. arXiv e-prints, pp. arXiv:2511.02985. External Links: Document, 2511.02985 Cited by: §I.3.
- New limits on the surface density of M dwarfs. I. Photographic survey and preliminary CCD data.. AJ 90, pp. 817–822. External Links: Document Cited by: §I.1.
- Collision-induced absorption coefficients of H2 pairs at temperatures from 60 K to 1000 K. A&A 390, pp. 779–782. External Links: Document Cited by: §I.2.
- Two exciting high-redshift galaxy candidates turn out to be two exciting ultra-cool brown dwarfs. External Links: 2604.23668, Link Cited by: §I.4.
- An ultracool dwarf spectral sequence using spherex. Research Notes of the AAS 10 (4), pp. 94. External Links: Document, Link Cited by: §VI.
- Optimized observation sequencing in low-earth orbit with the spherex survey planning software. External Links: 2508.20332, Link Cited by: §II.1.
- A Unified Near-Infrared Spectral Classification Scheme for T Dwarfs. ApJ 637 (2), pp. 1067–1093. External Links: Document, astro-ph/0510090 Cited by: §I.1.
- Observation of undepleted phosphine in the atmosphere of a low-temperature brown dwarf. Science 390 (6774), pp. 697–701. External Links: Document, 2510.03916 Cited by: §I.
- A Nongray Theory of Extrasolar Giant Planets and Brown Dwarfs. ApJ 491 (2), pp. 856–875. External Links: Document, astro-ph/9705201 Cited by: footnote 3.
- The theory of brown dwarfs and extrasolar giant planets. Reviews of Modern Physics 73 (3), pp. 719–765. External Links: Document, astro-ph/0103383 Cited by: §I.
- WiseView: Visualizing motion and variability of faint WISE sources Note: Astrophysics Source Code Library, record ascl:1806.004 External Links: 1806.004 Cited by: §II.2.
- Young L Dwarfs Identified in the Field: A Preliminary Low-Gravity, Optical Spectral Sequence from L0 to L5. AJ 137 (2), pp. 3345–3357. External Links: Document, 0812.0364 Cited by: §I.1, §I.1, Table 2.
- The Discovery of Y Dwarfs using Data from the Wide-field Infrared Survey Explorer (WISE). ApJ 743 (1), pp. 50. External Links: Document, 1108.4678 Cited by: §I.1, §I.2.
- Atmospheric Parameters of Field L and T Dwarfs. ApJ 678 (2), pp. 1372–1395. External Links: Document, 0711.0801 Cited by: §V.
- Individual Dynamical Masses of Ultracool Dwarfs. ApJS 231 (2), pp. 15. External Links: Document, 1703.05775 Cited by: §I.
- Methane emission from a cool brown dwarf. Nature 628 (8008), pp. 511–514. External Links: Document, 2404.10977 Cited by: Figure 1, §I.
- Fundamental Parameters and Spectral Energy Distributions of Young and Field Age Objects with Masses Spanning the Stellar to Planetary Regime. ApJ 810 (2), pp. 158. External Links: Document, 1508.01767 Cited by: §I.
- Beyond Equilibrium Temperature: How the Atmosphere/Interior Connection Affects the Onset of Methane, Ammonia, and Clouds in Warm Transiting Giant Planets. AJ 160 (6), pp. 288. External Links: Document, 2010.00146 Cited by: §VI.
- The role of convection, overshoot, and gravity waves for the transport of dust in M dwarf and brown dwarf atmospheres. A&A 513, pp. A19. External Links: Document, 1002.3437 Cited by: §IV.3.
- A spherex pipeline and spectral library for ultracool dwarfs. External Links: 2604.22012, Link Cited by: §I.4, §I, §VI.
- Aerosol composition of hot giant exoplanets dominated by silicates and hydrocarbon hazes. Nature Astronomy 4, pp. 951–956. External Links: Document, 2005.11939 Cited by: §I.
- Stellar Spectral Classification. Cited by: footnote 2.
- A Standard Stellar Spectral Sequence in the Red/Near-Infrared: Classes K5 to M9. ApJS 77, pp. 417. External Links: Document Cited by: §I.1.
- Further Defining Spectral Type “Y” and Exploring the Low-mass End of the Field Brown Dwarf Mass Function. ApJ 753 (2), pp. 156. External Links: Document, 1205.2122 Cited by: §I.1.
- The Field Substellar Mass Function Based on the Full-sky 20 pc Census of 525 L, T, and Y Dwarfs. ApJS 253 (1), pp. 7. External Links: Document, 2011.11616 Cited by: footnote 2.
- Discoveries from a Near-infrared Proper Motion Survey Using Multi-epoch Two Micron All-Sky Survey Data. ApJS 190 (1), pp. 100–146. External Links: Document, 1008.3591 Cited by: §I.1, §I.2.
- The Initial Mass Function Based on the Full-sky 20 pc Census of 3600 Stars and Brown Dwarfs. ApJS 271 (2), pp. 55. External Links: Document, 2312.03639 Cited by: §II.2, §IV.4.
- Dwarfs Cooler than “M“: The Definition of Spectral Type “L” Using Discoveries from the 2 Micron All-Sky Survey (2MASS). ApJ 519 (2), pp. 802–833. External Links: Document Cited by: §I.1.
- New Spectral Types L and T. ARA&A 43 (1), pp. 195–245. External Links: Document Cited by: §I.1, footnote 3.
- in prep.. Cited by: §I.3.
- Probing the Heights and Depths of Y Dwarf Atmospheres: A Retrieval Analysis of the JWST Spectral Energy Distribution of WISE J035934.06─540154.6. ApJ 971 (2), pp. 121. External Links: Document, 2406.06493 Cited by: §I.2, §I.
- The Y-type Brown Dwarfs: Estimates of Mass and Age from New Astrometry, Homogenized Photometry, and Near-infrared Spectroscopy. ApJ 842 (2), pp. 118. External Links: Document, 1704.03573 Cited by: §IV.1.
- The First Y Dwarf Data from JWST Show that Dynamic and Diabatic Processes Regulate Cold Brown Dwarf Atmospheres. ApJ 959 (2), pp. 86. External Links: Document, 2309.14567 Cited by: §IV.2.
- James Webb Space Telescope Spectra of Cold Brown Dwarfs are Well-reproduced by Phosphine-free, Diabatic, ATMO2020++ Models. Research Notes of the American Astronomical Society 8 (1), pp. 13. External Links: Document Cited by: §IV.2.
- Revised Metallicity Classes for Low-Mass Stars: Dwarfs (dM), Subdwarfs (sdM), Extreme Subdwarfs (esdM), and Ultrasubdwarfs (usdM). ApJ 669 (2), pp. 1235–1247. External Links: Document, 0707.2993 Cited by: §I.1.
- Uniform Atmospheric Retrieval Analysis of Ultracool Dwarfs. II. Properties of 11 T dwarfs. ApJ 848 (2), pp. 83. External Links: Document, 1612.02809 Cited by: §V.
- Atmospheric Chemistry in Giant Planets, Brown Dwarfs, and Low-Mass Dwarf Stars. I. Carbon, Nitrogen, and Oxygen. Icarus 155 (2), pp. 393–424. External Links: Document Cited by: §I.2, §I.
- The Library of Exoplanet Atmospheric Composition Measurements: Population-level Trends in Exoplanet Composition with ExoComp. AJ 171 (1), pp. 31. External Links: Document, 2510.26785 Cited by: §I.
- Atmospheric Retrievals of the Phase-resolved Spectra of Irradiated Brown Dwarfs WD-0137B and EPIC-2122B. ApJ 968 (2), pp. 126. External Links: Document, 2404.16813 Cited by: §V.
- Clouds and chemistry across the brown dwarf T-Y sequence: Insights from JWST atmospheric retrievals. A&A 707, pp. A92. External Links: Document, 2601.12575 Cited by: §I.
- The Sonora Brown Dwarf Atmosphere and Evolution Models. I. Model Description and Application to Cloudless Atmospheres in Rainout Chemical Equilibrium. ApJ 920 (2), pp. 85. External Links: Document, 2107.07434 Cited by: §I.
- An atlas of stellar spectra, with an outline of spectral classification. Cited by: §II.2.
- The Sonora Substellar Atmosphere Models. III. Diamondback: Atmospheric Properties, Spectra, and Evolution for Warm Cloudy Substellar Objects. ApJ 975 (1), pp. 59. External Links: Document, 2402.00758 Cited by: §IV.4.
- PICASO 3.0: A One-dimensional Climate Model for Giant Planets and Brown Dwarfs. ApJ 942 (2), pp. 71. External Links: Document, 2208.07836 Cited by: §IV.5.
- The Sonora Substellar Atmosphere Models. IV. Elf Owl: Atmospheric Mixing and Chemical Disequilibrium with Varying Metallicity and C/O Ratios. ApJ 963 (1), pp. 73. External Links: Document, 2402.00756 Cited by: §IV.5.
- Spitzer IRAC Photometry of M, L, and T Dwarfs. ApJ 651 (1), pp. 502–516. External Links: Document, astro-ph/0606432 Cited by: §V.1.
- The JWST Early Release Science Program for Direct Observations of Exoplanetary Systems. V. Do Self-consistent Atmospheric Models Represent JWST Spectra? A Showcase with VHS 1256─1257 b. ApJ 966 (1), pp. L11. External Links: Document, 2312.03852 Cited by: §I.
- A new set of atmosphere and evolution models for cool T-Y brown dwarfs and giant exoplanets. A&A 637, pp. A38. External Links: Document, 2003.13717 Cited by: §IV.1.
- The Carbon-to-oxygen Ratio in Cool Brown Dwarfs and Giant Exoplanets. I. The Benchmark Late-T Dwarfs GJ 570D, HD 3651B, and Ross 458C. ApJ 961 (2), pp. 210. External Links: Document, 2312.02001 Cited by: §I.2.
- Chromospheric Activity, Rotation, and Rotational Braking in M and L Dwarfs. ApJ 684 (2), pp. 1390–1403. External Links: Document, 0805.1059 Cited by: §I.
- Cloud Microphysics: Analysis of the Clouds of Earth, Venus, Mars, and Jupiter. Icarus 36 (1), pp. 1–50. External Links: Document Cited by: §IV.3.
- The Hawaii Infrared Parallax Program. VI. The Fundamental Properties of 1000+ Ultracool Dwarfs and Planetary-mass Objects Using Optical to Mid-infrared Spectral Energy Distributions and Comparison to BT-Settl and ATMO 2020 Model Atmospheres. ApJ 959 (1), pp. 63. External Links: Document, 2309.03082 Cited by: §I, §V.1.
- Cool Zero-Metallicity Stellar Atmospheres. ApJ 424, pp. 333. External Links: Document Cited by: §I.2.
- Ammonia as a Tracer of Chemical Equilibrium in the T7.5 Dwarf Gliese 570D. ApJ 647 (1), pp. 552–557. External Links: Document, astro-ph/0605563 Cited by: §I.2.
- The Evolution of L and T Dwarfs in Color-Magnitude Diagrams. ApJ 689 (2), pp. 1327–1344. External Links: Document, 0808.2611 Cited by: §I, §IV.4.
- Spitzer Light Curves of the Young, Planetary-mass TW Hya Members 2MASS J11193254-1137466AB and WISEA J114724.10-204021.3. AJ 155 (6), pp. 238. External Links: Document, 1804.06917 Cited by: §I.
- A warm Neptune’s methane reveals core mass and vigorous atmospheric mixing. Nature 630 (8018), pp. 831–835. External Links: Document, 2405.11027 Cited by: §VI.
- The Two Micron All Sky Survey (2MASS). AJ 131 (2), pp. 1163–1183. External Links: Document Cited by: §I.4.
- The 0.8-14.5 m Spectra of Mid-L to Mid-T Dwarfs: Diagnostics of Effective Temperature, Grain Sedimentation, Gas Transport, and Surface Gravity. ApJ 702 (1), pp. 154–170. External Links: Document, 0906.2991 Cited by: §IV.4.
- Ultracool Dwarfs Observed with the Spitzer Infrared Spectrograph. I. An Accurate Look at the L-to-T Transition at 300 Myr from Optical Through Mid-infrared Spectrophotometry. ApJ 920 (2), pp. 99. External Links: Document, 2107.14282 Cited by: §I.
- Ultracool dwarfs observed with the Spitzer infrared spectrograph - II. Emergence and sedimentation of silicate clouds in L dwarfs, and analysis of the full M5-T9 field dwarf spectroscopic sample. MNRAS 513 (4), pp. 5701–5726. External Links: Document, 2205.00168 Cited by: §I.
- A 1.46-2.48 m spectroscopic atlas of a T6 dwarf (1060 K) atmosphere with IGRINS: first detections of H2S and H2, and verification of H2O, CH4, and NH3 line lists. MNRAS 514 (3), pp. 3160–3178. External Links: Document, 2206.03519 Cited by: §I.
- SPHEREx ultracool dwarf spectral atlas (suda): atmospheric and fundamental parameters of ultracool dwarfs. External Links: 2604.26771, Link Cited by: §VI.
- Spitzer Variability Properties of Low-gravity L Dwarfs. AJ 160 (1), pp. 38. External Links: Document, 2005.12854 Cited by: §I.
- The Wide-field Infrared Survey Explorer (WISE): Mission Description and Initial On-orbit Performance. AJ 140 (6), pp. 1868–1881. External Links: Document, 1008.0031 Cited by: §I.4.
- Primeval very low-mass stars and brown dwarfs - I. Six new L subdwarfs, classification and atmospheric properties. MNRAS 464 (3), pp. 3040–3059. External Links: Document, 1609.07181 Cited by: §I.1, Table 3, footnote 1.
- Uniform Forward-modeling Analysis of Ultracool Dwarfs. I. Methodology and Benchmarking. ApJ 916 (1), pp. 53. External Links: Document, 2011.12294 Cited by: §I, §V.