Single-dish Hi Intensity Mapping with the SKAO: Precursor Progress with MeerKAT’s Large Area Synoptic Survey (MeerKLASS)
Abstract
Using the SKAO to map the intensity of neutral hydrogen’s 21 cm emission line will be a golden opportunity to constrain models of cosmology. To access the largest cosmological scales, wide-sky surveys should ideally reach thousands of square degrees, requiring SKA-Mid’s dishes to scan the sky in auto-correlation mode, so-called single-dish observations. In this chapter, we overview the latest results from MeerKAT’s Large Area Synoptic Survey (MeerKLASS), which has been pioneering this single-dish observing strategy, and motivating its continuation with the SKA-Mid AA4 deployment. MeerKLASS, operating on the same Karoo site where the SKA-Mid is being built, has now achieved multiple cosmological detections from single-dish observations, including high-significance cross-correlations with optical galaxy surveys and continually improving measurements of the Hi auto-power spectrum. These results demonstrate that stable calibration, effective foreground mitigation, and statistical recovery of cosmological signal are all achievable with a large multi-dish telescope in total-power mode. The success of MeerKLASS therefore validates the observational strategies required for SKA-Mid and marks a key milestone in demonstrating the viability of single-dish Hi intensity mapping for cosmology. Looking ahead, SKA-Mid’s increased sensitivity and Band 1 coverage (350–1050 MHz) will allow the same methodology to probe redshifts up to , mapping volumes several orders of magnitude larger than currently accessible. The techniques refined with MeerKLASS thus form the operational and scientific foundation for a large portion of the SKAO’s cosmology programme.
1 Introduction
The largest cosmological scales in our Universe are among the most promising sources of information for testing the fundamental physics of cosmology. On these vast scales, the density field remains in the linear regime, largely free from the astrophysical complexities of non-linear structure formation that infiltrate smaller scales. These modes therefore preserve the cleanest imprints of cosmological physics, offering opportunities to probe phenomena such as baryonic acoustic oscillations (BAO) (Eisenstein and Hu, 1998), redshift space distortions (RSD) (Scoccimarro, 2004), modified gravity (Koyama, 2016), primordial non-Gaussianity (Dalal et al., 2008) and relativistic effects (Bonvin and Durrer, 2011). Unlocking this information demands wide-field surveys that can observe coherent fluctuations over thousands of megaparsecs.
The SKA Observatory (SKAO) is uniquely positioned to access these scales through 21 cm intensity mapping of neutral hydrogen (Hi) Wolz et al. (2026); Fonseca et al. (2026). Rather than resolving individual galaxies, this technique measures the integrated emission of the 21 cm line across broad regions of sky and frequency, enabling an efficient three-dimensional mapping of large-scale structure across vast cosmic volumes (Bharadwaj et al., 2001; Battye et al., 2004; Wyithe et al., 2008; Chang et al., 2008; Liu and Shaw, 2020; Villaescusa-Navarro and others, 2018). By surveying the integrated Hi signal, intensity mapping can rapidly build up a tomographic view of matter distribution from the late-Universe to redshifts that, in principle, can extend into the epoch of reionisation and even the dark ages (Furlanetto et al., 2006; Zaroubi, 2012; Kovetz and others, 2017).
The feasibility of 21cm intensity mapping has already been demonstrated using pre‑existing facilities, with early measurements from the Green Bank Telescope (Masui and others, 2013; Switzer and others, 2013; Wolz and others, 2017, 2022) and Parkes (Anderson and others, 2018) providing the first detections of large‑scale Hi fluctuations. Building on this foundation, several experiments have since been commissioned with 21cm intensity mapping as a science goal. MeerKAT (Jonas and MeerKAT Team, 2016), SKAO’s precursor and the focus of this chapter, was completed in 2018 and has now delivered multiple cosmological results using 21cm intensity mapping (Wang et al., 2021), which we review throughout this work. These include high‑significance cross‑power spectrum detections with overlapping galaxy surveys (Cunnington and others, 2022; Carucci and others, 2025; MeerKLASS Collaboration et al., 2025), stacked Hi emission detections (MeerKLASS Collaboration et al., 2025; Chen et al., 2025), and a measurement of the Hi auto‑correlation signal on sub‑Mpc scales (Paul et al., 2023). Similarly, CHIME (Amiri and others, 2022), which also began science operations in 2018, has reported stacked Hi emission detections in galaxy cross‑correlation (Amiri and others, 2023, 2024) and has also recently presented auto‑correlation measurements (Amiri and others, 2025), again primarily on smaller‑scale modes. Alongside these, other ongoing efforts with FAST (Hu et al., 2020; Li and others, 2023) and uGMRT (Elahi and others, 2024) are steadily progressing toward precision cosmological analyses, collectively demonstrating the rapid maturation of 21cm intensity mapping across a diverse set of instruments. We refer to Elahi et al. (2026) for a wider discussion on other SKAO pathfinders.
Accessing ultra-large scales in 21cm intensity mapping with the SKA-Mid will require operating the dishes in auto-correlation (or single-dish) mode (Santos et al., 2015). The interferometer baselines of SKA-Mid are optimised for high-resolution imaging, but lack sensitivity to the largest angular scales corresponding to features such as the BAO scale at Mpc (Bull et al., 2015). Single-dish observations, on the other hand, preserve the wide fields of view and continuous spatial information needed for intensity mapping at these scales. This observing mode, combined with efficient sky-scanning, offers a powerful pathway to measure the clustering of Hi over tens of thousands of square degrees.
Fortunately, the SKAO’s South African-based precursor, MeerKAT111sarao.ac.za/science/meerkat, is already demonstrating the success of this approach. MeerKAT, operated by the South African Radio Astronomy Observatory (SARAO), is located on the same site as the future SKA-Mid array in the Karoo desert and will eventually be incorporated into it around the turn of the decade. Through MeerKAT’s Large Area Synoptic Survey (MeerKLASS)222meerklass.org (Santos and others, 2017), the telescope has been pioneering single-dish Hi intensity mapping, delivering both technical validation and early cosmological results (see Cunnington and others, 2026, for a recent review), while at the same time delivering a wide, high-resolution continuum survey using the interferometer, as discussed in Chatterjee et al. (2026) (also see Chatterjee and others, 2025; Paul and others, 2025; Mangla and others, 2025). MeerKLASS has developed a robust calibration and analysis pipeline capable of handling complex instrumental effects, performing blind foreground cleaning, and statistically detecting the cosmological Hi signal. With 2,500 observing hours awarded and a target coverage of across , MeerKLASS is on course to become the largest spectroscopic survey of large-scale structure in the Southern hemisphere in the pre-SKAO era.
The progress made by MeerKLASS is of critical importance for shaping early science-verification programmes with the SKAO. The observing strategy developed for MeerKLASS, i.e. operating the telescope in single-dish mode, is directly transferable to SKA-Mid, and does not depend on the long interferometric baselines that will only become available in later deployment phases. Because single-dish intensity mapping requires only total-power measurements from each antenna, the data rates and processing requirements are dramatically reduced compared to conventional interferometric observations, making this technique ideally suited for early operations with the SKA-Mid AA∗ configuration. Moreover, SKA-Mid will provide a significant upgrade in raw sensitivity relative to MeerKAT, while its Band 1 receivers (covering 350–1050 MHz) will extend the accessible redshift range to , allowing cosmological volumes several orders of magnitude larger to be mapped, than currently analysed data sets. Demonstrating the robustness of the single-dish Hi intensity mapping approach with MeerKLASS therefore provides a compelling case for making this observing mode a flagship early-science verification target for the SKA-Mid, ensuring that cosmological exploitation of the telescope can begin well before its full interferometric capabilities are online.
In this chapter, we outline the progress made by MeerKLASS and discuss how its achievements pave the way for SKAO’s cosmological intensity mapping programme. Section 2 describes the MeerKLASS observing strategy and calibration methods, highlighting recent results that validate single-dish operation for large-scale cosmology, and includes a discussion on challenges of foreground removal. Section 3 presents the cosmological detections, mostly achieved through cross-correlation with overlapping galaxy surveys. Section 4 connects these milestones to the future prospects for SKA-Mid, outlining how the lessons from MeerKLASS guide its cosmological science goals. We then conclude in Section 5.
2 Calibrating and cleaning single-dish intensity mapping observations
In this section, we describe the observing and data-processing strategies developed by MeerKLASS for 21cm single-dish intensity mapping, together with the calibration and foreground-removal techniques that underpin its cosmological analyses. These developments are directly relevant to the SKA-Mid, whose dishes will employ the same total-power observing mode to achieve the wide-area surveys required for large-scale cosmology.
The calibration and scanning procedures refined by MeerKLASS, such as constant-elevation azimuth scans, frequent noise-diode injections, and iterative self-calibration, form an end-to-end framework that ensures gain stability and accurate recovery of large-scale sky structure. Because the SKA-Mid design closely follows MeerKAT’s offset-Gregorian optical configuration and receiver chain, the same methodology will transfer almost seamlessly to the SKAO era, requiring only minor adjustments to accommodate the larger number of dishes and expanded frequency coverage.
The ability to perform reliable auto-correlation measurements, construct three-dimensional sky cubes, and remove foregrounds with blind cleaning techniques represents the essential foundation for extracting cosmological information from 21cm maps. The following subsection outlines the MeerKLASS implementation of these methods, beginning with the L-band pilot surveys, which provide the first large-scale demonstration of these calibration and cleaning pipelines in practice.
2.1 MeerKLASS L-band pilot surveys
Cosmological neutral hydrogen observations with single dishes typically require a scanning strategy where the dishes are rapidly moved across the sky. In all MeerKLASS observations so far, the 64 MeerKAT antennas were set to scan in azimuth at constant elevation to minimise fluctuations of ground spill and airmass. In one scan, the dishes are moved back and forth along azimuth to produce several scan stripes, resulting in a series of Z-shaped coverage pattern due to the sky’s rotation. Two scans can be performed per night during the target field rising and setting, so that the two scans intersect and provide good coverage in their region of overlap. Before and after each scan (typically 1.5 hours), we spent several minutes tracking a nearby celestial point source to use as a bandpass and absolute flux calibrator. Noise diodes attached to each receiver were fired periodically during the observation to provide a relative time-ordered data (TOD) calibration reference.
We build the MeerKAT single-dish calibration pipeline KATcali, and employ it to calibrate the MeerKLASS observations and create the combined 3D data cubes. KATcali includes several cycles of RFI (Radio Frequency Interference) flagging, calibration, and map-making, as shown in Figure 1.

For RFI flagging, we use the RFI package of Signal Extraction and Emission Kartographer (SEEK; Akeret et al. 2017), which follows the SumThreshold algorithm (Offringa et al., 2010), to reduce the strong RFIs, following several rounds of low-level RFI flagging in later steps (see yellow boxes in Figure 1).
For calibration, we construct a model for all components that contribute to the total signal and fit the free parameters by comparing the model to the TOD using a prescribed likelihood with priors. Our model, in temperature units, is expressed as
| (1) |
where , and are the antenna temperature models of the point source contributions, celestial diffuse component (Galactic emission and the CMB), and elevation-dependent terrestrial emission (atmosphere and groundspill) respectively, while is the noise diode contribution and is the receiver temperature. All quantities external to the dish are considered to be already convolved by the primary beam. To compare with the raw data the correlator, where the hat indicates a temperature in the (arbitrary) correlator units, we multiply the signal model by the gain, , so that
| (2) |
The signal and gain models are then fitted (with a Bayesian framework; see more details in Section 3.3 of Wang et al. 2021) to the TOD for each polarisation (HH and VV), frequency channel, dish, and observation scan, all of which are treated independently. Using the gain solution, we can then obtain the calibrated temperature,
| (3) |


For the calibration of the tracking parts of the TOD, we track the centre and four outskirt pointings of the celestial calibrator source, and compare the raw signals with a model that includes the calibrator flux response at different beam positions. We can obtain the diode power fitting results, , for two tracking observations that are before and after the scan, respectively. Then, we use the average of the two values in the next step to calibrate the scanning data.
For the calibration of the scanning part, faint point sources in the target field were initially ignored under the assumption that the noise would dominate the residuals (Wang et al. 2021). Thus Equation 1 becomes
| (4) |
Similar to the calibration for tracking data, we fit the scanning data channel by channel. We obtain the and , etc. Then we calculate the sky temperature by
| (5) |
for diode off time samplings.
We construct equivalent TOD data arrays of total intensity (corresponding to Stokes I), as the mean value of the two calibrated polarisation temperatures, HH and VV. The final maps combine all scans and dishes, after we use the Zenith Equal Area (ZEA) map projection method (Astropy Collaboration et al., 2013) to get the coordinates of each TOD point on a pixel grid with a pixel size of deg chosen to be about 1/3 of the beam size.
With 10.5 hours of data from the MeerKLASS pilot survey undertaken in 2019 (Wang et al. 2021), the estimated thermal noise of the final data cube, obtained using the ABBA method, was limited to the theoretical noise level ( mK) as estimated using the radiometer equation (Wilson et al., 2013). The ABBA method allows for an estimate of the noise level directly from the calibrated maps. By evaluating the difference between four neighbouring frequency channels, it is possible to isolate the noise contribution, as any signal that is constant or varies linearly across the channels should cancel out. In details, the ABBA noise level on one sky pixel is estimated by
| (6) |
where the index goes over all pixels in the map and ⋆ means the combined result from the four channels . From the observation data, we take a weighted rms,
| (7) |
where the sum is over the number of pixels in the map, , and we have suppressed the dependence of and on . For the weight, , we used the theoretical expected variance itself, . The corresponding variance in each pixel would be,
| (8) |
Here the noise in the initial polarised TOD is given by the radiometer equation
| (9) |
where is the frequency width of the MeerKAT L-band channels and s is the length of each time stamp recording. For the system temperature we use the calibrated data itself, or for horizontal and vertical polarisation data, respectively. Thus the noise in the initial intensity TOD is
| (10) |
In order to get the final data cube, , the data goes through several stages of averaging. We propagate the variance taking into account this averaging in order to get to the final . The theoretical noise level which can be compared to in Equation 7, is obtained from the variance
| (11) |
More details can be found in Section 5.6 of Wang et al. (2021).
We show the final sky temperature map at 1023 MHz, along with the corresponding residual map, in Figure 2. The and maps from the 64 individual MeerKAT dishes can be found in Figures 24-25 of Wang et al. (2021).
As data quality improved, particularly in the 2021 MeerKLASS deep-field survey (27 repeated scans over ), a more sophisticated iterative self-calibration strategy became necessary. This advanced self-calibration method replaces the model in Equation 4 with the previously calibrated . As illustrated in Figure 1, the procedure is performed iteratively, with each loop using the Level-6 from the previous iteration, until the standard deviation of converges to a stable value. By introducing the iterative self-calibration process, the estimated thermal noise of the reconstructed maps () of the 2021 deep-field survey is limited to mK ( the theoretical noise level ). The sky image is shown in Figure 4 of MeerKLASS Collaboration et al. (2025).
2.2 Synchrotron spectral index
Diffuse Galactic synchrotron emission is the dominant foreground contaminant for the detection of cosmological at arcmin/degree scale resolutions. Developing a better understanding of this emission is key to both the optimal calibration of experiments which rely on radio sky models, as well designing robust and successful foreground separation/avoidance strategies. In its own right, diffuse Galactic synchrotron emission provides a measurement of our Galactic magnetic field strength and a window on cosmic ray propagation through that magnetic field (Orlando and Strong, 2013; Padovani et al., 2021; Bracco et al., 2024), as well as tracing dark matter annihilations (Hooper et al., 2007; Manconi et al., 2022) and helping to constrain the magnitude of transient and supernova remnant detections (Ocker et al., 2022; Khabibullin et al., 2023).
Observing between 544 and 1711 MHz (UHF- through to L-Band) at degree scale resolutions the MeerKAT Large Area Synoptic Survey (MeerKLASS) is optimally placed, in terms of frequency and spatial resolution, to obtain new constraints on the amplitude and spectral dependency of diffuse Galactic synchrotron emission. Additionally, the high spectral resolution of the MeerKLASS data, measurements every 0.2 MHz for L-Band data, provides a unique continuum science opportunity to follow the frequency dependancy of synchrotron emission without the need to take into account multiple calibration schemes across multiple instruments.
In Irfan et al. (2022) the MeerKLASS collaboration use 10 hours of pilot L-Band data between 971 and 1075 MHz to probe the synchrotron spectral index within the , sky region. Synchrotron emission is typically modeled as a power law:
| (12) |
with a spectral index which changes across both pixel and frequency. One suggested model for the change in spectral index across frequency, proposed in Fixsen et al. (2011), is as follows:
| (13) |
where is the synchrotron spectral index at frequency and , often referred to as the curvature term, determines the change to the spectral index over frequency.
Through the use of linear regression between MeerKLASS and ancillary datasets measurements of the average spectral index across the region were obtained under the assumption that the MeerKLASS maps are so dominated by diffuse Galactic synchrotron emission that, in the absence of any component separation, all other emissions (foreground and cosmological) are negligible. Figure 3 shows the average between 73 and 981 MHz at resolution of alongside the average between 45 and 981 MHz at resolution of . The OVRO Long Wavelength Array (Eastwood et al., 2018) provided the 73 MHz data and the Maipu/MU surveys (Guzmán et al., 2011) provided the 45 MHz data.


In order to calculate the spectral index per pixel between two sky maps both maps require absolute zero-level calibration so that their temperature values only represent the temperature of diffuse Galactic synchrotron and no other contributions such as a receiver temperature or the cosmic microwave background monopole, for instance. Wehus et al. (2017) measure the Haslam 408 MHz data (Haslam et al., 1982) monopole to be K; subtracting this value from the Haslam all-sky map provides an all-sky template for synchrotron emission which Irfan et al. (2022) use, alongside linear regression with their data to produce a cube (R.A, Dec, ) of MeerKLASS data representing pure synchrotron emission. Fitting a spectral index per pixel across this cube the MeerKLASS collaboration found an average spectral index of between 971 and 1075 MHz.
Another method to fit spectral forms using multiple maps each with unknown zero-level calibration is aperture photometry which calculates the flux of a point source (within an inner aperture) above the background emission level (outer annulus). Irfan et al. (2022) apply a variation on this method, considering instead the average diffuse flux within a 1.8 degree aperture above the minimum map temperature at each frequency. This was done for three aperture regions; an example of the spectral energy distribution for one is shown on the left of Figure 4, the data point at 73 MHz is OVRO-LWA data, at 408 MHz the data are provided by Haslam (red dotted fit) and a synchrotron emission model based on Haslam data (Planck results X, 2016) (purple fit). The fitted spectral index was found to be at 73 MHz in units of flux density or in units of temperature and the amount of curvature measured was . The right-hand plot in Figure 4 shows the comparison between the predicted values at 981ṀHz from the three MeerKLASS apertures alongside predicted values from two other experiments that have placed constraints on the synchrotron spectral index: ARCADE2 (Fixsen et al., 2011) and EDGES (Mozdzen et al., 2019). For the spectral curvature results, the synchrotron template made from Haslam data was preferred over the Haslam data themselves due to uncertainties over the magnitude of the calibration errors associated with Haslam data. The MeerKLASS data are being used to further probe such gain calibration errors in Wilensky et al. (2024).


2.3 Foreground cleaning calibrated maps
At the same frequencies of the redshifted 21 cm line, other astrophysical sources, such as the diffuse emission from the Milky Way, shine with considerably higher intensities, constituting massive foregrounds to the cosmological signal from Hi. Different strategies have been proposed to tackle the contaminant subtraction problem in this context (see Spinelli et al., 2026). The MeerKLASS collaboration has opted to be as agnostic as possible regarding the nature of the contaminants through the so-called “Blind Source Separation” algorithms. In particular, we have employed Principal Component Analysis (PCA). The driving assumption is that astrophysical foregrounds are smooth along frequency, holding few spectral degrees of freedom that can be identified through PCA. The task becomes more complex because extra systematic components, such as bandpass fluctuations, unmodeled beam response, and low-level, undetected RFI, disrupt the foreground smoothness, making the decomposition much more challenging to perform and evaluate.
A noise-weighted PCA was conducted to remove contaminants in the studies described by Cunnington and others (2022) and MeerKLASS Collaboration et al. (2025). These analyses achieved a level of cleaning sufficient to detect a cross-correlation signal with overlapping galaxy datasets. However, we encountered two major drawbacks: signal loss, which we addressed using a transfer function approach (Cunnington et al., 2023), and the ambiguity in selecting the level of cleaning, which increases the variance associated with the final measurement. To address and mitigate these issues, a more optimised cleaning pipeline was necessary.
In Carucci and others (2025), we examined the cleaning problem in greater detail. Specifically, we used the galaxy cross-correlation detection reported by Cunnington and others (2022) as a benchmark to test our pre-processing and cleaning choices. We successfully re-detected the cosmological signal by reducing the number of subtracted PCA components from 30 to 4. This achievement reduced signal loss due to cleaning and opened new avenues for modelling and interpreting the identified contaminants.
Carucci and others (2025) also developed a new optimised multiscale PCA (mPCA) method. This technique involves splitting intensity maps into large- and small-scale components and performing the cleaning procedure separately for each scale. The cosmological signal and galactic diffuse emissions are closely intertwined at larger scales. However, at smaller scales—although we expect less overlap with the Hi signal—the spectral structure of the contaminants can become more complex due to the mixture of systematics and astrophysical foregrounds. We optimise the separation in these different ‘environments’ by allowing the algorithm to operate independently on each scale.
In all tests presented by Carucci and others (2025), mPCA outperformed the standard PCA. We are currently applying mPCA in the latest analysis of MeerKLASS data (see Section 3.3).
3 Cosmological detections with MeerKLASS single-dish intensity maps
A central objective for MeerKLASS has been to demonstrate that 21 cm intensity mapping can deliver robust cosmological detections using a large multi-dish telescope operated in single-dish mode. Achieving this marks the critical step in establishing the approach as a viable technique for SKA-Mid, and as a cornerstone of its future cosmology programme. Each new detection strengthens confidence in the stability, calibration, and analysis pipeline required for this technique, providing a rigorous end-to-end test of the full observational framework. Through successive campaigns, MeerKLASS has now repeatedly demonstrated this capability, with a series of cosmological detections that refine our understanding of systematic effects and data processing. These results confirm that single-dish 21 cm intensity mapping is a viable and maturing observational method, laying the foundation for SKAO to employ this mode as a unique resource for cosmological parameter inference across unprecedented cosmic volumes.
3.1 Cross-correlations with galaxy surveys
Overlapping galaxy surveys provide a robust test of data quality for an SKAO intensity mapping precursor like MeerKAT. Due to the novelty of the observations being conducted by MeerKLASS, the data can be prone to systematics, which can be challenging to model or mitigate. Cross-correlating the intensity maps with overlapping galaxy catalogues, which will not share the additive systematics, effectively cuts through to the cosmological components within each tracer and can validate the presence of Hi within the cleaned intensity maps.
So far, MeerKLASS has made three successful detections of cosmological Hi clustering by detecting a cross-correlation power spectrum with overlapping galaxy surveys. We present these results in Figure 5, the full details of which can be found in Cunnington and others (2022); Carucci and others (2025); MeerKLASS Collaboration et al. (2025). There is a good consistency between the three power spectra despite them involving different pipelines, survey masks and even data sets for the case of the L-band deep field GAMA. We briefly summarise the two distinct surveys and their galaxy catalogue counterparts below:

MeerKLASS L-band pilot survey WiggleZ: hours of useable observations between MHz (), targeting a single patch of spanning in R.A., and in Declination. This overlapped with the WiggleZ 11hr field, and within this redshift range lay 4031 galaxies (Blake and others, 2010; Drinkwater and others, 2018).
MeerKLASS L-band deep-field survey GAMA: hours of useable observations, in a very similar frequency interval of the L-band (MHz) compared to the pilot survey, providing effectively the same redshift. This field targeted a single patch of spanning in R.A., and in Declination. This coincided with the Galaxy And Mass Assembly (GAMA) survey and its 23 hr (G23) field, providing 2269 overlapping galaxies (Driver and others, 2011; Liske et al., 2015; Driver and others, 2022).
Both these data sets have a small area and only span the small RFI-free redshift range of . This is therefore only scratching the surface of what will be possible with the full SKA-Mid AA4 Band 1 survey, which should comfortably survey four orders of magnitude larger cosmic volume than achieved with these early MeerKLASS surveys. This opens the possibility for exciting overlap with Stage-IV galaxy surveys, e.g. DESI (DESI Collaboration and others, 2016), Euclid (Euclid Collaboration and others, 2025), LSST/Rubin (LSST DESC and others, 2018), 4MOST (4MOST Collaboration and others, 2019).
3.2 Hi emission from stacking onto galaxy positions

The stacking of the 21 cm emission line signal using positions of optical galaxies is a powerful way of probing cosmic Hi, and is one of the main scientific goals of interferometric imaging with SKA-Mid (Sinigaglia et al., 2025). For line intensity mapping surveys, measurements have been made with the Hi intensity maps using the Parkes telescope (Tramonte et al., 2019; Tramonte and Ma, 2020) and the Canadian Hydrogen Intensity Mapping Experiment (CHIME Collaboration et al., 2023), CO emission line signal using the CO Mapping Array Project data (Dunne et al., 2024), and Lyman- intensity maps using the Hobby-Eberly Telescope Dark Energy Experiment observations (Lujan Niemeyer et al., 2022b, a).
The single-dish intensity mapping observations, using MeerKAT and future SKA-Mid, pose unique challenges to the stacking measurement due to the low angular resolution of the primary beam. The beam size of MeerKAT, and similarly the SKA-Mid, corresponds to a comoving scale of Mpc in L-band. To understand the detectability of the stacked signal, in Chen et al. (2025), an extensive framework for simulating mock observations was built. It was found that the stacked emission contains a contribution from the source near the centre of the stacking cubelet, as well as a large component of double-counting due to the beam. Foreground removal methods such as PCA can be used to remove the double-counting, while the emission around the centre can be detected at high statistical significance. The stacked signal is much wider along the frequency direction compared to the expected emission line profile of individual Higalaxies, with a large contribution from the clustering of the Hisources (see also Dunne et al. 2025).
Due to the clustering effect, the stacked signal is correlated at different frequency/velocity channels. Due to the smoothing effect from the beam, the stacked signal is correlated in the angular plane. The complexity of the stacked signal requires forward modelling and poses challenges for the covariance estimation. Chen et al. (2025) found that the modelling of the covariance is robust if the signal is averaged into a spectrum along the frequency direction and symmetrised along (Sinigaglia et al., 2022). The noise covariance can be estimated from the random shuffling of the galaxy positions, whereas the signal covariance can be estimated from forward modelling the stacked signal.
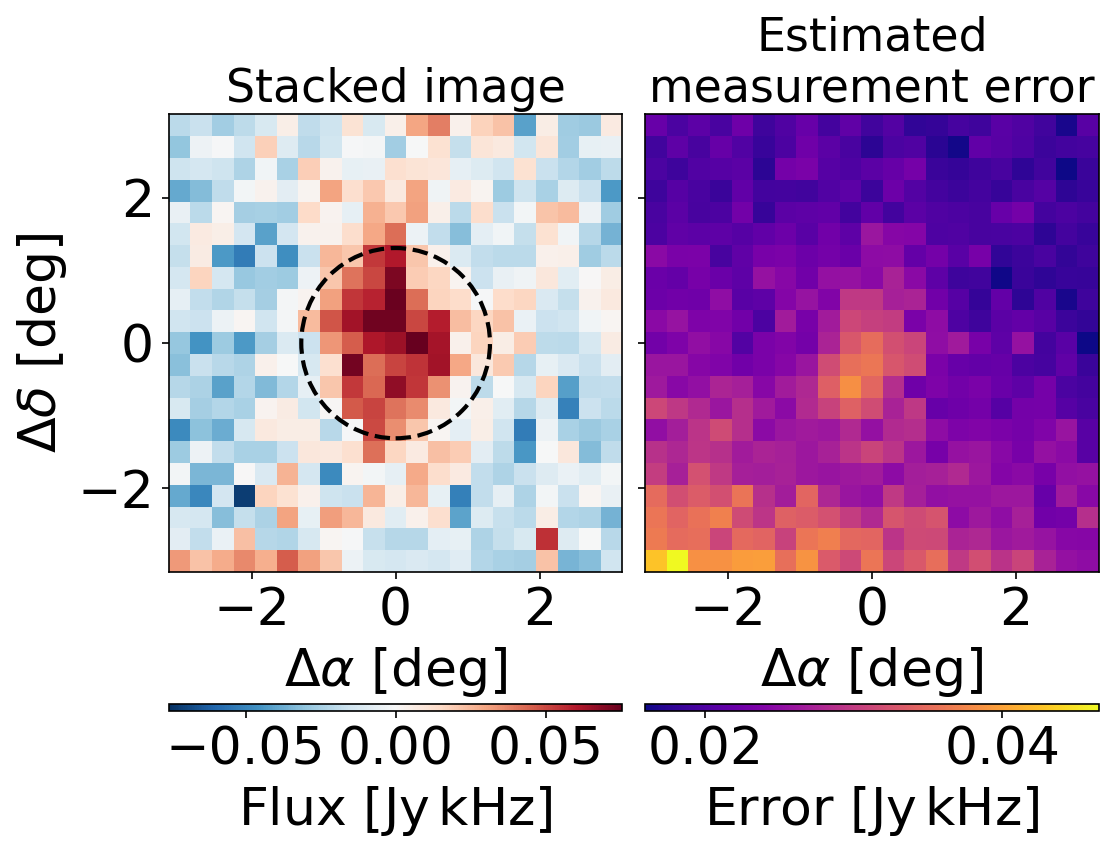
Applying the stacking analysis to the MeerKLASS L-band deep-field data, a stacked Hi signal onto the positions of the GAMA galaxies was detected as shown in Figure 6. The detection significance is when averaged into an angular map, and when averaged into a spectrum. The angular map of the stacked signal shows a clear excess around the centre of the image, corresponding to the size of the primary beam.
The stacked spectrum exhibits an oscillating component of systematics, as seen in Figure 6. The frequency of the oscillation matches the characteristic frequency of the primary beam ripple of the MeerKAT telescope (de Villiers, 2013; Asad et al., 2021). Using the random shuffling as a null test, we do not find any feature of the systematics, suggesting that the systematics are convolved with the map data. The estimated correlation matrix further demonstrates the convolution.
Using the forward modelling technique, Chen et al. (2025) performed Bayesian analysis and constrained the frequency of the oscillation to be MHz. The parameter fitting gives the effective Hi mass of the sources to be , which is an underestimation. It was found that there is a strong degeneracy between the amplitude of the systematics and the Hi density, leading to strong posterior projection effects.
3.3 The Hi auto-correlation power spectrum
Up to this point, the cosmological measurements presented in this chapter have focused on cross-correlations between the MeerKLASS Hi intensity maps and overlapping optical galaxy surveys. However, to fully unlock the potential of Hi intensity mapping as a cosmological probe, it is essential to demonstrate that cosmological information can also be recovered from the Hi auto-power spectrum. A detection of the Hi auto-power has been reported with MeerKAT operating as an interferometer Paul et al. (2023), but this measurement probed relatively small, non-linear scales where cosmological parameter inference would be highly complex.
By leveraging the 2021 L-band deep-field survey, described in Section 3.1, MeerKLASS are honing in on a measurement of the Hi power spectrum on cosmological scales, without relying on external data sets. In the absence of a galaxy survey counterpart which avoids additive biases from systematics in the Hi data, residual contamination can instead be mitigated by splitting the data set into independent subsets. This way, systematics can be suppressed via internal cross-correlations, as any contamination is expected to be largely uncorrelated across subsets. We defined four subsets through a division that is carried out both scan- and dish-wise (note that the pairs and are the most independent since they do not share dishes or scans), making sure that the signal-to-noise ratio in each of them is equivalent. The data splits into the groups, labelled by , are illustrated in the right-hand side of Figure 7.


The full analysis of these subsets, which are delivering a strong Hi auto-power spectrum measurement, is the focus of the upcoming work in MeerKLASS Collaboration and others (in prep.), to which we refer the reader. Here we only reveal the auto-correlation between subsets, shown in the right panel of Figure 7, which represents an upper limit of the Hi cosmological signal. In the auto- it is not possible to disentangle the cosmological signal from noise and residual systematics. The dominant noise contribution is set by the receiver system temperature, which induces a scale-independent thermal noise term that can be estimated empirically with the ABBA method (see Section 2.1). However, additional contributions may arise from residual contamination. For this reason MeerKLASS is leveraging the cross-subset measurements, i.e. and which is proving crucial in mitigating and understanding the remaining additive bias. The ultimate goal is to have a robust independent measurement of the Hi cosmological signal at large scales and eventually to constrain the amplitude of the Hi power spectrum, which depends on the abundance and clustering properties of the Hi. To this end, a multi-subset formalism (Percival et al., 2004; Seljak, 2009; McDonald and Seljak, 2009; White et al., 2009), that translates the multi-tracer method to our case, was adopted. In particular, we combined the cross-power spectra in a single data vector, focusing on the and pairs, already identified as the most reliable configurations. We are then running a multi-parametric analysis to constrain the overall amplitude of the power spectra and nuisance parameters to account for potential signal loss due to foreground cleaning.
The foreground cleaning procedure adopted for the auto-correlation measurement in MeerKLASS Collaboration and others (in prep.), is the multiscale PCA described in Section 2.3, and is applied on each subset independently. The coupling between cosmological signal and foreground modes, which is stronger at the largest radial scales, can induce leakages from the foreground cleaning process, in particular cosmological signal removed alongside foregrounds and therefore lost and residual foregrounds in the cleaned data, which, however, we expect not to be correlated across the different subsets, since the mPCA is performed separately on each of them; this is supported by several robustness tests that were specifically carried out to rule out the presence of spurious contributions to the measurements. Concerning signal loss, we are ensuring that its impact is minor in terms of the current uncertainties; nevertheless, we accounted for it by introducing a phenomenological modelling approach with the addition of dedicated nuisance parameters. Once performed the cleaning, we estimated the spherically averaged auto- and cross-subset power spectra in a scale range tailored to exclude the region mostly plagued by systematics (both residual contaminants and signal loss).
By demonstrating that Hi intensity mapping on cosmological scales is achievable with the MeerKAT telescope, this work is a milestone that paves the way for future surveys with the SKAO. An independent detection of the Hi cosmological signal would not only demonstrate the robustness of the technique, but also open a new window on large-scale structure, enabling the breaking of key parameter degeneracies (for instance between the galaxy and Hi bias parameters) that currently limit the power of cross-correlation analyses. Such a measurement would therefore allow for a substantial improvement of the constraining power also through full multi-tracer analyses, maximally leveraging the potential of the Hi field as an independent and powerful probe of the large-scale structure of the Universe.
4 Future observations with MeerKLASS and the SKA-Mid
After initial observations both in the L-band and the UHF-band, MeerKLASS is now running as a MeerKAT Extra Large Project (XLP). The goal is to reach a total of 2,500 hours on the UHF band covering an area of about 10,000 deg2, which is most of the Southern Sky away from the Galactic plane. This will allow us to probe cosmology between . Observations are ongoing, and by the end of 2025, MeerKLASS should have close to 800 hours observed in the UHF band, covering about 3,500 deg2. As discussed in Section 3.1, the sky area has strong overlap with DESI, the 4MOST cosmology survey, LSST/Rubin Observatory and Euclid. This will allow for a wealth of cosmological cross-correlation analysis and multi-wavelength studies of galaxy evolution. Main cosmological goals include the measurement of the BAO and RSD both independently and in cross-correlation with spectroscopic galaxy surveys (such as DESI/4MOST). This will, in turn, set constraints on the evolution of dark energy and the growth rate of large-scale structure. The large volumes will also allow us to probe large cosmological scales, past the equality peak, where signatures of primordial non-Gaussianity might be found. The commensal interferometric survey will allow studies of galaxy evolution, cluster science and transient searches. Another 500 hours have been awarded under the XLP for 2026, and the goal is to continue observing all the way to 2028/2029 in order to reach the target of 2,500 hours.
Table 1 shows the BAO expected detectability as a function of observing time. Here we assume a 50% survey efficiency, meaning half of the total observations (including off-scan calibrator tracking) are used in the final data analysis. This is a reasonable assumption from preliminary calibration of MeerKLASS UHF observations. For example, maps centred at R.A., Dec. contain 42.4% of total observations. There is scope for increasing this by implementing a correction to a non-linear gain effect caused by RFI, which is currently responsible for a significant amount of data flagging (this is being pursued in ongoing MeerKLASS work). Hence the 50% adopted figure remains a reasonable projection from early MeerKLASS findings. We also refer the reader to the recent review in Cunnington and others (2026), which includes some additional forecasts for the full MeerKLASS survey. Figure 8 shows calibrated UHF band data at 760 MHz from the 2022-2023 observation campaign with MeerKLASS and sketched coverage for both the current 2024-2025 and the future ones.
| Year | Obs. time [h] | Total area [deg2] | BAO SNR =0.43 | =0.61 | z=0.8 | =1.0 | Combined |
|---|---|---|---|---|---|---|---|
| 2023 – 2024* | 380 | 1,600 | 1.9 | 2.2 | 1.2 | 0.6 | 3.2 |
| 2025 | +500 | 3,600 | 2.8 | 3.4 | 1.9 | 1.0 | 5.0 |
| 2026 | +500 | 5,600 | 3.4 | 4.4 | 2.4 | 1.3 | 6.2 |
| 2027 | +550 | 7,800 | 4.0 | 5.1 | 2.9 | 1.5 | 7.3 |
| 2028 | +570 | 10,000 | 4.6 | 5.8 | 3.3 | 1.7 | 8.3 |

4.1 Extending MeerKLASS strategies to the SKA-Mid
The transition from MeerKLASS to the SKA-Mid era will represent a natural progression of single-dish intensity-mapping science. Around 2031, the MeerKAT array will be integrated into the SKA-Mid, forging the AA∗ operational phase, totalling 144 dishes. The 64 MeerKAT dishes will remain on the same Karoo site as SKA-Mid, ensuring full compatibility in infrastructure, observing conditions, and calibration methods. While the MeerKAT antennas have a 13.5 m diameter compared with the 15 m SKA-Mid dishes, this modest difference in collecting area and beam width does not fundamentally alter the observing or calibration approach that has proved successful for MeerKLASS. The MeerKAT antennas employ offset-Gregorian optics with cryogenic front ends, closely matching the SKA-Mid design. For SKA-Mid Band 2 (0.95–1.76 GHz), cryogenic receivers achieve –K and K (Lehmensiek and de Villiers, 2019), improving upon MeerKAT’s L-band performance (–K). In contrast, Band 1 (0.35–1.05 GHz) employs ambient-temperature receivers with –K, slightly higher than MeerKAT’s cryogenic UHF system (K). Both SKA-Mid bands are designed for broad instantaneous bandwidths and high-resolution digital backends (supporting 16k and 65k channel modes) providing enhanced frequency resolution.
Since any differences between MeerKAT and SKA-Mid are marginal, the single-dish scanning and calibration techniques developed by MeerKLASS can be directly adopted by the SKAO. The AA4 deployment, comprising 197 SKA-Mid dishes, will be capable of performing independent auto-correlation (total-power) measurements using a constant-elevation scanning strategy identical to that described in Section 2. This approach efficiently mitigates ground-spill and atmospheric fluctuations while building up wide, near-homogeneous sky coverage. The same end-to-end calibration pipeline, anchored on noise-diode injection, regular flux calibration, and iterative self-calibration, will therefore be applicable with minimal modification.
As outlined in SKAO Cosmology SWG and others (2020), SKA-Mid AA4 will aim to conduct a cosmological HI intensity-mapping survey over , covering the redshift range with Band 1 (350–1050 MHz). This will extend the MeerKLASS concept to cosmological volumes several orders of magnitude larger, exploiting SKA-Mid’s increased expanded frequency coverage. The proven success of MeerKLASS in implementing stable single-dish operation, calibration, and cosmological detections therefore provides the operational and scientific foundation for this next-generation survey, ensuring that SKA-Mid can immediately capitalise on the observing strategies refined with the MeerKAT precursor.
5 Conclusion
MeerKLASS has provided the first large-scale demonstration of 21cm intensity mapping with a modern array, establishing a robust framework for cosmological surveys with the SKA-Mid. By combining dedicated calibration strategies, stable scanning operations, and blind foreground-cleaning pipelines, MeerKLASS has achieved the sensitivity and stability required to recover large-scale Hi brightness fluctuations from the dominant astrophysical foregrounds. These developments mark a major milestone in proving that single-dish mode observations can deliver the cosmological information required for precision science.
Through the careful validation of calibration pipelines and repeated verification of the single-dish observing mode, MeerKLASS has demonstrated end-to-end control of the systematic effects that once represented the principal barrier to large-scale intensity mapping. The project has achieved multiple cross-correlation detections of cosmological Hi fluctuations, placed competitive lower limits on the Hi auto-power, and developed rigorous methods to correct for signal loss using the foreground transfer function. These results collectively establish a high degree of readiness for the continuation of large-scale intensity-mapping science with the SKAO.
The lessons learned from MeerKLASS extend directly to the SKAO AA* deployment, where the MeerKAT dishes will be integrated into the SKA-Mid array. Since the same observing mode can be implemented with the expanded system, single-dish intensity mapping represents an ideal early-science verification case for SKA-Mid. The enhanced sensitivity, expanded frequency coverage of Band 1, and extended sky reach to will enable SKA-Mid to probe vast cosmological volumes, constraining the evolution of large-scale structure and testing fundamental physics on horizon scales.
Looking ahead, the experience gained from MeerKLASS forms a cornerstone for the SKAO’s large-scale cosmology programme. The techniques and analyses developed here, e.g. calibration stability, data combination, foreground mitigation, and power-spectrum analysis, will ensure that the SKAO can exploit its full potential as a precision cosmological instrument. In this sense, MeerKLASS is not only a scientific precursor but a technological and methodological blueprint, demonstrating that 21cm single-dish intensity mapping has matured into a reliable probe ready for the SKAO era.
Author list ordering
The construction of this chapter was jointly led by Steven Cunnington and Jingying Wang, who appear as alphabetical joint first authors. Mario G. Santos is PI of the MeerKLASS experiment. All other authors are listed alphabetically and were chosen as those who made contributions (either directly or in a supervisory capacity) to the results presented in this work.
References
- 4MOST: Project overview and information for the First Call for Proposals. The Messenger 175, pp. 3–11. External Links: Document, 1903.02464 Cited by: §3.1.
- HIDE & SEEK: End-to-end packages to simulate and process radio survey data. Astronomy and Computing 18, pp. 8–17. External Links: Document, 1607.07443 Cited by: §2.1.
- An Overview of CHIME, the Canadian Hydrogen Intensity Mapping Experiment. Astrophys. J. Supp. 261 (2), pp. 29. External Links: 2201.07869, Document Cited by: §1.
- Detection of Cosmological 21 cm Emission with the Canadian Hydrogen Intensity Mapping Experiment. Astrophys. J. 947 (1), pp. 16. External Links: 2202.01242, Document Cited by: §1.
- A Detection of Cosmological 21 cm Emission from CHIME in Cross-correlation with eBOSS Measurements of the Ly Forest. Astrophys. J. 963 (1), pp. 23. External Links: 2309.04404, Document Cited by: §1.
- Detection of the Cosmological 21 cm Signal in Auto-correlation at z ~ 1 with the Canadian Hydrogen Intensity Mapping Experiment. arXiv:. External Links: 2511.19620 Cited by: §1.
- Low-amplitude clustering in low-redshift 21-cm intensity maps cross-correlated with 2dF galaxy densities. Mon. Not. Roy. Astron. Soc. 476 (3), pp. 3382–3392. External Links: 1710.00424, Document Cited by: §1.
- Primary beam effects of radio astronomy antennas - II. Modelling MeerKAT L-band beams. MNRAS 502 (2), pp. 2970–2983. External Links: Document, 1904.07155 Cited by: §3.2.
- Astropy: A community Python package for astronomy. Astronomy & Astrophysics 558, pp. A33. External Links: Document, 1307.6212 Cited by: §2.1.
- Neutral hydrogen surveys for high redshift galaxy clusters and proto-clusters. MNRAS 355, pp. 1339–1347. External Links: astro-ph/0401340, Document Cited by: §1.
- Using HI to probe large scale structures at z ~ 3. J. Astrophys. Astron. 22, pp. 21. External Links: astro-ph/0003200, Document Cited by: §1.
- The WiggleZ Dark Energy Survey: the selection function and z=0.6 galaxy power spectrum. Mon. Not. Roy. Astron. Soc. 406, pp. 803–821. External Links: 1003.5721, Document Cited by: §3.1.
- What galaxy surveys really measure. Phys. Rev. D 84, pp. 063505. External Links: 1105.5280, Document Cited by: §1.
- A new analytical model of the cosmic-ray energy flux for Galactic diffuse radio emission. Astronomy & Astrophysics 686, pp. A52. External Links: Document, 2402.19367 Cited by: §2.2.
- Late-time cosmology with 21cm intensity mapping experiments. Astrophys. J. 803 (1), pp. 21. External Links: 1405.1452, Document Cited by: §1.
- Hydrogen intensity mapping with MeerKAT: Preserving cosmological signal by optimising contaminant separation. Astron. Astrophys. 703, pp. A222. External Links: 2412.06750, Document Cited by: §1, §2.3, §2.3, §2.3, §3.1.
- Baryon Acoustic Oscillation Intensity Mapping as a Test of Dark Energy. Phys. Rev. Lett. 100, pp. 091303. External Links: 0709.3672, Document Cited by: §1.
- . In Advancing Astrophysics with the SKA – II (AASKAII), Note: arXiv search: Report number AASKAII/Chatterjee01 Cited by: §1.
- The MeerKLASS On-the-Fly continuum survey: pipeline design and validation. External Links: 2512.11978 Cited by: §1.
- Emission line stacking of 21cm intensity maps with MeerKLASS: Inference pipeline and application to the L-band deep-field data. arXiv e-prints, pp. arXiv:2504.03908. External Links: Document, 2504.03908 Cited by: §1, §3.2, §3.2, §3.2.
- Detection of Cosmological 21 cm Emission with the Canadian Hydrogen Intensity Mapping Experiment. APJ 947 (1), pp. 16. External Links: Document, 2202.01242 Cited by: §3.2.
- H i intensity mapping with MeerKAT: power spectrum detection in cross-correlation with WiggleZ galaxies. Mon. Not. Roy. Astron. Soc. 518 (4), pp. 6262–6272. External Links: 2206.01579, Document Cited by: §1, §2.3, §2.3, §3.1.
- Revealing cosmological fluctuations in 21 cm intensity maps with MeerKLASS: from maps to power spectra. Astrophys. Space Sci. 371 (2), pp. 16. External Links: 2510.27549, Document Cited by: §1, §4.
- The foreground transfer function for H I intensity mapping signal reconstruction: MeerKLASS and precision cosmology applications. MNRAS 523 (2), pp. 2453–2477. External Links: Document, 2302.07034 Cited by: §2.3.
- The imprints of primordial non-gaussianities on large-scale structure: scale dependent bias and abundance of virialized objects. Phys. Rev. D 77, pp. 123514. External Links: 0710.4560, Document Cited by: §1.
- Prediction of aperture efficiency ripple in clear aperture offset gregorian antennas. IEEE Transactions on Antennas and Propagation 61 (5), pp. 2457–2465. External Links: Document Cited by: §3.2.
- The DESI Experiment Part I: Science,Targeting, and Survey Design. External Links: 1611.00036 Cited by: §3.1.
- The WiggleZ Dark Energy Survey: final data release and the metallicity of UV-luminous galaxies. Mon. Not. Roy. Astron. Soc. 474 (3), pp. 4151–4168. External Links: 1910.08284, Document Cited by: §3.1.
- Galaxy and Mass Assembly (GAMA): survey diagnostics and core data release. Mon. Not. Roy. Astron. Soc. 413, pp. 971. External Links: 1009.0614, Document Cited by: §3.1.
- Galaxy And Mass Assembly (GAMA): Data Release 4 and the z 0.1 total and z 0.08 morphological galaxy stellar mass functions. Mon. Not. Roy. Astron. Soc. 513 (1), pp. 439–467. External Links: 2203.08539, Document Cited by: §3.1.
- Three-Dimensional Stacking as a Line Intensity Mapping Statistic. arXiv e-prints, pp. arXiv:2503.21743. External Links: Document, 2503.21743 Cited by: §3.2.
- COMAP Early Science. VIII. A Joint Stacking Analysis with eBOSS Quasars. APJ 965 (1), pp. 7. External Links: Document, 2304.09832 Cited by: §3.2.
- The Radio Sky at Meter Wavelengths: m-mode Analysis Imaging with the OVRO-LWA. The Astronomical Journal 156 (1), pp. 32. External Links: Document, 1711.00466 Cited by: §2.2.
- Baryonic features in the matter transfer function. Astrophys. J. 496, pp. 605. External Links: astro-ph/9709112, Document Cited by: §1.
- . In Advancing Astrophysics with the SKA – II (AASKAII), Note: arXiv search: Report number AASKAII/Elahi01 Cited by: §1.
- Towards 21-cm intensity mapping at z = 2.28 with uGMRT using the tapered gridded estimator – IV. Wide-band analysis. Mon. Not. Roy. Astron. Soc. 529 (4), pp. 3372–3386. External Links: 2403.06736, Document Cited by: §1.
- Euclid. I. Overview of the Euclid mission. Astron. Astrophys. 697, pp. A1. External Links: 2405.13491, Document Cited by: §3.1.
- ARCADE 2 Measurement of the Absolute Sky Brightness at 3-90 GHz. APJ 734 (1), pp. 5. External Links: Document, 0901.0555 Cited by: §2.2, §2.2.
- . In Advancing Astrophysics with the SKA – II (AASKAII), Note: arXiv search: Report number AASKAII/Fonseca01 Cited by: §1.
- Cosmology at Low Frequencies: The 21 cm Transition and the High-Redshift Universe. Phys. Rept. 433, pp. 181–301. External Links: astro-ph/0608032, Document Cited by: §1.
- All-sky Galactic radiation at 45 MHz and spectral index between 45 and 408 MHz. Astronomy & Astrophysics 525, pp. A138. External Links: Document, 1011.4298 Cited by: §2.2.
- A 408 MHz all-sky continuum survey. II. The atlas of contour maps.. Astronomy & Astrophysicss 47, pp. 1–143. Cited by: §2.2.
- Possible evidence for dark matter annihilations from the excess microwave emission around the center of the Galaxy seen by the Wilkinson Microwave Anisotropy Probe. Physical Review D 76 (8), pp. 083012. External Links: Document, 0705.3655 Cited by: §2.2.
- Forecast for FAST: from galaxies survey to intensity mapping. Mon. Not. Roy. Astron. Soc. 493 (4), pp. 5854–5870. External Links: Document, 1909.10946 Cited by: §1.
- Measurements of the diffuse Galactic synchrotron spectral index and curvature from MeerKLASS pilot data. MNRAS 509 (4), pp. 4923–4939. External Links: Document, 2111.08517 Cited by: §2.2, §2.2, §2.2.
- The MeerKAT Radio Telescope. In MeerKAT Science: On the Pathway to the SKA, pp. 1. External Links: Document Cited by: §1.
- SRG/eROSITA discovery of a radio-faint X-ray candidate supernova remnant SRGe J003602.3+605421 = G121.1-1.9. MNRAS 521 (4), pp. 5536–5556. External Links: Document, 2207.00064 Cited by: §2.2.
- Line-Intensity Mapping: 2017 Status Report. External Links: 1709.09066 Cited by: §1.
- Cosmological Tests of Modified Gravity. Rept. Prog. Phys. 79 (4), pp. 046902. External Links: 1504.04623, Document Cited by: §1.
- On the performance of the ska mid-frequency array’s reflector system and its feeds. In 2019 URSI Asia-Pacific Radio Science Conference (AP-RASC), Vol. , pp. 1–3. External Links: Document Cited by: §4.1.
- FAST Drift Scan Survey for Hi Intensity Mapping: I. Preliminary Data Analysis. Astrophys. J. 954 (2), pp. 139. External Links: 2305.06405, Document Cited by: §1.
- Galaxy And Mass Assembly (GAMA): end of survey report and data release 2. MNRAS 452 (2), pp. 2087–2126. External Links: Document, 1506.08222 Cited by: §3.1.
- Data Analysis for Precision 21 cm Cosmology. Publ. Astron. Soc. Pac. 132 (1012), pp. 062001. External Links: 1907.08211, Document Cited by: §1.
- The LSST Dark Energy Science Collaboration (DESC) Science Requirements Document. External Links: 1809.01669, Document Cited by: §3.1.
- Ly Halos around [O III]-selected Galaxies in HETDEX. APJl 934 (2), pp. L26. External Links: Document, 2207.11098 Cited by: §3.2.
- Surface Brightness Profile of Lyman- Halos out to 320 kpc in HETDEX. APJ 929 (1), pp. 90. External Links: Document, 2203.04826 Cited by: §3.2.
- Dark Matter Constraints from Planck Observations of the Galactic Polarized Synchrotron Emission. Physical Review Letters 129 (11), pp. 111103. External Links: Document, 2204.04232 Cited by: §2.2.
- The MeerKLASS L-band On-the-Fly Continuum Survey: Data Release 1. External Links: 2512.17685 Cited by: §1.
- Measurement of 21 cm brightness fluctuations at z ~ 0.8 in cross-correlation. Astrophys. J. Lett. 763, pp. L20. External Links: 1208.0331, Document Cited by: §1.
- How to evade the sample variance limit on measurements of redshift-space distortions. JCAP 2009 (10), pp. 007. External Links: Document, 0810.0323 Cited by: §3.3.
- MeerKLASS L-band deep-field intensity maps: entering the H I dominated regime. MNRAS 537 (4), pp. 3632–3661. External Links: Document, 2407.21626 Cited by: §1, §2.1, §2.3, §3.1.
- HI intensity mapping with MeerKAT: An auto-power spectrum measurement consistent with a cosmological 21-cm signal. Cited by: §3.3, §3.3.
- Spectral index of the diffuse radio background between 50 and 100 MHz. MNRAS 483 (4), pp. 4411–4423. External Links: Document, 1812.02660 Cited by: §2.2.
- Radio Scattering Horizons for Galactic and Extragalactic Transients. APJ 934 (1), pp. 71. External Links: Document, 2203.16716 Cited by: §2.2.
- Post-correlation radio frequency interference classification methods. MNRAS 405 (1), pp. 155–167. External Links: Document, 1002.1957 Cited by: §2.1.
- Galactic synchrotron emission with cosmic ray propagation models. MNRAS 436 (3), pp. 2127–2142. External Links: Document, 1309.2947 Cited by: §2.2.
- Spectral index of synchrotron emission: insights from the diffuse and magnetised interstellar medium. arXiv e-prints, pp. arXiv:2106.10929. External Links: 2106.10929 Cited by: §2.2.
- The MeerKLASS UHF On-the-Fly Continuum Survey – Data Release I. External Links: 2512.11964 Cited by: §1.
- A first detection of neutral hydrogen intensity mapping on Mpc scales at and . External Links: 2301.11943 Cited by: §1, §3.3.
- Fourier analysis of luminosity-dependent galaxy clustering. MNRAS 347 (2), pp. 645–653. External Links: Document, astro-ph/0306511 Cited by: §3.3.
- Planck2015 results. Astronomy & Astrophysics 594, pp. A10. External Links: ISSN 1432-0746, Link, Document Cited by: §2.2.
- Cosmology from a SKA HI intensity mapping survey. In Advancing Astrophysics with the Square Kilometre Array (AASKA14), pp. 19. External Links: Document, 1501.03989 Cited by: §1.
- MeerKLASS: MeerKAT Large Area Synoptic Survey. In MeerKAT Science: On the Pathway to the SKA, External Links: 1709.06099 Cited by: §1.
- Redshift-space distortions, pairwise velocities and nonlinearities. Phys. Rev. D 70, pp. 083007. External Links: astro-ph/0407214, Document Cited by: §1.
- Extracting Primordial Non-Gaussianity without Cosmic Variance. Physical Review Letters 102 (2), pp. 021302. External Links: Document, 0807.1770 Cited by: §3.3.
- Semiempirical constraints on the HI mass function of star-forming galaxies and HI at z 0.37 from interferometric surveys. Astron. Astrophys. 704, pp. A152. External Links: 2506.11280, Document Cited by: §3.2.
- Optimizing spectral stacking for 21-cm observations of galaxies: accuracy assessment and symmetrized stacking. MNRAS 514 (3), pp. 4205–4221. External Links: Document, 2206.03300 Cited by: §3.2.
- Cosmology with Phase 1 of the Square Kilometre Array: Red Book 2018: Technical specifications and performance forecasts. Publ. Astron. Soc. Austral. 37, pp. e007. External Links: 1811.02743, Document Cited by: §4.1.
- . In Advancing Astrophysics with the SKA – II (AASKAII), Note: arXiv search: Report number AASKAII/Spinelli01 Cited by: §2.3.
- Determination of z~0.8 neutral hydrogen fluctuations using the 21 cm intensity mapping auto-correlation. Mon. Not. Roy. Astron. Soc. 434, pp. L46. External Links: 1304.3712, Document Cited by: §1.
- Searching for H I imprints in cosmic web filaments with 21-cm intensity mapping. MNRAS 489 (1), pp. 385–400. External Links: Document, 1908.00028 Cited by: §3.2.
- The neutral hydrogen distribution in large-scale haloes from 21-cm intensity maps. MNRAS 498 (4), pp. 5916–5935. External Links: Document, 2009.02387 Cited by: §3.2.
- Ingredients for 21 cm Intensity Mapping. Astrophys. J. 866 (2), pp. 135. External Links: 1804.09180, Document Cited by: §1.
- H I intensity mapping with MeerKAT: calibration pipeline for multidish autocorrelation observations. MNRAS 505 (3), pp. 3698–3721. External Links: Document, 2011.13789 Cited by: §1, §2.1, §2.1, §2.1, §2.1, §2.1.
- Monopole and dipole estimation for multi-frequency sky maps by linear regression. Astronomy & Astrophysics 597, pp. A131. External Links: Document Cited by: §2.2.
- Forecasting cosmological constraints from redshift surveys. MNRAS 397 (3), pp. 1348–1354. External Links: Document, 0810.1518 Cited by: §3.3.
- Bayesian evidence for uncorrected gain factors in Galactic synchrotron template maps. arXiv e-prints, pp. arXiv:2409.06770. External Links: Document, 2409.06770 Cited by: §2.2.
- Tools of Radio Astronomy. External Links: Document Cited by: §2.1.
- Erasing the Milky Way: new cleaning technique applied to GBT intensity mapping data. Mon. Not. Roy. Astron. Soc. 464 (4), pp. 4938–4949. External Links: 1510.05453, Document Cited by: §1.
- . In Advancing Astrophysics with the SKA – II (AASKAII), Note: arXiv search: Report number AASKAII/Wolz01 Cited by: §1.
- H i constraints from the cross-correlation of eBOSS galaxies and Green Bank Telescope intensity maps. Mon. Not. Roy. Astron. Soc. 510 (3), pp. 3495–3511. External Links: 2102.04946, Document Cited by: §1.
- Baryonic Acoustic Oscillations in 21cm Emission: A Probe of Dark Energy out to High Redshifts. MNRAS 383, pp. 1195. External Links: 0709.2955, Document Cited by: §1.
- The Epoch of Reionization. External Links: 1206.0267, Document Cited by: §1.