

When Agents Commit Too Soon: Diagnosing Premature Commitment in LLM Agents
Abstract
Long-horizon LLM agents can fail quietly: they settle on one reading of the evidence early, then spend the rest of the run defending it. We call this premature commitment. Final-answer scoring misses the failure mode because it sees only the answer, not whether the process has already collapsed to a stable path. We define representational commitment as cross-run hidden-state convergence at a fixed reasoning step, and use it as an early diagnostic of trajectory consistency. On Llama-3.1-70B running ReAct on HotpotQA, step-4 hidden-state similarity predicts downstream behavioral consistency (, partial ), with a localized temporal and layer-wise signature. The signal replicates across Qwen-2.5-72B and Phi-3-14B, and on StrategyQA (). It does not track correctness: committed-wrong and committed-correct questions are not separable in activation similarity. That boundary is central to the claim. Commitment tells us whether an agent has settled, not whether it is right. A runtime monitor detects inconsistent trajectories from hidden states at AUROC up to 0.97 (0.85–0.88 under a stricter split), and a prompting intervention cuts behavioral variance by 28% against a token-matched control while leaving accuracy statistically unchanged. We also test whether the signal can route self-consistency compute; on a harder benchmark it helps only modestly and is matched by a simpler output-based baseline. The result is a diagnostic for a hidden process failure, with clear limits rather than a general accuracy lever.
1 Introduction
LLM agents are increasingly handed long, consequential tasks (multi-step research, software edits, web transactions) in which one run chains tool calls, retrievals, and memory writes (Yao et al., 2022; Wei et al., 2022). In this setting, reliability depends not only on the final answer but on whether the trajectory is still open to evidence. A quiet failure mode is premature commitment: the agent settles on one interpretation early and then defends it for the rest of the run. Nothing crashes, and the trajectory can look coherent; the problem is that it has become coherent around the first reading, right or wrong.
This matters because final-answer checks and agreement checks see the wrong object. A single final answer cannot reveal that the process locked in early. Cross-run agreement helps, but agreement is ambiguous: a confidently-wrong agent can agree with itself as reliably as a correct one. Prior work shows that trajectory variance is consequential, with behavioral divergence concentrating at early decision points (Mehta, 2026b) and trajectory-consistent runs 32–55 points more accurate than inconsistent ones on HotpotQA (Mehta, 2026a). But consistency amplifies outcomes rather than guaranteeing correctness. The practical question is therefore not just whether agents agree, but whether the model has internally settled before the run is over.
We ask whether that settling leaves a measurable signature in hidden states.
Operational definition. We define representational commitment as cross-run hidden-state convergence at a fixed agent step: run the same input times at non-zero temperature, take the hidden state at the last token of step , and measure mean pairwise cosine similarity across runs. High similarity across runs that saw different observations means the model has settled on a stable interpretation; low similarity means the representation still depends on the particular evidence path. Activation similarity is the measurement; representational commitment is the construct it indexes.
Contributions.
-
1.
A signature. Cross-run activation similarity at step 4 predicts trajectory consistency on Llama-HotpotQA (, partial , quartile gap, ), with sharp temporal and spatial localization. It replicates across architectures on HotpotQA (Llama 70B, Qwen 72B, Phi-3 14B, at different peak layers) and across benchmarks on Llama (HotpotQA StrategyQA: ), ruling out single-model and single-step selection artifacts.
-
2.
A failure axis, not an accuracy axis. The diagnostic tracks process consistency, not correctness: committed-wrong and committed-correct questions are not separable in activation similarity. This is the part of the picture that final-score evaluation hides: one internal convergence signature produces both reliable success and reliable failure.
-
3.
Detection and intervention. A runtime monitor reads step-4 hidden states and flags inconsistent trajectories at AUROC 0.97 (quintile) / 0.85–0.88 (median split), degrading gracefully to 0.81 at three runs and saving 29% of compute. A prompting intervention raises convergence () and cuts variance by 28% versus filler (), but is accuracy-neutral by construction. We also ask whether the signal can route test-time compute on a harder benchmark: it modestly beats fixed-sample self-consistency but does not beat a simple output-based baseline, so we report this as an honest negative and leave a deployable router to future work. A single-layer activation-steering attempt gave mixed results, reported as a limitation rather than omitted.
2 Related work
Behavioral consistency in agents. Mehta (2026b) introduced multi-run behavioral consistency as an agent reliability metric on HotpotQA, finding a 32–55 percentage point accuracy gap between consistent and inconsistent runs. Mehta (2026a) extended this to SWE-bench, showing that consistency amplifies outcomes rather than guaranteeing correctness. Self-consistency (Wang et al., 2023) leverages output-level variance via majority voting but does not examine internal representations. We treat consistency as a process-level property and ask whether it has a measurable signature in hidden states.
Probing LLM representations. Hidden states encode truth (Burns et al., 2023; Marks and Tegmark, 2024) and model confidence (Kadavath et al., 2022), and probes can detect incorrect generations from internal states in single-turn settings (Azaria and Mitchell, 2023), including in reasoning models (Zhang et al., 2025). Standard probing asks what a hidden state encodes at one point in processing (Belinkov, 2022); we ask whether representations are stable across independent trajectories, a cross-run relational property that probing classifiers are not built to measure.
Representation engineering. Zou et al. (2023) introduced representation reading and control, and Turner et al. (2023) demonstrated activation steering for behavioral modification. Chen et al. (2025) extracted “persona vectors” encoding character traits, and Lu et al. (2026) identified an “assistant axis” governing default model behavior. We point to another candidate axis: commitment, the degree to which multi-run trajectories collapse to similar internal states.
3 Method
3.1 Setup and terminology
Agent step. We use a ReAct (Yao et al., 2022) agent that iterates Thought Action Observation. One such triple is one step; “step 4” is the fourth triple in a run. A run ends when the agent calls Finish or hits the 25-step cap.
What we extract. At step we take the hidden state at the last output-token position of that step, computed over the cumulative context (system instructions, the question, the prior triples, and the current Thought and Action). The last-token choice follows the single-turn probing convention (Burns et al., 2023; Marks and Tegmark, 2024); we treat it as a convention rather than a proven optimum and flag the comparison against pooled or trajectory-level representations as open.
Activation similarity vs. representational commitment. Activation similarity is the measured quantity (Equation 1, mean cross-run cosine of the last-token hidden state). Representational commitment is the construct it is meant to index. We keep the two terms distinct throughout.
Behavioral (trajectory) consistency. Our target is trajectory consistency, not output agreement. We use two complementary metrics across the 10 runs of a question. The first is the coefficient of variation (CV, standard deviation divided by mean) of step counts. It is scale-invariant, so runs of 12 and 13 steps count as more consistent than runs of 5 and 25 regardless of the mean. The second is action-sequence diversity, the proportion of unique action sequences among runs, which captures trajectory shape. Lower values on both indicate more consistent behavior. The two agree at , a check that CV tracks something real. Output agreement is reported only as a boundary test in Section 4.5.
Agent and task. We deploy Llama-3.1-70B-Instruct (Grattafiori et al., 2024) on HotpotQA (Yang et al., 2018) with Search, Retrieve, and Finish tools. We select 100 validation questions: 50 “easy” (comparison questions with yes/no answers) and 50 “hard” (multi-hop, 2 retrieval steps). Each question is run 10 times at temperature 111 is a moderate setting that yields meaningful behavioral variance; gives identical runs (trivial consistency) and adds excessive noise. A temperature sweep is a natural extension we have not run. with a 25-step cap, giving 988 trajectories.22212 runs excluded for incomplete hidden-state extraction. At step 4 (the primary analysis step), 99 of 100 questions have sufficient data; one question’s runs all terminated by step 3.
Hidden-state extraction. The model runs on 880GB GPUs with pipeline parallelism (10 layers per GPU). At every step we record the hidden state at the last-token position from layers , giving per step and layer .
Activation similarity. For question at step , layer , we compute the mean pairwise cosine similarity across runs:
| (1) |
where is the number of runs with hidden states at step . We report the Pearson correlation between and across questions. At , this design has 80% power to detect (two-tailed ).
Statistical methods and analysis status. We use Pearson and partial Pearson correlations (difficulty and accuracy as covariates), paired - and Wilcoxon tests for the intervention, bootstrap mediation (Preacher and Hayes, 2008), LOOCV AUROC for the monitor, and 10,000-iteration permutation tests with Bonferroni correction over the steplayer grid. We distinguish exploratory from confirmatory analyses. The step-4 / layer-40 signal was discovered on Llama-HotpotQA through a 66-cell steplayer scan (hence the Bonferroni and permutation controls); the Qwen, Phi-3, and StrategyQA experiments were then designed and run with this hypothesis fixed in advance, and are confirmatory on independent data.
4 Results
The core finding is that activation similarity at step 4 predicts trajectory consistency (§4.1). We then show this is not an artifact of timing, difficulty, or shared observations (§4.2–4.5), replicate it across architectures and benchmarks (§4.6–4.7), and show commitment can be both detected at runtime and induced by intervention (§4.8–4.10).
4.1 Activation similarity predicts consistency
Activation similarity at step 4 is negatively correlated with behavioral CV: questions whose hidden states converge across runs behave more consistently. The correlation spans layers 32–80 and peaks at layer 40 (, 95% CI , ; Figure 1). This is a medium effect by Cohen’s convention, and predicting a continuous behavioral measure from a single scalar understates how cleanly it separates questions: the top similarity quartile has lower mean step-count CV than the bottom quartile (). Stronger forms of the signal recur throughout this section (partial , StrategyQA , AUROC up to 0.97).
The peak is robust, not cherry-picked. A 10,000-iteration permutation test is significant at all seven layers from 32 to 80 (; Appendix C), the step-4/layer-40 cell survives Bonferroni correction over all 66 steplayer cells (corrected ; permutation ), and the effect reappears in two other models at different peak layers (Section 4.6).

4.2 Temporal profile
4.3 Controlling for task difficulty
Both activation similarity and CV could be driven by task difficulty. A partial correlation controlling for accuracy and difficulty label strengthens the signal from to (95% CI , ) at layer 40, with all layers 32–80 strengthening (partial : to ; Appendix D). The most natural reading is that difficulty was partly suppressing the relationship rather than driving it; we cannot fully exclude that the covariates also absorb noise, which a held-out test would settle.
4.4 Ruling out simple baselines
We compare hidden-state similarity against simpler predictors of consistency (Table 5, Appendix H). Question length (, ), context size (, ), and step-3 thought length (, ) do not predict CV. A multiple regression (CV similarity + question length + accuracy) yields , with similarity (, ) and accuracy (, ) the only significant predictors.
Observation overlap. The main confound is retrieval: runs that read similar documents will have both similar hidden states and similar behavior. We measure overlap three ways (Jaccard, TF-IDF cosine, search-query overlap; ). The signal partly survives: controlling for document identity it holds (partial , ), and within the most overlapping questions (top TF-IDF quartile, ) it still predicts CV (, ). But it does not survive everything: adding full-text TF-IDF absorbs it (, n.s.). We do not overclaim: “convergent inputs produce convergent states” remains a fair account of much of the naturalistic effect, and the clean test (replaying fixed documents while letting reasoning vary) is future work. The intervention (§4.10) offers partial leverage, changing only the appended prompt while holding context fixed, yet still moving both convergence and CV.
4.5 Boundaries of the signal
Per-run correctness. Linear probes fail to predict per-run correctness from hidden states (AUC 0.34–0.56 across all configurations, including single-turn generation), because correctness here is largely question-determined (64 questions are 10/10 correct, 23 are 0/10). The consistency signal is a between-run relational property, not a within-run absolute one.
Hard vs. easy questions. The signal is carried by easy questions (, ) rather than hard (, ; Figure 7, Appendix F). This null is predicted by the commitment account: if representational commitment encodes the model’s confidence in its current interpretation, orthogonal to whether it is correct, then committed-wrong questions should be representationally indistinguishable from committed-correct ones, and the linear similarity–CV relationship should collapse within hard questions where committed-wrong states dominate.
We test this. Among hard questions we identify three categories: committed-correct (accuracy ), committed-wrong (accuracy , CV ), and uncommitted-wrong (accuracy , CV ). Committed-wrong questions show activation similarity that we cannot distinguish from committed-correct (Llama: vs. , ; Qwen: vs. , ). We note plainly that a non-significant difference is a failure to reject, not evidence of equivalence; a two one-sided test (TOST) against a pre-specified bound is the proper instrument and the CV cutoffs here were chosen from the data, so we treat this as suggestive rather than confirmatory (Figure 2; Appendix G). Read as confidence rather than correctness, commitment behaves like a well-calibrated classifier that can be confidently wrong (Guo et al., 2017).
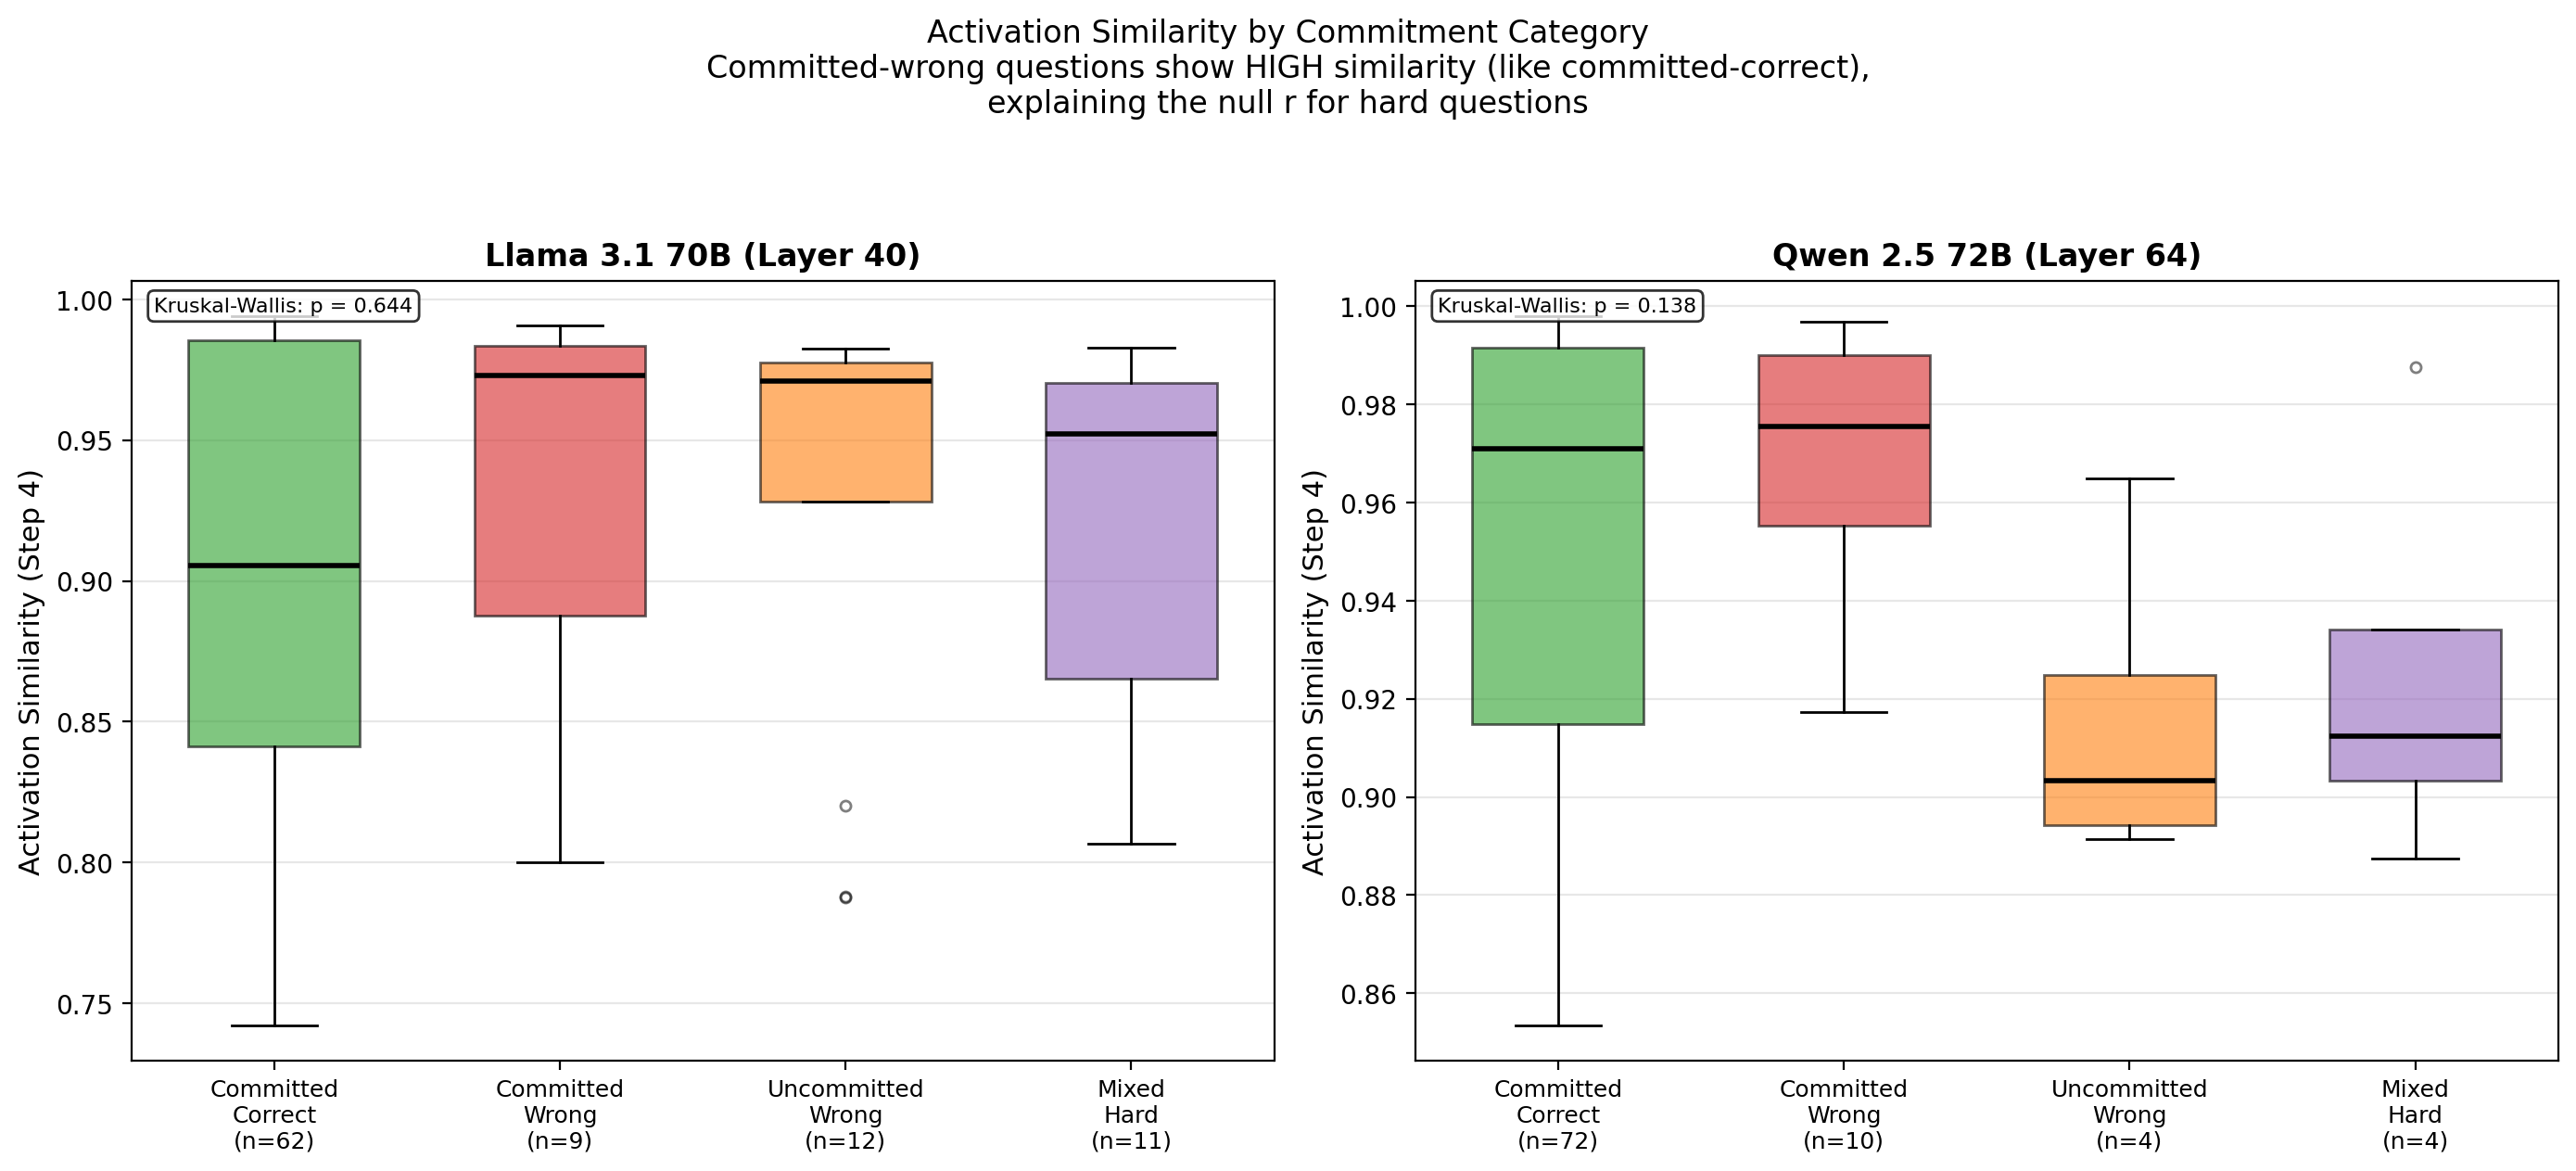
Answer agreement. Activation similarity does not predict cross-run answer agreement (, ). The signal tracks how agents reach answers, not whether the answers match, consistent with its trajectory-level target (§3.1). A complementary between-question prototype-distance measure recovers a signal among hard questions (, ; Appendix I).
4.6 Cross-architecture validation on HotpotQA
We replicate on Qwen-2.5-72B (Yang et al., 2024) (matched depth/dimension, different architecture and training) and Phi-3-Medium-14B (Abdin et al., 2024) (40 layers, ), running all 100 questions 10 trials per model (988 Llama, 998 Qwen, 1,000 Phi-3 trajectories).
The negative correlation replicates in both. Qwen peaks more strongly ( at layer 64, 95% CI , ). Phi-3 replicates at step 4 ( at layer 16, 95% CI , , ), with its strongest signal one step later at step 5 (, ), consistent with the smaller model needing an additional step before settling. The peak layer differs by model (Llama 50% depth, Qwen 80%, Phi-3 40%), so commitment appears across architectures but its depth profile is not fixed (Figure 3; full results and a layer-0 artifact discussion in Table 4, Appendix E).

4.7 Cross-benchmark generalization on Llama: StrategyQA
Holding the model fixed at Llama, we replicate on StrategyQA (Geva et al., 2021) (implicit multi-step reasoning, yes/no answers; 50 questions balanced by answer, 2 decomposition steps, 10 runs each, ). The signal replicates strongly at step 3: (95% CI , ), spanning all layers 8–80 (, , plateauing across layers 56–72). The one-step-earlier peak matches the shorter reasoning chains (mean 5.1 vs. steps). Partial correlation controlling for accuracy is unchanged (). By step 4 the signal has dissipated (, ), consistent with commitment having largely occurred earlier (Appendix L). The two replication axes (architecture on HotpotQA, benchmark on Llama) are anchored at Llama-HotpotQA; the two missing cells (Qwen/Phi-3 on StrategyQA) are a natural extension.
4.8 Detecting commitment at runtime
Can a monitor read commitment at runtime? We train a logistic classifier to label a question as consistent or inconsistent from its step-4 hidden states (LOOCV; five hidden-state features against surface baselines; full results in Appendix K).
Hidden-state features discriminate well. A per-layer similarity profile reaches AUROC 0.97 on Llama under quintile labeling (which drops the ambiguous middle 60% and is the easier task); under a stricter median split the best feature still reaches 0.85 on Llama and 0.88 on Qwen, and we report both. The fair surface baseline, question length (the only feature available before the run completes), stays near chance (0.52–0.65); other surface statistics are post-completion and not usable by a step-4 monitor (Appendix K). Accuracy degrades gracefully with fewer runs (: ), and an early-exit simulation recovers 29% of trajectory compute.
4.9 Does commitment help allocate test-time compute?
Because the signal flags whether an agent has settled, it might tell us where extra samples are worth spending. We asked whether this gives a deployable way to route self-consistency; the honest answer is not yet. On HotpotQA the question is moot: the agent is near ceiling (about ), so self-consistency adds almost nothing. We therefore tested on MuSiQue (multi-hop QA, 150 questions, 10 runs each), where the same Llama-3.1-70B agent is far from ceiling ( single-run) and self-consistency helps ( points overall, on inconsistent questions). Two limits emerge. When commitment is read matters: MuSiQue trajectories run 15–22 steps, so the fixed step-4 reading is too early and is uncorrelated with where resampling helps. A trajectory-relative reading (the final step) recovers predictive value ( with answer agreement). Even then the payoff is modest. Spending more samples on uncommitted questions beats fixed-sample self-consistency by – points at equal compute (cross-validated), but output-based adaptive-consistency (Aggarwal et al., 2023), which stops once answers agree, matches or beats it past three samples. The hidden-state signal wins only at very low budgets (about two samples). Commitment is therefore a useful measurement of when an agent has settled, but reading the outputs is at least as good for routing compute. A direct hidden-state-gated router, and whether the signal pays off on weaker models, are left to future work.
4.10 Inducing commitment by intervention
If representational commitment is linked to behavioral consistency, inducing it should reduce downstream variance. We test a prompting intervention at step 3 (one step before the usual juncture), appending an instruction to commit to a reasoning strategy before continuing (Appendix O). The control is the standard ReAct agent. Because the commitment prompt adds tokens, we add a filler control: a semantically neutral prompt of matched token length at the same step, isolating commitment framing from token count. We stress that this is a non-surgical instrument: the commitment prompt changes tokens, imperative voice, and strategy framing at once, and the filler controls only for token count, not for which specific feature does the work.
We run all three conditions on 100 HotpotQA questions with 10 runs each on Llama-3.1-70B (); Table 1 reports the results. Accuracy uses corrected matching (substring or token-level F1 against gold).
| Metric | Control | Filler | Commitment |
|---|---|---|---|
| Behavioral CV | 0.112 | 0.132 | 0.095 |
| Action seq. diversity | 0.250 | 0.295 | 0.223 |
| Accuracy† | 0.923 | 0.900 | 0.908 |
| Pairwise comparisons (paired -test; Holm-adjusted ): | |||
| Filler vs. Commitment (token-controlled) | |||
| CV reduction | 28% (, , Holm ) | ||
| Diversity reduction | 24% (, ) | ||
| Accuracy difference | n.s. () | ||
| Control vs. Commitment (net over standard agent) | |||
| CV reduction | 15% (, , Holm , n.s.) | ||
| Control vs. Filler | |||
| CV change | +18% (, , n.s.) | ||
The filler does not reduce CV relative to control (), so extra tokens alone do not help. The commitment prompt cuts CV by 28% relative to filler (paired , , , Holm ; Wilcoxon ): commitment framing, not token count, drives the effect (Table 1). Action diversity shows the same pattern (24%, , ). Reported plainly: the deployer-relevant net effect over the standard agent (Control vs. Commitment) is 15% (, ), which does not survive Holm correction over the three CV tests. No condition changes accuracy (all pairwise ). This matches the correctness-agnostic view (§4.5): inducing commitment makes the model adhere more firmly to whatever interpretation it has, so mostly-correct items get more consistently correct and mostly-wrong items more consistently wrong, cancelling in aggregate accuracy.
Representational-level evidence. For matched questions, all three conditions produce identical similarity trajectories through step 3 (the intervention point), then diverge at step 4 (the time-locking is shown in Appendix N, Figure 14): commitment highest (0.995), filler intermediate (0.979), control lowest (0.922). Commitment increases convergence beyond token overlap ( vs. filler, , , layer 40). The filler’s intermediate similarity reflects lexical overlap that does not behave like commitment: it raises activation similarity (0.922 0.979) yet worsens CV (0.112 0.132). The filler is thus an existence proof that raw similarity can rise from token sharing without producing commitment’s behavioral signature.

Mediation analysis. A bootstrap mediation analysis (Preacher and Hayes, 2008) (5,000 iterations, matched pairs) gives a significant indirect path through activation similarity (, 95% CI , ) and a non-significant, oppositely-signed direct path (, n.s.). This is inconsistent mediation (suppression), not clean full mediation: the total effect is dominated by the indirect path. We therefore claim only that the representational shift statistically accounts for the variance reduction, and leave the small opposing direct path unexplained.
The effect concentrates on originally-inconsistent questions (, ), and a question-level decomposition confirms commitment never degrades already-correct performance (88/89 consistent-correct stay so; Appendix N). The single-layer steering attempt (Appendix A) gave mixed results, suggesting commitment is distributed across layers and steps. Table 9 (Appendix M) consolidates all results.
5 Discussion
Why name this failure mode. Premature commitment is invisible to the usual checks: it produces internally consistent behavior, so final-score evaluation sees only the answer, and cross-run agreement metrics see only whether runs match, not whether they match for the right reasons. A diagnostic read from internal states sees the convergence signature directly, but on its own cannot separate committed-wrong from committed-correct (§4.5), which is why we pair it with a correctness check rather than use it alone.
Relation to representation directions and existing signals. Recent work finds linear directions for persona (Chen et al., 2025), default behavior (Lu et al., 2026), and truth (Marks and Tegmark, 2024). Commitment may be another, but unlike those mostly static axes it emerges during multi-step interaction and sharpens at a commitment juncture, a task-state variable rather than a fixed property of the weights (Appendix J), and it is orthogonal to correctness (§4.5), unlike truth directions. It also differs from self-consistency (Wang et al., 2023) (it reads hidden states, not output agreement, and fires at step 4 rather than post-hoc) and from logit entropy (within-run and pointwise, whereas commitment is cross-run and relational). The juncture itself adapts to task and architecture (StrategyQA peaks a step earlier; peak layers differ across models), and the hard-question null follows: commitment says when behavior will be stable, not when it will be correct.
Operational use. A signal that does not track correctness is still useful, because it answers a question accuracy cannot: has the agent settled? On committed inputs, agreement across runs stops being evidence of correctness; a confidently-wrong agent looks as consistent as a correct one. A deployer should defer such cases to an external verifier or human rather than resample. On unsettled inputs, resampling can help (§4.9), and the monitor can also early-exit committed inputs to save compute (§4.8). We do not, however, recommend the commitment prompt as a generic accuracy lever: by construction it amplifies whichever trajectory the agent is already on.
Limitations. We validate the core diagnostic on three models (14B–72B) across two reasoning benchmarks (HotpotQA, StrategyQA), and use MuSiQue only as a harder stress test for routing; code, math, and embodied tasks remain untested, and all runs use one temperature. CV and action diversity are coarse proxies. Mechanistically, the disentanglement from observation overlap is only partial (§4.4), the mediation is inconsistent (§4.10), single-layer steering was mixed (Appendix A), and we assume representational faithfulness, though chain-of-thought can be unfaithful (Turpin et al., 2023) (our claim is predictive, not explanatory). All models are instruction-tuned.
Future directions. The most informative next steps are (1) a replayed-observation experiment that holds retrieved documents fixed while letting reasoning vary, to cleanly separate processing from retrieval; (2) equivalence testing (TOST) for the correctness-agnostic claim; and (3) a hidden-state router that beats output-based adaptive consistency, not just fixed-sample self-consistency (§4.9). Multi-layer steering and circuit tracing at divergence points (Zou et al., 2023; Ameisen et al., 2025) are natural mechanistic follow-ups.
6 Conclusion
We introduced representational commitment: cross-run hidden-state convergence that diagnoses when an agent has settled. Across models and benchmarks, the signal predicts trajectory consistency but not correctness: committed-wrong and committed-correct runs share the same convergence signature. The result is a compact diagnostic for a hidden process failure, with clear limits: useful for measurement and variance reduction, but not yet a better compute router than output agreement.
References
- Phi-3 technical report: a highly capable language model locally on your phone. arXiv preprint arXiv:2404.14219. Cited by: §4.6.
- Let’s sample step by step: adaptive-consistency for efficient reasoning and coding with LLMs. In Proceedings of the 2023 Conference on Empirical Methods in Natural Language Processing, Cited by: §4.9.
- Circuit tracing: revealing computational graphs in language models. Anthropic Research Blog. Cited by: §5.
- The internal state of an LLM knows when it’s lying. arXiv preprint arXiv:2304.13734. Cited by: §2.
- Probing classifiers: promises, shortcomings, and advances. Computational Linguistics 48 (1), pp. 207–219. Cited by: §2.
- Discovering latent knowledge in language models without supervision. arXiv preprint arXiv:2212.03827. Cited by: §2, §3.1.
- Persona vectors: monitoring and controlling character traits in language models. arXiv preprint arXiv:2507.21509. Cited by: §2, §5.
- Unsupervised cross-lingual representation learning at scale. In Proceedings of the 58th Annual Meeting of the Association for Computational Linguistics, pp. 8440–8451. Cited by: Appendix J.
- Did Aristotle use a laptop? A question answering benchmark with implicit reasoning strategies. Transactions of the Association for Computational Linguistics 9, pp. 346–361. Cited by: §4.7.
- The Llama 3 herd of models. arXiv preprint arXiv:2407.21783. Cited by: §3.1.
- On calibration of modern neural networks. In International Conference on Machine Learning, pp. 1321–1330. Cited by: §4.5.
- Language models (mostly) know what they know. arXiv preprint arXiv:2207.05221. Cited by: §2.
- The assistant axis: situating and stabilizing the default persona of language models. arXiv preprint arXiv:2601.10387. Cited by: §2, §5.
- The geometry of truth: emergent linear structure in large language model representations of true/false datasets. arXiv preprint arXiv:2310.06824. Cited by: §2, §3.1, §5.
- Consistency amplifies: how behavioral variance shapes agent accuracy. arXiv preprint arXiv:2603.25764. Cited by: §1, §2.
- When agents disagree with themselves: measuring behavioral consistency in LLM-based agents. arXiv preprint arXiv:2602.11619. Cited by: §1, §2.
- The linear representation hypothesis and the geometry of large language models. arXiv preprint arXiv:2311.03658. Cited by: Appendix J.
- Asymptotic and resampling strategies for assessing and comparing indirect effects in multiple mediator models. Behavior Research Methods 40 (3), pp. 879–891. Cited by: §3.1, §4.10.
- Activation addition: steering language models without optimization. arXiv preprint arXiv:2308.10248. Cited by: §2.
- Language models don’t always say what they think: unfaithful explanations in chain-of-thought prompting. In Advances in Neural Information Processing Systems, Cited by: §5.
- Self-consistency improves chain of thought reasoning in language models. arXiv preprint arXiv:2203.11171. Cited by: §2, §5.
- Chain-of-thought prompting elicits reasoning in large language models. Advances in Neural Information Processing Systems. Cited by: §1.
- Qwen2.5 technical report. arXiv preprint arXiv:2412.15115. Cited by: §4.6.
- HotpotQA: a dataset for diverse, explainable multi-hop question answering. arXiv preprint arXiv:1809.09600. Cited by: §3.1.
- ReAct: synergizing reasoning and acting in language models. arXiv preprint arXiv:2210.03629. Cited by: §1, §3.1.
- Reasoning models know when they’re right: probing hidden states for self-verification. arXiv preprint arXiv:2504.05419. Cited by: §2.
- Representation engineering: a top-down approach to AI transparency. arXiv preprint arXiv:2310.01405. Cited by: Appendix A, §2, §5.
Appendix A Preliminary steering experiment
If representational commitment has a directional signature in activation space, it should be possible to steer toward more committed states directly. For 5 questions we extract a “commitment direction” as the difference between mean hidden states of committed (consistent-correct) and uncommitted (inconsistent) runs at step 4, layer 40, then add it (scaled by ) to hidden states during inference. Results are mixed: on 2/5 questions steering reduced step-count CV (0.310.18 and 0.270.12), while on 3/5 it had no effect or slightly increased variance, occasionally disrupting coherent reasoning. We read this as an asymmetry: the prompting intervention works because it shapes what the model generates at step 3, affecting hidden states across all layers in later forward passes, whereas single-layer steering at step 4 acts after the juncture and in one subspace, both late and narrow. Multi-layer, multi-step steering (Zou et al., 2023) or representation finetuning may be needed for reliable control.
Appendix B Temporal profile

Appendix C Permutation test results
| Layer | Param. | Perm. | |
|---|---|---|---|
| 32 | |||
| 40 | |||
| 48 | |||
| 56 | |||
| 64 | |||
| 72 | |||
| 80 |
Appendix D Partial correlation results
| Layer | Raw | Raw | Partial | Partial |
|---|---|---|---|---|
| 32 | ||||
| 40 | ||||
| 48 | ||||
| 56 | ||||
| 64 | ||||
| 72 | ||||
| 80 |
Appendix E Full cross-model layer-wise results
Table 4 reports the full layer-wise correlations at step 4 for all three models. Phi-3 layers are mapped to proportionally equivalent depths (e.g., Phi-3 layer 16 40% depth).
Layer-0 artifact. The positive correlation at layer 0 ( Llama, Qwen) reflects input-level similarity: at the embedding layer hidden states are set by the (identical) input tokens, so higher similarity indexes shorter, simpler questions that also tend to be more consistent. Phi-3 lacks this pattern (, ), likely due to its different tokenizer.
| Llama 3.1 70B | Qwen 2.5 72B | Phi-3 14B | ||||
| Layer | ||||||
| 0 | ||||||
| 8 | ||||||
| 16 | ||||||
| 24 | ||||||
| 32 | ||||||
| 40 | ||||||
| 48 | – | – | ||||
| 56 | – | – | ||||
| 64 | – | – | ||||
| 72 | – | – | ||||
| 80 | – | – | ||||
| Sig. layers | 11 / 11 | 11 / 11 | 4 / 6 | |||
| Peak | (L40) | (L64) | (L16) | |||
| Accuracy | 0.70 | 0.81 | 0.69 | |||
Figure 6 shows the temporal profile across all three models, each at its peak layer.

Appendix F Hard vs. easy breakdown
Figure 7 shows the step-4 layer-wise correlation split by question difficulty. On easy questions the similarity–CV relationship is strong and significant at every non-embedding layer ( to ); on hard questions it collapses to near zero ( at all layers). This is the pattern predicted by the correctness-agnostic account in Section 4.5: within hard questions, committed-wrong states are common and saturate similarity regardless of behavior. The positive layer-0 bar in both panels is the input-embedding artifact discussed in Appendix E.

Appendix G Commitment category visualization
Figure 8 shows a t-SNE of step-4 hidden states (layer 40) for all 100 questions, colored by commitment category (PCA to 50D, then t-SNE to 2D, perplexity 30). Each point is one question’s mean hidden state across 10 runs. Committed-correct (green) and committed-wrong (red) occupy overlapping regions; uncommitted-wrong (orange) are more diffuse. The t-SNE is qualitative illustration only, not inferential evidence of equivalence (see §4.5).

Appendix H Baseline predictors of behavioral CV
| Predictor | ||
| Hidden-state sim. (S4, L40) | ||
| TF-IDF obs. similarity‡ | ||
| Jaccard doc. similarity‡ | ||
| Search query overlap‡ | ||
| Accuracy (correct rate)† | ||
| Mean total thought length† | ||
| Mean search actions† | ||
| Mean step count† | ||
| Question word count | ||
| Question char count | ||
| N context documents | ||
| Mean thought length (S3) |
Appendix I Prototype distance signal for hard questions
The within-run measure captures cross-run convergence within a question; we also consider a between-question measure: each hard question’s distance from the hard-question centroid in activation space (cosine similarity of its mean step-4, layer-32 hidden state to the centroid). Questions further from the centroid tend to be more consistent (, permutation , 95% CI , , ).333Six of 50 hard questions excluded because no run produced step-4 hidden states (all terminated in 3 steps). Excluded and included questions do not differ in accuracy () but do differ in CV (): short trajectories mechanically have low step-count variance. Atypical hard questions, whose representations diverge from the prototype, may have distinctive structure that narrows viable reasoning paths early, producing convergent trajectories despite being hard. Variance of pairwise similarity (, ), trajectory slope (), and within-run temporal stability (, ) did not reach significance.

Appendix J Commitment as a linear direction
We provide geometric evidence that commitment is well-described by a single linear direction (Park et al., 2023). Defining at layer 40 (Llama peak), it nearly coincides with the first principal component of the mean hidden states (; PC1 explains 53% of variance). Projecting all 100 questions onto correlates with behavioral CV (, ; easy ; hard ). The direction also aligns with the easy–hard difference vector (). In Qwen at layer 64 the projection correlation strengthens (); a Procrustes-aligned cross-model comparison yields modest agreement (; raw PCA-space ), suggesting both models develop a commitment axis whose orientation is architecture-specific, analogous to cross-lingual representation alignment where similar functional structure coexists with non-isometric geometry (Conneau et al., 2020).

Appendix K Consistency prediction: full results
Table 6 reports the full evaluation across features, models, and labeling schemes.
| Llama 3.1 70B | Qwen 2.5 72B | |||
| Feature | Quintile | Median | Quintile | Median |
| A: Sim (L40) | .93 | .55 | .87 | .86 |
| B: Sim (avg) | .95 | .58 | .90 | .88 |
| C: Layer profile | .97 | .73 | .89 | .88 |
| D: Trajectory | .74 | .55 | .77 | .79 |
| E: PCA (L40) | .94 | .85 | .93 | .67 |
| Question length (pre) | .52 | .60 | .65 | .57 |
| Context docs (pre)§ | .92 | .94 | .93 | .94 |
| Thought length (post)§ | .90 | .96 | 1.00 | 1.00 |


Fewer runs, and a practical recipe. AUROC degrades gracefully with run budget : achieves (95% CI ), reaches , reaches , vs. at (Figure 12). At , precision at recall . An early-exit simulation (5-fold threshold selection) reaches 70.2% accuracy (pp over majority) while saving 29% of compute. For a new task, a practitioner still needs a small calibration pass: the peak step tracks chain length (a sweep over steps 2–6), and the per-layer similarity profile (feature C) removes the need to pick a single peak layer, though the layer set to sample is architecture-dependent; is the practical minimum run budget.

Appendix L StrategyQA cross-benchmark results
Table 7 reports layer-wise correlations at step 3 (the peak step) for Llama-3.1-70B on StrategyQA (). All layers 8–80 are significant at ; partial correlations controlling for accuracy are virtually unchanged given the high accuracy (93.2%).
| Layer | Raw | Raw | Partial | Partial |
|---|---|---|---|---|
| 0 | – | – | – | – |
| 8 | ||||
| 16 | ||||
| 24 | ||||
| 32 | ||||
| 40 | ||||
| 48 | ||||
| 56 | ||||
| 64 | ||||
| 72 | ||||
| 80 |
| HotpotQA | StrategyQA | |
| Task type | Multi-hop retrieval | Implicit reasoning |
| Answer type | Span extraction | Yes/no |
| (questions) | 100 | 50 |
| Runs per question | 10 | 10 |
| Mean chain length | steps | 5.1 steps |
| Accuracy | 70% | 93.2% |
| Peak step | 4 | 3 |
| Peak layer | 40 | 72 |
| Peak | ||
| 95% CI | ||
| Peak | ||
| Partial | ||
| Sig. layers | 7 / 11 | 10 / 11 |

Appendix M Summary of all results
| Model | Benchmark | Peak step | Peak layer (% depth) | Peak | Partial | AUROC | CV red. | |
|---|---|---|---|---|---|---|---|---|
| Llama-3.1-70B | HotpotQA | 100 | 4 | 40 (50%) | 0.97 | 28% | ||
| Qwen-2.5-72B | HotpotQA | 100 | 4 | 64 (80%) | – | 0.93 | – | |
| Phi-3-Medium-14B | HotpotQA | 100 | 5 | 16 (40%) | – | – | – | |
| Llama-3.1-70B | StrategyQA | 50 | 3 | 72 (90%) | – | – |
Appendix N Intervention details
Interpreting the three comparisons. The filler condition trends toward higher variance than control (CV vs. , , , ), suggesting any prompt insertion at step 3 disrupts the natural trajectory. The commitment prompt overcomes this disruption and tightens beyond baseline (15% net CV reduction, , , Holm ). Reading the three together: (i) Filler vs. Commitment (28%, , Holm ) isolates framing from token count; (ii) Control vs. Commitment (15%, , Holm ) is the net behavioral effect over the standard agent, which does not survive correction; (iii) Control vs. Filler (, n.s.) is the disruption cost.
Time-locking. Figure 14 shows that the three conditions trace identical activation-similarity curves through step 3 (the intervention point) and only separate at step 4. There is no pre-existing gap: the divergence appears one step after the prompt, consistent with the prompt shifting representation at the commitment juncture rather than reflecting a baseline difference between the question subsets.

Stratified analysis. The effect concentrates on originally-inconsistent questions (top CV tertile, ): filler-vs-commitment (, ), while already-consistent questions show a smaller, non-significant trend (, ).
Question-level decomposition. Classifying each question under both conditions into consistent-correct (accuracy ), consistent-wrong (accuracy , majority frequency ), and inconsistent yields a stable 33 transition matrix: 88 of 89 consistent-correct questions stay so under commitment, all 4 consistent-wrong stay so, and none move from consistent-correct to consistent-wrong. The commitment intervention never degrades already-correct performance.
Figure 15 relates CV reduction to accuracy change at the question level. The negative correlation (, ) shows commitment amplifies the existing trajectory: questions where CV dropped most tended to show slight accuracy decreases, consistent with the correctness-agnostic commitment signal (§4.5).

Appendix O Intervention prompt text
Commitment prompt (appended at step 3): “Based on the evidence you have gathered so far, commit to a specific reasoning strategy for solving this question. State your committed strategy clearly in your next Thought, then follow through with it. Do not change strategies or start over; build on what you have learned.”
Filler prompt (appended at step 3, matched token length): “Please continue with the task as you normally would. Take the time you need to work through the problem. Consider the information you have gathered and proceed with your next step in whatever way seems most appropriate to you. There is no particular urgency; work at your own pace and follow your reasoning.”