Chemical hints of Population III stars from silicon abundances in massive galaxies
The formation of massive galaxies remains a fundamental question in astrophysics, with recent JWST observations suggesting that intense star formation occurred earlier than previously expected. We used the prototypical massive relic galaxy NGC 1277 as a fossil record to probe the chemical signatures of early star formation. With a stellar mass of M⊙ and a compact structure (half-light radius of kpc), NGC 1277 is representative of massive relic galaxies—systems that formed rapidly at high redshifts (‘red nuggets’ at ) and have since undergone largely passive evolution, preserving the imprint of their earliest stellar populations. Using deep near-infrared spectroscopy, we identified unusually strong silicon (Si) absorption features in this galaxy. We measure [Si/Fe]= and [Mg/Fe]=, corresponding to a significantly enhanced silicon-to-magnesium ratio ([Si/Mg]=), which cannot be reproduced by current stellar population models or typical core-collapse supernova yields. This enhancement suggests a contribution from very massive, metal-poor progenitors during the earliest phases of star formation. Such conditions are consistent with nucleosynthetic yields from pair-instability supernovae or other enrichment channels associated with extremely massive stars, whose chemical signatures are expected to remain less diluted in systems like NGC 1277 due to their rapid formation timescales and minimal late-time accretion. This result provides rare chemical evidence of early massive-star enrichment preserved in a local relic galaxy and opens a new observational window into the chemical evolution of the Universe.
Key Words.:
galaxies – near-infrared – stellar populations – population III stars1 Introduction
Recent discoveries with the James Webb Space Telescope (JWST) have revolutionised our understanding of the early formation of massive galaxies, revealing massive, quiescent red galaxies at unexpectedly high redshifts (7-10; Duan et al. 2024; Weibel et al. 2025). These findings suggest that the first phase of massive galaxy formation may have occurred much earlier than previously thought, potentially pushing the initial burst of star formation into an epoch when the first generation of stars may have contributed significantly to the chemical enrichment of the Universe. This emerging picture aligns with the increasingly accepted two-phase formation scenario for massive galaxies (Oser et al., 2010; van Dokkum and Conroy, 2010). In this modern framework, the first phase involves a rapid and intense formation of compact, massive galaxies, commonly referred to as ‘red nuggets’, occurring by (Damjanov et al., 2009). Following this brief (1 Gyr) initial phase, these systems undergo substantial evolutionary growth over cosmic time, primarily in size, and to a lesser extent in mass, through mergers and gas accretion. The giant early-type galaxies (ETGs) observed in the local Universe are the massive end products of this process. Crucially, the compact red nugget formed during the initial phase with the earliest generation of stars is not destroyed but can survive, remaining buried in the central regions of ETGs. Subsequent star formation from recycled and accreted material was layered over this core, making it increasingly difficult to disentangle and reconstruct the pristine chemical conditions of the first phase of galaxy formation.
Because merger-driven evolution in the second phase is a stochastic process, it is believed that, in very rare instances, some of these high-z red nuggets remained untouched, mostly avoiding the subsequent accretion that characterises this second phase. They thus survived in their compact state until nowadays (Naab et al., 2009). These ancient, undisturbed systems are known as ‘massive relic galaxies’ or ‘local red nuggets’ (Trujillo et al., 2009; Ferré-Mateu et al., 2017; Spiniello et al., 2024). What makes these galaxies particularly valuable is that they retain the structural and dynamical properties of their high-redshift counterparts, preserving key imprints of their early formation history.
Beyond their structural properties, massive relic galaxies offer a rare window into the chemical enrichment processes that took place during the earliest phases of galaxy buildup. Because their stellar populations formed rapidly and have remained largely undisturbed, their chemical abundances can retain signatures of the nucleosynthetic processes that took place in the earliest stage of their formation. In this sense, relic galaxies can be viewed as ‘chemical fossils’, allowing us to probe the nature of the first generations of stars through their imprint on later stellar populations.
Identifying relic systems is challenging due to their extreme rarity (Quilis and Trujillo, 2013), but a handful of confirmed examples exist. Among them, NGC 1277 stands out as the prototypical case. First noted for hosting one of the most massive supermassive black holes known (van den Bosch et al., 2012; Ferré-Mateu et al., 2015), NGC 1277 is a massive (MM⊙), extremely compact (R kpc), rapidly rotating system whose internal structure and stellar population properties closely resemble the compact objects at z (Trujillo et al., 2014; Ferré-Mateu et al., 2017). Surprisingly, it is strikingly deficient in dark matter (Comerón et al., 2023). The unique evolutionary history of NGC 1277 is further supported by its remarkably old and metal-rich globular cluster system, which lacks the typical blue, metal-poor subpopulation often associated with later accretion events (Beasley et al., 2018).
Chemical abundance ratios provide key insights into the star formation histories (SFHs) of galaxies. Since different elements are produced by stars of varying masses and lifetimes, their abundance ratios can act as cosmic clocks, tracing the timescales of star formation (Carretero et al., 2004; Baumgartner et al., 2005). In particular, -elements (such as Mg and Si) are synthesised in massive stars and ejected through core-collapse supernovae (CCSNe), while Fe is primarily contributed by Type Ia supernovae (SNe Ia) over timescales 1 Gyr. Therefore, these abundance ratio measurements serve as a crucial diagnostic for understanding how rapidly a galaxy formed the bulk of its stellar populations. However, to date, the assessment of -enhancement in massive galaxies, in particular massive relic ones, has largely relied on measurements of Mg, which is the primary tracer used in optical studies. While Mg plays a key role, it is not the sole contributor to a galaxy’s overall -enhancement. Moreover, it is well established that, unlike in the Milky Way, the various -elements in massive galaxies are not enhanced in lockstep (Vazdekis et al., 1997). Given that different -elements are produced in different proportions by various nucleosynthetic channels and in stars of different masses, constraining multiple -elements is necessary for a deeper understanding of chemical enrichment history and the nature of the stellar populations responsible for it.
Unfortunately, constraining certain -elements, such as Si or O, remains challenging in the optical spectral window, as there are no individual absorption features with strong sensitivity to these elements that can be properly measured (see e.g. Johansson et al. 2012). This limitation is particularly pronounced in pressure-supported systems such as massive galaxies, which exhibit high velocity dispersions that significantly broaden and smear the observed spectral features. A prime example is NGC 1277, whose central region reaches a velocity dispersion of (Trujillo et al., 2014) .
The near-infrared (NIR) spectral range offers a promising alternative, as it contains prominent absorption features for several -elements, including Si, as well as iron-peak elements. By exploiting these features, it becomes possible to access strong and relatively clean diagnostics of elements that are otherwise difficult to constrain in the optical, providing complementary insight into the chemical enrichment history of massive galaxies. In particular, silicon exhibits prominent absorption features in the NIR, making it especially well suited for abundance studies in this wavelength range. In this work, we used deep NIR spectroscopy to investigate the chemical abundances of the massive relic galaxy NGC 1277. Our goal was to explore whether its abundance patterns provide insight into the nature of the earliest stellar populations and the chemical conditions present during the initial phase of galaxy formation.
This paper is organised as follows. In Sect. 2 we describe the observational data, including the NIR spectroscopy of NGC 1277 and the comparison sample of massive ETGs. Section 3 presents the stellar population synthesis (SPS) models used to interpret the spectral features, while Sect. 4 introduces the supernova (SN) yield models adopted to explore the origin of the observed abundance patterns. The measurement of spectral indices is detailed in Sect. 5, followed by the estimation of elemental abundances in Sect. 6. Our main observational results are presented in Sect. 7. In Sect. 8 we discuss the implications of the derived abundance ratios in the context of nucleosynthetic enrichment and galaxy formation, and we summarise our main conclusions in Sect. 9.
2 Samples and data
2.1 NGC 1277
For this study, we utilised deep spectroscopic observations of the prototypical massive relic galaxy NGC 1277, targeting the J and H bands in the NIR. The data were obtained using the EMIR, the NIR multi-object spectrograph at the 10.4 m Gran Telescopio de Canarias (GTC), under programme GTC3-17B (PI: M. Beasley). Observations were conducted over five nights in 2017, using a 0.6′′ wide long-slit aligned along the major axis of the galaxy.
Light was dispersed using the J and H grisms, covering wavelength ranges of 1.2-1.3 m and 1.5-1.8 m, with spectral resolutions of and , respectively. An ABBA nodding pattern with A and B positions offset by 90′′ was employed to enable accurate sky subtraction. Each 120 s exposure was repeated across multiple cycles, resulting in 48 exposures in J (12 ABBA cycles) and 36 exposures in H (9 cycles). To correct for telluric absorption, A0V and F- and G-type standard stars were observed throughout the observing run. Telluric correction was then performed using the Molecfit software (Smette et al., 2015; Kausch et al., 2015), which fits synthetic atmospheric transmission models to the observed stellar spectra. Telluric corrections were applied row by row, accounting for molecular absorption features such as H2O, CO2, and CH4 (see Appendix A for more details).
Due to degradation introduced by EMIR dome flats, flat-fielding was omitted. This had no impact on the analysis since the extraction focused on a small 18-pixel region around the photometric centre of the galaxy, where large-scale flat-field effects are negligible. Bad pixels and cosmic rays were removed using the L.A.Cosmic routine (van Dokkum, 2001). Wavelength calibration was performed using OH airglow lines, and in the J band, Xe arc lines were used to supplement calibration at wavelengths 12,000 Å where OH coverage was sparse. The spectra were geometrically rectified by aligning the spatial centroid of each column with the galaxy centre. Co-addition of the 2D spectra and standard deviation maps was performed using the IRAF imcombine task. The accuracy of the standard deviation maps was validated by measuring noise levels in continuum windows, yielding scale factors of 1.03 (J) and 1.00 (H), indicating consistency without the need for rescaling.
Final 1D spectra were extracted symmetrically about the galaxy centre using a 18-pixel aperture (corresponding to 1 , or 1.2 kpc). We achieved signal-to-noise ratios (S/Ns) of 160 Å-1 in the J band and 70 Å-1 in the H band, which are sufficient for reliable stellar population analysis (Eftekhari et al., 2021). We derived the radial velocity and velocity dispersion of the extracted spectra within 1 using the pPXF code (Cappellari, 2023) in combination with the E-MILES SPS models. These kinematic parameters were used to shift the spectra to the rest frame and to convolve the two bands to a common velocity dispersion of km s-1 (the highest value in the central regions).
2.2 Massive ETGs
As a comparison sample, we used observations of a sample of massive ETGs from La Barbera et al. (2019), consisting of seven nearby ETGs. All galaxies in this sample lie at the high-mass end of the ETG population, with central stellar velocity dispersions in the range of 280–320 km s-1. Five are brightest cluster galaxies while two others are satellites. The data of these galaxies consist of high-S/N spectra ( 170 Å-1 in optical) from the X-shooter spectrograph on the Very Large Telescope (VLT) (Vernet et al., 2011), covering a wide wavelength range from the ultraviolet (3000 Å) to the NIR (2.5 m), with a spectral resolution of in the NIR arm. 1D spectra were extracted along the slit after carefully rectifying and combining 2D exposures.
To enable a direct comparison with NGC 1277, we constructed a stacked spectrum from the sample with two different extractions: one was extracted within an aperture of 1.2 kpc, i.e. matching the central aperture of NGC 1277; the other was within 1 Re. The effective radius adopted corresponds to the bulge component of the galaxies, with an average value of R 3.9 kpc (see Appendix C of La Barbera et al. 2019). To ensure a consistent spatial sampling, spectra were extracted within a width of 1.3” (1.65 kpc) around the photometric centre of each galaxy, equivalent to 1.5 times the mean seeing full-width at half maximum of the observations. All extracted spectra were re-binned adaptively in the dispersion direction to achieve a uniform minimum S/N of 50 across the NIR wavelength range, ensuring reliable measurement of absorption features. The resulting stacked spectrum serves as a representative benchmark for typical massive ETGs in the local Universe.
3 Stellar population synthesis models
3.1 Updated E–MILES
We employed the updated E-MILES SPS models (Röck et al. 2015, 2016; Vazdekis et al. 2016; Vazdekis et al. in prep.) to interpret the observed spectral features. These models extend into the NIR by both the original (Cushing et al., 2004; Rayner et al., 2009) and the Extended IRTF (E-IRTF) stellar library (Villaume et al., 2017), covering wavelengths from 1680 to 50,000,Å. These models utilise theoretical isochrones from the BaSTI (Pietrinferni et al., 2004) and Padova (Girardi et al., 2000) databases, which are converted into the observational plane using extensive photometric stellar libraries (see Vazdekis et al. 2016). The NIR predictions are reliable for stellar populations older than 1 Gyr. The spectral predictions of the SPS models have a resolution of R1400-3500 in the optical and R2000 in the NIR. The E-MILES models offer a range of initial mass functions (IMFs), including universal and revised Kroupa, Chabrier, and both unimodal (i.e. single power-law) and bimodal (i.e. low-mass tapered) IMFs.
In this study, we utilised the updated E-MILES model predictions based on the BaSTI isochrones, considering ages from 1 to 14 Gyr and total metallicities from solar up to the 0.26 dex. We adopted a low-mass tapered bimodal IMF with a logarithmic slope of 1.3, closely resembling a standard Kroupa IMF (Vazdekis et al., 1996), as well as a bottom-heavy IMF with a slope of 3.0 to better match the IMF measured in the centres of massive galaxies (La Barbera et al., 2019) and of NGC 1277 (Martín-Navarro et al., 2015).
3.2 Conroy et al. (2018) models
To quantify the sensitivity of spectral features to elemental abundances, we used the stellar population models of Conroy et al. (2018). These models provide flexible and comprehensive predictions of stellar spectra across a range of ages between 1 and 13.5 Gyr and metallicities between [Fe/H]1.5 and 0.3 dex.
The Conroy et al. (2018) models use empirical spectral libraries (based on MILES and IRTF) and theoretical isochrones (MIST; Choi et al. 2016; Dotter 2016) to generate synthetic spectra and adopt a Kroupa IMF. These models cover a broad wavelength range, extending from 0.37 to 2.4 m, and include detailed treatment of various stellar atmospheric parameters and elemental abundances. In particular, they allow for variations in individual element abundances, including -elements and other important contributors to stellar opacity and absorption features. The publicly available model simple stellar population (SSP) spectra are provided at a spectral broadening of km s-1
In this study, we used the models with an age of 13 Gyr and metallicity [Fe/H] 0.2 dex, exploring three different abundance patterns: (i) models with [Mg/Fe] dex while keeping other elements fixed at solar values, (ii) models with [Si/Fe] dex with all other elements fixed, and (iii) solar-scaled models.
4 Supernova yield models
To interpret the observed [Si/Mg] abundance ratios in NGC 1277 and in the sample of local massive ETGs, we compared our measurements with theoretical SN nucleosynthetic yields as a function of progenitor mass and metallicity. These yield models are taken from the compilation of Nomoto et al. (2013), and include predictions for several SN types, each contributing differently to the chemical enrichment of galaxies. Their relative yields of Si and Mg provide key diagnostics for the origin of the abundance patterns observed.
-
•
CCSNe: These explosions originate from stars in the mass range 10–40 M⊙, and their nucleosynthesis patterns depend strongly on the progenitor mass and initial metallicity. These yields are taken from Kobayashi et al. (2006).
-
•
Hypernovae (HNe): These energetic explosions of massive stars (25 M⊙) with significantly larger explosion energies than standard CCSNe produce enhanced yields of -elements such as Si and Mg. The HN yields used in our work are based on the models of Umeda et al. (2002); Umeda and Nomoto (2005), and are included in the Kobayashi et al. (2006) framework.
-
•
Pair-instability supernovae (PISNe): These explosions result from very massive metal-free stars (140-260 M⊙) and are characterised by an overproduction of intermediate-mass elements, particularly Si. The PISN yields adopted in this work are from Umeda and Nomoto (2002). These models are particularly relevant for probing the chemical enrichment by Population III (Pop III) stars.
The SN yield metallicities used in this study were: Z = 0.0000, 0.0010, 0.0040, 0.0080, 0.0200, and 0.0500. To classify SN types, we followed the progenitor mass and explosion energy criteria of Nomoto et al. (2013). Specifically, SNe were categorized as: (i) PISNe for progenitor masses 140 M⊙; (ii) HNe for selected mass-energy pairs [20,10], [25,10], [30,20], [40,30], [100,60], with each pair denoting [mass in M⊙, energy in erg]; and (iii) CCSNe for explosion energies of 1.01051 erg and progenitor masses 140 M⊙ not falling into the HN combinations.
For each SN model, total elemental yields were computed by summing over all stable isotopes. The [X/Fe] ratios were derived for each progenitor by comparing the logarithmic yield ratios, log(X/Fe) against solar reference values from Asplund et al. (2009). These yield predictions provide a physically motivated framework to understand the origin of the observed elemental abundance ratios and to explore the possible contribution of different stellar populations to the earliest chemical enrichment.
5 Spectral index measurement
To quantify the absorption strengths of NIR features, we measured Si and Mg spectral indices. The initial index definitions were drawn from Eftekhari et al. (2021), Röck (2015), and Gasparri et al. (2021). However, due to specific artefacts in the observed spectra such as residuals from imperfect telluric correction, we refined several of these definitions to mitigate the impact of spectral shape peculiarities and local flux calibration uncertainties. The adopted index definitions used in this study are presented in Table 1. We verified that all clean, artefact-free definitions lead to consistent and robust measurements.
In particular, we modified the red pseudo-continuum band of the MgI 1.18 m feature to avoid a structured bump and dip in the NGC 1277 spectrum that distorted the local continuum estimate. Similarly, the red pseudo-continuum of the SiI 1.20 m feature was redefined, as the original band from Gasparri et al. (2021) was located too far from the absorption line centre, increasing susceptibility to systematic errors from broad-band flux calibration. To improve robustness, the blue pseudo-continuum band of the same index was also broadened to enhance the S/N and better anchor the local continuum level. The same blue pseudo-continuum adjustment was applied to MgI 1.58 m.
To quantify uncertainties on the measured indices, we provided both the flux and corresponding error spectra as input to the indexf code111https://indexf.readthedocs.io/ (Cardiel, 2010). The error estimates are derived through analytical propagation of flux uncertainties, following standard first-order error propagation. Specifically, the uncertainty in each index is calculated by considering both the noise in the flux within the feature band-pass and the propagated uncertainty in the interpolated pseudo-continuum. The latter is based on the uncertainties in the blue and red continuum regions used to estimate the local continuum level across the feature. All index values reported in this study are measured on flux-calibrated, rest-frame spectra smoothed to a common velocity dispersion of 440 km/s, matching the central velocity dispersion of NGC 1277 (the highest in our galaxy sample) to ensure consistent comparison across models and datasets. The resulting index measurements form the basis for the elemental abundance analysis in Sect. 6.
6 Elemental abundance estimation
We estimated [Si/Fe] and [Mg/Fe] for both NGC 1277 and the sample of massive ETGs by using a set of four measured spectral indices: two NIR Si features (SiI1.20 and SiI1.58) and two Mg features (MgI1.18 and Mgb5177222Definition from Worthey et al. (1994).) from both optical and NIR. Given the limited accuracy of current SPS models in the NIR, particularly for elemental abundance response functions, our goal is not to derive precise elemental abundances, but to provide a plausible range for [Si/Fe], [Mg/Fe], and their ratio. The NIR response models remain underdeveloped compared to those in the optical, and the absolute calibration of element-sensitive features in this regime is still uncertain.
We used E-MILES SPS models and incorporated the abundance response functions from Conroy et al. (2018), which are computed assuming a Kroupa IMF, to simulate 0.3 dex variations in [Si/Fe] and [Mg/Fe]. These responses were applied to E-MILES model grids with a bimodal IMF slope of 3.0 (representative of the IMF in the central regions of massive galaxies) to track how the four indices respond to abundance changes. For consistency, we adopted models with fixed stellar population parameters: age = 13 Gyr and [M/H] = 0.2 dex, and evaluated three abundance configurations: [Si/Fe] = 0.3 dex, [Mg/Fe] = 0.3 dex, and solar-scaled.
We caution that the abundance response functions used here are computed for abundance variations of only 0.3 dex, whereas the Si-sensitive indices measured in NGC 1277 require extrapolation beyond this range when interpreted under a linear-response approximation. The resulting absolute [Si/Fe] values should therefore be regarded as model-dependent estimates rather than precise abundance measurements. At such high inferred Si levels, the response of the Si features can become non-linear due to line saturation, changes in the pseudo-continuum, and opacity effects in cool stellar atmospheres. For this reason, our most robust conclusion is the differential one: NGC 1277 exhibits significantly stronger NIR Si-sensitive absorption than the comparison massive ETG sample.
To estimate abundances, we employed two complementary techniques. With Method 1, we estimated [Si/Fe], [Mg/Fe], and [Si/Mg] by projecting the observed indices onto a model response plane defined by solar-scaled, Si-enhanced, and Mg-enhanced predictions. A Monte Carlo sampling of realisations was performed to determine the associated uncertainties, obtaining a mean [Si/Fe], [Mg/Fe], and [Si/Mg].
With Method 2, we adopted a local linear relation calibrated over the [, , ] dex abundance range to estimate the abundance values that best reproduce the observed line strengths. For NGC 1277, this procedure involves extrapolation beyond the calibrated response-function range, particularly for the Si-sensitive indices. Error propagation was carried out analytically from the interpolation slope and index uncertainty.
Combining two Si indices (SiI1.20 and SiI1.58) with two Mg indices (MgI1.18 and Mgb5177), we formed four distinct Si–Mg index pairs. For each pair, we applied two independent estimation methods, resulting in a total of eight abundance measurements per galaxy for [Si/Fe], [Mg/Fe], and [Si/Mg]. These values are listed in Table 2.
To obtain representative abundance ratios from these independent determinations, we employed a Bayesian hierarchical model that accounts for both measurement uncertainties and possible intrinsic scatter among the estimates. In this framework, each measured value (and its associated uncertainty) is treated as an independent realisation drawn from a parent distribution characterised by a true mean and dispersion. The resulting posterior distributions provide a statistically consistent summary of the abundance estimates obtained from the different index combinations, while retaining the systematic caveat associated with the response-function extrapolation discussed above. The median values and 68% credible intervals of these posteriors are reported in Table 2.
| Galaxy | Method | Si index | Mg index | |||
|---|---|---|---|---|---|---|
| NGC 1277 | 1 | SiI1.20 | Mgb5177 | 0.77 | 0.27 | 0.49 |
| 2 | SiI1.20 | Mgb5177 | 0.71 | 0.33 | 0.38 | |
| 1 | SiI1.20 | MgI1.18 | 0.85 | 0.45 | 0.40 | |
| 2 | SiI1.20 | MgI1.18 | 0.71 | 0.48 | 0.23 | |
| 1 | SiI1.59 | Mgb5177 | 1.70 | 0.21 | 1.49 | |
| 2 | SiI1.59 | Mgb5177 | 1.93 | 0.33 | 1.60 | |
| 1 | SiI1.59 | MgI1.18 | 1.55 | 0.44 | 1.11 | |
| 2 | SiI1.59 | MgI1.18 | 1.93 | 0.48 | 1.45 | |
| Posterior median 68% credible interval | ||||||
| XSGs | 1 | SiI1.20 | Mgb5177 | 0.22 | 0.24 | |
| 2 | SiI1.20 | Mgb5177 | 0.10 | 0.26 | ||
| 1 | SiI1.20 | MgI1.18 | 0.25 | 0.30 | ||
| 2 | SiI1.20 | MgI1.18 | 0.10 | 0.31 | ||
| 1 | SiI1.59 | Mgb5177 | 0.48 | 0.22 | 0.26 | |
| 2 | SiI1.59 | Mgb5177 | 0.60 | 0.26 | 0.34 | |
| 1 | SiI1.59 | MgI1.18 | 0.47 | 0.30 | 0.17 | |
| 2 | SiI1.59 | MgI1.18 | 0.60 | 0.31 | 0.29 | |
| Posterior median 68% credible interval | ||||||
7 Results
We analysed key NIR absorption features of the massive relic galaxy NGC 1277 and compared them with those of massive ETGs. The focus is placed on MgI1.18, SiI1.20, and SiI1.59 spectral indices, which are highlighted by yellow regions in the top row of Fig. 1, zooming into the spectra around the absorption lines. The spectrum of NGC 1277 is shown with its corresponding error spectrum to illustrate the observational uncertainties. We compare these absorption features with those from the stacked spectrum of a sample of local massive ETGs (within 1.2 kpc to match the size of NGC 1277). For comparison, predictions from updated E-MILES SPS models with old age, super-solar metallicity, and a dwarf-rich stellar IMF (following the results of Martín-Navarro et al. 2015) are also shown in the top panels. The panels clearly show that the Mg and Si absorptions features in NGC 1277 are deeper than both the local massive galaxies and the model.
We measured the line-strength indices in all galaxies, as shown in the bottom panels of Fig. 1. The indices are presented as a function of age. We first confirm that the Mg line strength in NGC 1277 is significantly stronger than in normal massive ETGs, consistent with optical results (lower-left panel; Trujillo et al. 2014; Martín-Navarro et al. 2018). However, a striking difference emerges when examining the Si indices (middle and right lower panels): this rare, ultra-compact massive relic galaxy exhibits exceptionally strong Si absorption, exceeding that of normal massive galaxies by approximately 25%.
To explore the origin of this contrasting behaviour between the two -elements, we compared our measurements with SPS models: E-MILES models with a standard Kroupa-like IMF (i.e. a bimodal IMF with slope ) and a dwarf-enriched (or bottom-heavy) IMF, implemented as a bimodal IMF with slope , where a larger fraction of stellar mass is in low-mass stars. We show the response of line-strength indices to different abundance variations based on the Conroy et al. (2018) models: (i) a 0.3 dex enhancement in [Mg/Fe] and (ii) a 0.3 dex enhancement in [Si/Fe]. Each arrow is placed at the model corresponding to the average stellar population parameters derived for their galaxy centres, illustrating the index variation. While the enhanced Mg line strength in NGC 1277 can be attributed to its higher [Mg/Fe] ratio, which is robustly established through optical studies), the Si line strengths in NGC 1277 cannot be explained by any modelled abundance variation444We also examined the response of these indices to all other elemental abundance variations available in the Conroy et al. (2018) models. These responses are generally subtle compared to the observed offsets and to the Mg and Si response arrows, suggesting that contamination by another single element is unlikely to drive the strong Si absorption in NGC 1277.. Remarkably, this marks the first detection of such strong NIR Si absorption lines in a galaxy.
To assess the robustness of our results, we explored a range of potential systematic effects and alternative explanations. These include variations in the stellar population modelling, such as different IMF parameterisations beyond those considered in the main analysis, as well as the use of independent SPS models (E-MILES and X-shooter Spectral Library). We also inspected the behaviour of the relevant line strengths within the empirical stellar library feeding the models, tested the possible contribution of metal-poor populations and aperture effects. In addition, we compared our NIR-based abundance estimates with optical determinations of [Si/Fe] and [Mg/Fe] derived using independent methods. Overall, these analyses support the robustness of the unusually strong NIR Si absorption in NGC 1277 and its enhanced [Si/Mg] relative to massive ETGs. At the same time, the optical analysis yields a much less extreme [Si/Fe] enhancement, showing that the absolute Si abundance depends on the adopted spectral diagnostics. Our main conclusion is therefore that NGC 1277 exhibits a distinctive Si-enhanced chemical signature most clearly revealed in the NIR, while the absolute [Si/Fe] value should be interpreted with caution (see Appendices B–E for details of these tests).

8 Discussion
The elemental abundance pattern observed in NGC 1277 reveals a clear departure from that of typical massive ETGs. In particular, the elevated [Si/Mg] ratio hints that silicon and magnesium, although both -elements, do not necessarily share the same enrichment history in this system, a difference that could be tied to the specific timing of star formation during its early stages.
The abundance estimates presented in Sect. 6 show that NGC 1277 exhibits both enhanced [Si/Fe] and moderately elevated [Mg/Fe], with a clear excess of silicon relative to magnesium compared to massive ETGs. While these ratios provide complementary information, their difference ([Si/Mg]) offers a more direct diagnostic of the relative nucleosynthetic contributions from different enrichment channels. Because [Si/Mg] does not depend on the level of iron enrichment, it is largely insensitive to the delayed contribution of Fe from Type Ia SNe, which operate on longer timescales. Instead, it isolates variations among -elements produced predominantly by massive stars, making it a more direct probe of the relative nucleosynthetic contributions from different high-mass progenitors. We therefore focused on [Si/Mg] as the key quantity for interpreting the origin of the observed abundance pattern.
The Si excess presents a challenge for current stellar population models, which fail to reproduce such a pattern. Since different types of SNe yield different ratios of -elements depending on their progenitor mass, explosion energy, and metallicity, we turned to nucleosynthetic yield predictions as a physically motivated framework to trace the likely origin of the observed abundance pattern. We thus estimated the relative abundance of [Si/Mg] in both NGC 1277 and massive ETGs, and compared these values with the predicted yields from CCSN, HN, and PISN models. These events represent the dominant enrichment channels for massive stars at different initial mass regimes and metallicities.
Figure 2 shows [Si/Mg] as a function of the main-sequence mass of SN progenitors, plotted on a logarithmic scale to better visualise the wide mass range of stellar masses spanning CCSNe, HNe, and PISNe; the progenitor metallicity ranges from metal-free (Z ) to super-solar values (Z ). According to Heger and Woosley (2010), stars more massive than 140M⊙ are expected to explode as PISNe, while lower-mass stars undergo CC. These two SN types have markedly different nucleosynthetic yields, as illustrated in this figure.

We also show the 68% credible intervals of the inferred [Si/Mg] ratios for NGC 1277 and the massive ETGs sample, respectively, derived from our Bayesian hierarchical analysis (Table 2). Despite the larger spread in the NGC 1277 values, the two regions are clearly separated, indicating a distinct chemical signature for NGC 1277. The [Si/Mg] values observed in NGC 1277 partially overlap with yields from CCSNe (Z ), HNe (Z , 0.050), and PISNe, although all of these channels show significant scatter and their theoretical yields carry substantial uncertainties.
Importantly, when considered as a function of progenitor mass and metallicity, only yields associated with the most massive, metal-poor progenitors consistently extend into the upper end of the observed [Si/Mg] distribution. Theoretical studies show that such extreme [Si/Mg] ratios arise under specific explosion conditions: PISNe from very massive stars are predicted to produce large amounts of intermediate-mass elements such as Si relative to Mg, often reaching [Si/Mg] (Takahashi et al., 2018), while more energetic explosions of massive stars (HNe) can also enhance Si through explosive nucleosynthesis, albeit typically over a more limited range (Heger and Woosley, 2010). In contrast, metal-rich CCSNe and HNe predominantly yield near-solar [Si/Mg] ratios, similar to those inferred for typical massive ETGs.
Taken together, these results suggest that, while multiple enrichment pathways may plausibly contribute to the chemical evolution of NGC 1277, the high [Si/Mg] values require a non-negligible contribution from very massive progenitors characterised by disproportionately high silicon production relative to magnesium. In the nucleosynthetic yield models adopted here, such progenitors are associated with PISNe.
For completeness, we also examined the behaviour of [Si/Fe] and [Mg/Fe] separately as a function of progenitor mass (Appendix F). While these quantities follow similar overall trends, they show larger degeneracies between different enrichment channels, further supporting that [Si/Mg] provides a cleaner diagnostic of the relative contribution of massive progenitors.
Implications for early chemical enrichment
The distinctive abundance pattern observed in NGC 1277 is best understood within the two-phase galaxy formation scenario for massive galaxies. As illustrated schematically in Fig. 3, the early Universe is populated by metal-free stars. The most massive of these, Pop III stars are expected, in current models, to explode as PISNe, while lower-mass metal-free stars produce CCSNe. These explosions enrich the ISM, forming new generations of stars. Massive galaxies thus start forming rapidly and very early on from very massive, metal-poor or even metal-free progenitors. During these initial stages, the ISM is enriched primarily by very massive, metal-poor progenitors—well represented by PISN models—yielding exceptionally high [Si/Mg]. As the first phase continues, CCSNe and HNe begin to contribute to the chemical enrichment, gradually diluting the [Si/Mg] ratio, even before external processes start occurring in the second phase. During this second phase, marked by accretion and merger events, the stars are being incorporated and enriched by metal-rich CCSNe and Type Ia SNe, further diluting [Si/Mg] (shown by the gradient line evolving from the red nugget phase to a regular massive ETG).

However, NGC 1277 follows a different enrichment track. Firstly, its extremely intense initial star formation rates (1000 M⊙/yr; Trujillo et al. 2014) made the early enrichment of [Si/Mg] particularly pronounced. This was followed by a rapid decline in the star formation rate, which minimised the dilution compared to the normal track. Thus, when NGC 1277 reached its red nugget stage, it already presented more elevated [Si/Mg]. Given its relic nature, NGC 1277 then evolves over a quiescent track (dotted line), experiencing only passive evolution, with minimal accretion over the second phase. The colour gradient from dark to lighter pink conveys this subtle chemical evolution, in contrast to the drastic [Si/Mg] flattening shown for massive ETGs.
Thanks to its unique relic nature, the stars we observe in NGC 1277 today predominantly formed during the earliest, most intense phase of its SFH. As a result, their chemical abundance pattern retains the imprint of enrichment from very massive progenitors formed at the earliest stages, before subsequent chemical dilution. The exceptionally high [Si/Mg] values seen in NGC 1277 indicate a galaxy that formed the majority of its stars extremely rapidly and experienced little subsequent chemical evolution in comparison to typical massive ETGs. Notably, such a short star formation timescale (1 Gyr) is comparable to those inferred for the compact quiescent galaxies now being identified at with JWST (Carnall et al., 2024). This fossil-like preservation of NGC 1277’s chemical signature is what makes it such a powerful probe of primordial stellar populations, as summarised in Fig. 3: a single pathway branching early, with relic galaxies like NGC 1277 preserving the memory of their first-generation progenitors, while typical massive ETGs accumulate layers of chemical complexity over time.
We thus conclude that the distinctive chemical properties observed today in NGC 1277 result from both the timing and intensity of star formation and the subsequent modest evolution. These considerations highlight that the distinctive [Si/Mg] signature in NGC 1277 likely traces nucleosynthetic yields from very massive stars (150M⊙), which produce Si in disproportionately large amounts compared to Mg. This strongly supports a scenario in which the chemical composition of NGC 1277 was imprinted by the earliest, most massive stars. While the exact identity of these progenitors remains uncertain, several early-Universe channels associated with extremely massive, metal-poor stars may contribute, including PISNe and related pair-instability outcomes, such as pulsational pair-instability events and near-threshold massive star endpoints (Heger and Woosley, 2002, 2010; Woosley et al., 2007; Whalen et al., 2014). PISN models provide a well-developed theoretical framework that naturally reproduces the high [Si/Mg] ratios observed here. Regardless of the specific explosion mechanism, the observed abundance pattern in NGC 1277 provides compelling evidence that the chemical composition of this galaxy was imprinted by the earliest and most massive stars. This represents the first identification of such a preserved [Si/Mg] signature in such massive galaxies.
While our analysis relies on stellar population models with a dwarf-rich IMF, which is appropriate for describing the observed stellar populations in NGC 1277, the derived chemical pattern is best understood in the context of a time-varying IMF. In this scenario, an initial top-heavy phase dominated by massive stars, which include Pop III and earliest generations of stars contributing to the enrichment of the interstellar medium (ISM), followed by a transition to a bottom-heavy mode (Vazdekis et al., 1996, 1997; Jeřábková et al., 2018; Yan et al., 2019).
To further assess the plausibility of this picture, we computed IMF-weighted nucleosynthetic yields across a range of power-law IMF slopes. For a standard Salpeter IMF (), the integrated [Si/Mg] ratio is 0.05 dex, while in the extreme case of a top-heavy IMF (), the ratio increases to 0.33,dex. Within the framework of the yield models explored here, very high [Si/Mg] values are attained only when the contribution of the most massive progenitors—represented by PISN yields—is combined with a top-heavy IMF during these first stages of galaxy evolution. Thus, the [Si/Mg] excess in NGC 1277 reflects the chemical memory of its earliest, most massive stellar generations. A fully quantitative assessment of whether such an early very-massive-star contribution can reproduce both the enhanced [Si/Mg] ratio and the overall high metallicity of NGC 1277 requires dedicated chemical-evolution modelling; we are currently developing such models, which will be presented in a follow-up study.
The unusually high [Si/Fe] and [Si/Mg] ratios found here should also be viewed in the broader context of the well-known abundance and IMF anomalies in the centres of massive ETGs. These systems have been shown to host bottom-heavy IMFs and strong Na-sensitive absorption features, often interpreted as very high [Na/Fe] (e.g. La Barbera et al. 2017; Röck et al. 2017; Alton et al. 2018). Recent work has further highlighted the connection between Na enhancement and IMF variations in massive ETGs, reinforcing the view that the central regions of massive galaxies formed under extreme physical conditions, likely involving very rapid, high-density star formation and non-solar abundance patterns. However, we caution against interpreting Na as a direct tracer of the same enrichment channel responsible for the high [Si/Mg] ratio. Unlike Si and Mg, Na is an odd-Z element whose production is strongly sensitive to progenitor metallicity and neutron excess, and it may also receive contributions from asymptotic giant branch stars (e.g. Kobayashi et al. 2006).
The unusually high [Si/Mg] in NGC 1277 also aligns with predictions from theoretical and observational studies of early enrichment scenarios. Takahashi et al. (2018) modelled non-rotating Pop III progenitors and found that [Si/Mg] ratios in the range 0.33–0.92 dex can result from zero-metallicity SNe, consistent with our derived values in NGC 1277 (; see Table 2). Additionally, Sodini et al. (2024) analysed the chemical composition of neutral gas in damped Lyman- systems at 6, finding signatures of early silicon enrichment in the ISM of primordial galaxies. Their study provides independent gas-phase evidence of early Pop III nucleosynthesis.
Although our analysis focuses on Mg and Si, other elemental abundances (e.g. Al and Zn) are also known to carry additional information on chemical enrichment. In particular, abundance patterns involving odd- and even-Z elements can provide further constraints on nucleosynthetic pathways and the nature of the enriching sources. However, their measurement in the NIR is currently subject to larger modelling uncertainties and degeneracies. A comprehensive multi-element analysis, combining optical and NIR diagnostics, is beyond the scope of this work and will be addressed in future studies.
9 Conclusions
We have presented a detailed analysis of NIR spectral features in the massive relic galaxy NGC 1277 and compared them with those of a representative sample of massive ETGs. Our main findings can be summarised as follows:
-
•
NGC 1277 exhibits significantly stronger silicon absorption features than typical massive ETGs, with Si line strengths exceeding those of the comparison sample by .
-
•
The derived abundance ratios for NGC 1277 indicate enhanced [Si/Fe] () and moderately elevated [Mg/Fe] (), resulting in a high [Si/Mg] ratio () that is clearly distinct from that of normal massive ETGs.
-
•
The observed Mg and Si absorption features in NGC 1277 are not readily explained by standard chemical enrichment scenarios, indicating a distinct abundance pattern compared to typical massive ETGs.
-
•
Comparison with SN yield models indicates that the high [Si/Mg] values are consistent with enrichment involving a significant contribution from very massive progenitors (150 M⊙), although multiple enrichment channels likely contribute.
-
•
The observed abundance pattern can be understood in the context of the relic nature of NGC 1277, whose rapid and early SFH, combined with the absence of significant late-time accretion, allowed it to retain chemical signatures that are significantly diluted in more typical massive galaxies.
Our discovery of an unusually strong Si absorption in NGC 1277, reported in this work for the first time, provides a rare opportunity to probe the conditions of early galaxy formation. This is accessible not through direct observations at extreme redshifts, but through the fossil record preserved in local massive relics. While recent JWST observations have revealed massive, quiescent galaxies at unexpectedly high redshifts (7-10), the stellar populations in these early systems are too young for a reliable measurement of detailed chemical abundances, even with very high-quality data. In contrast, massive relic galaxies like NGC 1277 contain evolved stellar populations that encode the chemical signatures of primordial star formation episodes. Measuring detailed abundance ratios in relics not only constrains early star formation conditions, but also provides observational leverage to estimate the initial masses of Pop III stars, whose predicted yields, especially of Si, are highly mass-dependent (Heger and Woosley, 2002; Beasley et al., 2003). These results highlight the utility of NIR spectroscopy in unveiling the elemental imprints of early cosmic history. By using NIR spectral indices to trace elemental abundances in local massive relic galaxies, our work opens a new pathway to study the earliest stellar generations and chart the enrichment history of the cosmos.
Acknowledgements.
E.E., A.F.M., A.V. and J.P.V.B. acknowledge funding from the MCIN/AEI and the European Regional Development Fund (ERDF) through the POKEBOWL project PID2021-123313NA-I00. E.E., A.F.M. A.V., M.A.B. and J.P.V.B. acknowledge support from grants PID2022-140869NB-I00 and PID2024-162088NB-I00 from the Spanish Ministry of Science, Innovation and Universities (MCIU). This work has also been supported through the IAC project TRACES, partially funded by the state and regional budget of the Consejería de Economía, Industria, Comercio y Conocimiento of the Canary Islands Autonomous Community. F.L.B., A.V., and E.E. acknowledge support from the INAF mini-grant 1.05.23.04.01 and A.FM. has received support from RYC2021-031099-I of MICIN/AEI/10.13039/501100011033/ UE NextGenerationEU/PRTR. J.P.V.B. received the support of a fellowship from the “la Caixa” Foundation (ID 100010434). The fellowship code is LCF/BQ/DI23/11990084. E.E. and M.K. acknowledge funding from the Dutch Research Council (NWO) through the award of the Vici grant VI.C.222.047.References
- KINETyS II: Constraints on spatial variations of the stellar initial mass function from K-band spectroscopy. MNRAS 478 (4), pp. 4464–4486. External Links: Document, 1805.05964, ADS entry Cited by: §8.
- The Chemical Composition of the Sun. ARA&A 47 (1), pp. 481–522. External Links: Document, 0909.0948, ADS entry Cited by: §4.
- Intermediate-Element Abundances in Galaxy Clusters. ApJ 620 (2), pp. 680–696. External Links: Document, astro-ph/0309166, ADS entry Cited by: §1.
- The Metallicity of Pregalactic Globular Clusters: The Observational Consequences of the First Stars. ApJ 596 (2), pp. L187–L190. External Links: Document, astro-ph/0309198, ADS entry Cited by: §9.
- A single population of red globular clusters around the massive compact galaxy NGC 1277. Nature 555 (7697), pp. 483–486. External Links: Document, 1803.04893, ADS entry Cited by: §1.
- Stellar populations and surface brightness fluctuations: new observations and models. MNRAS 320 (2), pp. 193–216. External Links: Document, astro-ph/0008218, ADS entry Cited by: Appendix D.
- PARSEC: stellar tracks and isochrones with the padova and trieste stellar evolution code. Monthly Notices of the Royal Astronomical Society 427 (1), pp. 127–145. Cited by: §E.0.2.
- Full spectrum fitting with photometry in PPXF: stellar population versus dynamical masses, non-parametric star formation history and metallicity for 3200 LEGA-C galaxies at redshift . MNRAS 526, pp. 3273–3300. External Links: 2208.14974, Document Cited by: §2.1.
- indexf: Line-strength Indices in Fully Calibrated FITS Spectra. Note: Astrophysics Source Code Library External Links: 1010.046, ADS entry Cited by: §5.
- The JWST EXCELS survey: too much, too young, too fast? Ultra-massive quiescent galaxies at 3 ¡ z ¡ 5. MNRAS 534 (1), pp. 325–348. External Links: Document, 2405.02242, ADS entry Cited by: §8.
- On the Environmental Dependence of the Cluster Galaxy Assembly Timescale. ApJ 609 (2), pp. L45–L48. External Links: Document, astro-ph/0405512, ADS entry Cited by: §1.
- First stars V - Abundance patterns from C to Zn and supernova yields in the early Galaxy. A&A 416, pp. 1117–1138. External Links: Document, astro-ph/0311082, ADS entry Cited by: §E.0.3.
- PARSEC evolutionary tracks of massive stars up to 350 M⊙ at metallicities 0.0001 Z 0.04. MNRAS 452 (1), pp. 1068–1080. External Links: Document, 1506.01681, ADS entry Cited by: §E.0.2.
- Improving PARSEC models for very low mass stars. MNRAS 444 (3), pp. 2525–2543. External Links: Document, 1409.0322, ADS entry Cited by: §E.0.2.
- Mesa Isochrones and Stellar Tracks (MIST). I. Solar-scaled Models. ApJ 823 (2), pp. 102. External Links: Document, 1604.08592, ADS entry Cited by: §3.2.
- Abundances In Very Metal-Poor Dwarf Stars. ApJ 612 (2), pp. 1107–1135. External Links: Document, astro-ph/0405286, ADS entry Cited by: §E.0.3.
- The massive relic galaxy NGC 1277 is dark matter deficient. From dynamical models of integral-field stellar kinematics out to five effective radii. A&A 675, pp. A143. External Links: Document, 2303.11360, ADS entry Cited by: §1.
- Early-type Galaxy Archeology: Ages, Abundance Ratios, and Effective Temperatures from Full-spectrum Fitting. ApJ 780 (1), pp. 33. External Links: Document, 1303.6629, ADS entry Cited by: §E.0.3.
- Metal-rich, Metal-poor: Updated Stellar Population Models for Old Stellar Systems. ApJ 854 (2), pp. 139. External Links: Document, 1801.10185, ADS entry Cited by: Appendix B, §E.0.3, §3.2, §3.2, §6, Figure 1, §7, footnote 4, footnote 5.
- Spextool: A Spectral Extraction Package for SpeX, a 0.8-5.5 Micron Cross-Dispersed Spectrograph. PASP 116 (818), pp. 362–376. External Links: Document, ADS entry Cited by: §3.1.
- Red Nuggets at z ~1.5: Compact Passive Galaxies and the Formation of the Kormendy Relation. ApJ 695 (1), pp. 101–115. External Links: Document, 0807.1744, ADS entry Cited by: §1.
- MESA Isochrones and Stellar Tracks (MIST) 0: Methods for the Construction of Stellar Isochrones. ApJS 222 (1), pp. 8. External Links: Document, 1601.05144, ADS entry Cited by: §3.2.
- Adding value to JWST spectra and photometry: stellar population and star formation properties of spectroscopically confirmed JADES and CEERS galaxies at z ¿ 7. MNRAS 529 (4), pp. 4728–4744. External Links: Document, 2309.14961, ADS entry Cited by: §1.
- Stellar populations of massive galaxies in the near-ir: exploiting new ground- and space-based large diameter telescope facilities. Ph.D. Thesis, Instituto de Astrofísica de Canarias, . Note: Cited by: Appendix A.
- Strong CO absorption features in massive ETGs. MNRAS 512 (1), pp. 378–400. External Links: Document, 2202.08651, ADS entry Cited by: Appendix B.
- Fingerprints of stellar populations in the near-infrared: an optimized set of spectral indices in the JHK bands. MNRAS 504 (2), pp. 2190–2223. External Links: Document, 2104.01051, ADS entry Cited by: §2.1, Table 1, §5.
- Massive Relic Galaxies Challenge the Co-evolution of Super-massive Black Holes and Their Host Galaxies. ApJ 808 (1), pp. 79. External Links: Document, 1506.02663, ADS entry Cited by: §1.
- Two new confirmed massive relic galaxies: red nuggets in the present-day Universe. MNRAS 467 (2), pp. 1929–1939. External Links: Document, 1701.05197, ADS entry Cited by: §1, §1.
- Further evidence for a time-dependent initial mass function in massive early-type galaxies.. MNRAS 448, pp. L82–L86. External Links: Document, 1501.01636, ADS entry Cited by: Appendix D.
- Near-infrared spectroscopic indices for unresolved stellar populations - II. Index measurements. MNRAS 507 (4), pp. 4669–4683. External Links: Document, 2109.03131, ADS entry Cited by: Table 1, §5, §5.
- Evolutionary tracks and isochrones for low- and intermediate-mass stars: From 0.15 to 7 Msun, and from Z=0.0004 to 0.03. A&AS 141, pp. 371–383. External Links: Document, astro-ph/9910164, ADS entry Cited by: §E.0.2, §3.1.
- The Nucleosynthetic Signature of Population III. ApJ 567 (1), pp. 532–543. External Links: Document, astro-ph/0107037, ADS entry Cited by: §8, §9.
- Nucleosynthesis and Evolution of Massive Metal-free Stars. ApJ 724 (1), pp. 341–373. External Links: Document, 0803.3161, ADS entry Cited by: §8, §8, §8.
- Impact of metallicity and star formation rate on the time-dependent, galaxy-wide stellar initial mass function. A&A 620, pp. A39. External Links: Document, 1809.04603, ADS entry Cited by: §8.
- Chemical element ratios of Sloan Digital Sky Survey early-type galaxies. MNRAS 421 (3), pp. 1908–1926. External Links: Document, 1112.0322, ADS entry Cited by: §1.
- Molecfit: A general tool for telluric absorption correction. II. Quantitative evaluation on ESO-VLT/X-Shooterspectra. A&A 576, pp. A78. External Links: Document, 1501.07265, ADS entry Cited by: Appendix A, §2.1.
- Galactic Chemical Evolution: Carbon through Zinc. ApJ 653 (2), pp. 1145–1171. External Links: Document, astro-ph/0608688, ADS entry Cited by: 1st item, 2nd item, §8.
- IMF radial gradients in most massive early-type galaxies. MNRAS 489 (3), pp. 4090–4110. External Links: Document, 1909.01382, ADS entry Cited by: §2.2, §2.2, §3.1.
- IMF and [Na/Fe] abundance ratios from optical and NIR spectral features in early-type galaxies. MNRAS 464, pp. 3597–3616. External Links: 1610.03853, Document, ADS entry Cited by: §8.
- Chemical abundance ratios for the bulge of M31. arXiv e-prints, pp. arXiv:2502.18409. External Links: Document, 2502.18409, ADS entry Cited by: §E.0.3.
- ISPy3: Integrated-light Spectroscopy for Python3. Note: Astrophysics Source Code Library, record ascl:2009.004 External Links: 2009.004, ADS entry Cited by: §E.0.3.
- Evolution of thermally pulsing asymptotic giant branch stars - I. The COLIBRI code. MNRAS 434 (1), pp. 488–526. External Links: Document, 1305.4485, ADS entry Cited by: §E.0.2.
- The initial mass function of a massive relic galaxy. MNRAS 451, pp. 1081–1089. External Links: 1505.01485, Document, ADS entry Cited by: §3.1, §7.
- Timing the formation and assembly of early-type galaxies via spatially resolved stellar populations analysis. MNRAS 475 (3), pp. 3700–3729. External Links: Document, 1801.05486, ADS entry Cited by: §7.
- Minor Mergers and the Size Evolution of Elliptical Galaxies. ApJ 699 (2), pp. L178–L182. External Links: Document, 0903.1636, ADS entry Cited by: §1.
- Nucleosynthesis in Stars and the Chemical Enrichment of Galaxies. ARA&A 51 (1), pp. 457–509. External Links: Document, ADS entry Cited by: §4, §4, Figure 2.
- The Two Phases of Galaxy Formation. ApJ 725 (2), pp. 2312–2323. External Links: Document, 1010.1381, ADS entry Cited by: §1.
- Constraining the thermally pulsing asymptotic giant branch phase with resolved stellar populations in the Small Magellanic Cloud. MNRAS 485 (4), pp. 5666–5692. External Links: Document, 1903.04499, ADS entry Cited by: §E.0.2.
- A Large Stellar Evolution Database for Population Synthesis Studies. I. Scaled Solar Models and Isochrones. ApJ 612 (1), pp. 168–190. External Links: Document, astro-ph/0405193, ADS entry Cited by: §E.0.3, §3.1.
- Expected Number of Massive Galaxy Relics in the Present Day Universe. ApJ 773 (1), pp. L8. External Links: Document, 1307.1976, ADS entry Cited by: §1.
- The Infrared Telescope Facility (IRTF) Spectral Library: Cool Stars. ApJS 185 (2), pp. 289–432. External Links: Document, 0909.0818, ADS entry Cited by: §3.1.
- The puzzling interpretation of NIR indices: The case of NaI2.21. MNRAS 472 (1), pp. 361–372. External Links: Document, 1708.04638, ADS entry Cited by: §8.
- Stellar population synthesis models between 2.5 and 5 m based on the empirical IRTF stellar library. MNRAS 449 (3), pp. 2853–2874. External Links: Document, 1505.01837, ADS entry Cited by: Appendix B, §3.1.
- MILES extended: Stellar population synthesis models from the optical to the infrared. A&A 589, pp. A73. External Links: Document, 1609.05478, ADS entry Cited by: §3.1.
- Understanding the formation and evolution of early-type galaxies based on newly developed single-burst stellar population models in the infrared. Ph.D. Thesis, Instituto de Astrofísica de Canarias, . Note: Cited by: Table 1, §5.
- Evolution of Thermally Pulsing Asymptotic Giant Branch Stars. V. Constraining the Mass Loss and Lifetimes of Intermediate-mass, Low-metallicity AGB Stars. ApJ 822 (2), pp. 73. External Links: Document, 1603.05283, ADS entry Cited by: §E.0.2.
- The Observability of Abundance Ratio Effects in Dynamically Hot Stellar Systems. ApJ 627 (2), pp. 754–766. External Links: Document, ADS entry Cited by: §E.0.3.
- Molecfit: A general tool for telluric absorption correction. I. Method and application to ESO instruments. A&A 576, pp. A77. External Links: Document, 1501.07239, ADS entry Cited by: Appendix A, §2.1.
- Evidence of Pop III stars’ chemical signature in neutral gas at z 6. A study based on the E-XQR-30 spectroscopic sample. A&A 687, pp. A314. External Links: Document, 2404.10722, ADS entry Cited by: §8.
- INSPIRE: INvestigating Stellar Population In RElics - V. A catalogue of ultra-compact massive galaxies outside the local Universe and their degree of relicness. MNRAS 527 (3), pp. 8793–8811. External Links: Document, 2309.12966, ADS entry Cited by: §1.
- Stellar Yields of Rotating First Stars. II. Pair-instability Supernovae and Comparison with Observations. ApJ 857 (2), pp. 111. External Links: Document, 1803.06630, ADS entry Cited by: §8, §8.
- Superdense Massive Galaxies in the Nearby Universe. ApJ 692 (2), pp. L118–L122. External Links: Document, 0901.1032, ADS entry Cited by: §1.
- NGC 1277: A Massive Compact Relic Galaxy in the Nearby Universe. ApJ 780 (2), pp. L20. External Links: Document, 1310.6367, ADS entry Cited by: §E.0.3, Appendix F, §1, §1, §7, §8.
- Peculiar Chemical Abundances in the Starburst Galaxy M82 and Hypernova Nucleosynthesis. ApJ 578 (2), pp. 855–861. External Links: Document, astro-ph/0207067, ADS entry Cited by: 2nd item.
- Nucleosynthesis of Zinc and Iron Peak Elements in Population III Type II Supernovae: Comparison with Abundances of Very Metal Poor Halo Stars. ApJ 565 (1), pp. 385–404. External Links: Document, astro-ph/0103241, ADS entry Cited by: 3rd item.
- Variations in the Abundance Pattern of Extremely Metal-Poor Stars and Nucleosynthesis in Population III Supernovae. ApJ 619 (1), pp. 427–445. External Links: Document, astro-ph/0308029, ADS entry Cited by: 2nd item.
- An over-massive black hole in the compact lenticular galaxy NGC 1277. Nature 491 (7426), pp. 729–731. External Links: Document, 1211.6429, ADS entry Cited by: §1.
- A substantial population of low-mass stars in luminous elliptical galaxies. Nature 468 (7326), pp. 940–942. Cited by: §1.
- Cosmic-Ray Rejection by Laplacian Edge Detection. PASP 113 (789), pp. 1420–1427. External Links: Document, astro-ph/0108003, ADS entry Cited by: §2.1.
- A New Chemo-evolutionary Population Synthesis Model for Early-Type Galaxies. I. Theoretical Basis. ApJS 106, pp. 307. External Links: astro-ph/9605112, Document, ADS entry Cited by: Appendix C, Appendix D, §3.1, §8.
- Surface brightness fluctuation spectra to constrain stellar population properties. MNRAS 493 (4), pp. 5131–5152. External Links: Document, 2003.02563, ADS entry Cited by: Appendix D.
- UV-extended E-MILES stellar population models: young components in massive early-type galaxies. MNRAS 463 (4), pp. 3409–3436. External Links: Document, 1612.01187, ADS entry Cited by: §3.1.
- A New Chemo-evolutionary Population Synthesis Model for Early-Type Galaxies. II. Observations and Results. ApJS 111 (1), pp. 203–232. External Links: Document, astro-ph/9701036, ADS entry Cited by: Appendix D, §1, §8.
- X-shooter, the new wide band intermediate resolution spectrograph at the ESO Very Large Telescope. A&A 536, pp. A105. External Links: Document, 1110.1944, ADS entry Cited by: §2.2.
- Modelling simple stellar populations in the near-ultraviolet to near-infrared with the X-shooter Spectral Library (XSL). A&A 661, pp. A50. External Links: Document, 2110.10190, ADS entry Cited by: §E.0.2.
- The Extended IRTF Spectral Library: Expanded Coverage in Metallicity, Temperature, and Surface Gravity. ApJS 230 (2), pp. 23. External Links: Document, 1705.08906, ADS entry Cited by: §3.1.
- RUBIES Reveals a Massive Quiescent Galaxy at z = 7.3. ApJ 983 (1), pp. 11. External Links: Document, 2409.03829, ADS entry Cited by: §1.
- Finding the First Cosmic Explosions. III. Pulsational Pair-instability Supernovae. ApJ 781 (2), pp. 106. External Links: Document, 1311.1221, ADS entry Cited by: §8.
- Pulsational pair instability as an explanation for the most luminous supernovae. Nature 450 (7168), pp. 390–392. External Links: Document, 0710.3314, ADS entry Cited by: §8.
- Old stellar populations. 5: absorption feature indices for the complete lick/ids sample of stars. The Astrophysical Journal Supplement Series 94, pp. 687–722. Cited by: footnote 2.
- Individual Alpha Elements, C, N, and Ba in Early-type Galaxies. ApJ 783 (1), pp. 20. External Links: Document, 1303.2603, ADS entry Cited by: §E.0.3.
- The star formation timescale of elliptical galaxies. Fitting [Mg/Fe] and total metallicity simultaneously. A&A 632, pp. A110. External Links: Document, 1911.02568, ADS entry Cited by: §8.
Appendix A Telluric correction
To correct for telluric absorption, we used the software Molecfit (Smette et al., 2015; Kausch et al., 2015), which constructs a synthetic telluric transmission model directly from the science spectrum. Given that the spectral resolution of EMIR varies slightly with wavelength, we ran Molecfit on multiple spectral windows across the J and H bands and then combined the resulting models to produce a full telluric correction. This method allowed us to accurately remove absorption features from atmospheric H2O, O2, and CH4, which are particularly prominent in the NIR. The correction was applied row-by-row on the 2D galaxy spectra prior to 1D extraction. We verified the performance of the correction by comparing spectra before and after Molecfit application, confirming that telluric features were removed to better than the 2% level across both bands (see Eftekhari 2021).
Appendix B Detailed look at the stellar library
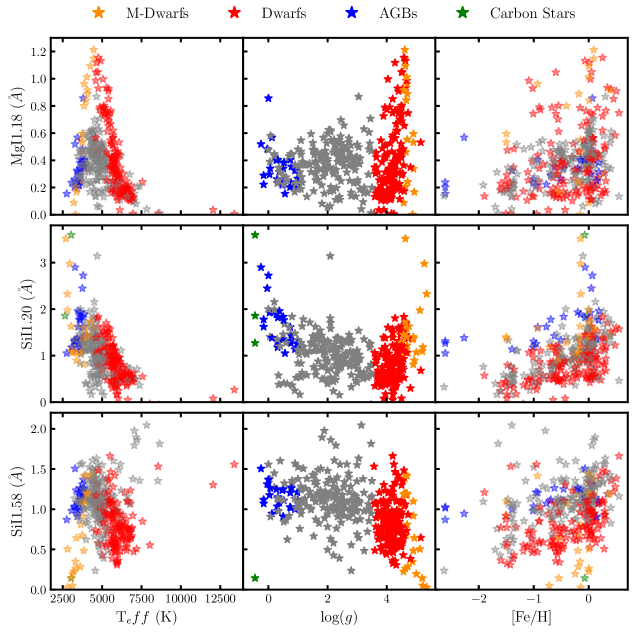
To investigate the source of the discrepancies between SPS models and observations, we examined the stellar library used for E-MILES and Conroy et al. (2018) SPS modelling, i.e. E-IRTF555Note that the Conroy et al. (2018) model does not include the common stars among the IRTF and E-IRTF libraries while E-MILES uses all stars in the E-IRTF library.. Figure 4 displays the line-strength values of MgI1.18, SiI1.20, and SiI1.58 indices as functions of stellar effective temperature (Teff), surface gravity (log()) and metallicity ([Fe/H]). The stellar types (for stars cooler than 3900 K) are drawn from Table 2 of Röck et al. (2015). M-dwarf stars are defined here as dwarf stars cooler than 4500 K.
These plots indicate that M-dwarf stars have the highest values of MgI1.18 index while the highest values of SiI1.20 and SiI1.58 correspond mostly to giant stars. The exceptionally strong Si line strength observed in NGC 1277 (SiI1.20 1.8 and SiI1.58 1.5) corresponds to a regime in the stellar library populated only by a few cool giant stars (grey and blue points), with no stars exhibiting higher Si absorption at lower temperatures (except a few M dwarfs and one carbon star in the case of SiI1.20). This suggests that the observed strength cannot be attributed to a particular stellar evolutionary phase (e.g. asymptotic giant branch stars in the case of CO band heads; Eftekhari et al. 2022), as there is no population in the library with higher Si. Therefore, the Si enhancement in NGC 1277 is best explained by a genuine increase in [Si/Fe], rather than being an artefact of a poorly modelled stellar phase.
We caution that the SPS models used are based on empirical stellar spectra of Milky Way stars, assuming similar abundance patterns and evolution in other galaxies such as NGC 1277. Deviations from this—such as poorly modelled evolutionary phases or chemical peculiarities—could impact the interpretation of spectral features.
Appendix C Effects of IMF shape on line-strength indices
To explain the higher line-strength indices observed in NGC 1277 compared to massive ETGs, it is necessary to enhance the contribution of stars with the highest Si and Mg strengths while reducing the influence of stars with lower index values. This can be achieved by modifying the shape of the IMF. Figure 5 illustrates various possible IMF shapes. For reference, we also show the Salpeter IMF and bimodal IMFs with slopes of 1.3 and 3.0. The bimodal IMF is parameterised as a two-segment function (Vazdekis et al., 1996). Below 0.2M and above 0.6M, the bimodal IMF is characterised by a power-law distribution. Between 0.2M and 0.6M, it is a spline function that satisfies some boundary conditions. Below 0.2M, the bimodal IMF follows one power-law slope of zero, and above 0.6M, it follows a varying slope.
As mentioned, M-dwarf stars have the highest values of MgI1.18 index. Therefore, increasing the slope of a bimodal IMF would enhance the number of M-dwarf stars with respect to giant stars, increasing the MgI1.18 absorption. In the case of Si indices, since most of the M-dwarf stars have lower values than giant stars, by increasing the slope of a bimodal IMF, the overall value of the Si indices decrease. These are shown quantitatively in Fig. 4 where indices are measured on SSPs that are constructed based on the IMFs shown in Fig. 7.
We modified the definition of the bimodal IMF for low-mass stars by considering a slope of 0.3 for stellar masses below 0.2M666This slope is chosen to be similar to the slope of the Kroupa IMF for very low-mass stars.. This aimed to reduce the emphasis on the very cool stars that weaken the Si absorptions. The results are shown in Figs. 5 and 6. The effect of this IMF shape on line-strength indices is almost negligible.
We also attempted to change the mass range of the turning point for the bimodal IMF. The turning point mass range was reduced from 0.6M to 0.4M. The result for a bimodal IMF with a slope of 3.0 is shown in Figs. 5 and 6. In this case, only the contribution of M-dwarf stars that most affect the Si is emphasised, although the effect on the line-strength indices of Si is negligible.
We also note that a unimodal IMF with the same slope as bimodal IMF with does not flatten at masses lower than 0.2M, meaning that cooler dwarf stars (with lower MgI values) outnumber stars near the peak of the MgI strength. Consequently, the MgI1.18 line strength on SSPs built based on a unimodal IMF is similar to the ones built based on a bimodal IMF with (see the solid orange line in Fig. 6). All in all, none of these adjustments adequately address the discrepancies in Si indices.


Appendix D Role of metal-poor populations
Further inspection of Fig. 4 reveals a trend in dwarf stars (red symbols) where Si line strengths increase with higher [Fe/H]. This suggests that the elevated Si absorption in NGC 1277 results from a lower fraction of metal-poor stars compared to the massive ETGs. Si, synthesised via the -process in massive stars, is released into the ISM by Type II SNe, enriching the gas that forms subsequent generations of stars (200 Myr after the Big Bang and later).
Chemo-evolutionary population synthesis models (Vazdekis et al., 1996, 1997) suggest that massive ETGs contain two stellar populations: a dominant old, metal-rich population and a minor, metal-poor population formed during rapid early chemical enrichment. The enhanced Si indices in NGC 1277 indicate a more rapid and efficient early star formation phase, leading to fewer metal-poor stars than in massive ETGs. We tested this hypothesis by constructing two-component SSP models, combining metal-rich ([M/H] = 0.26 dex) and metal-poor ([M/H] = 1.49 dex) populations. As shown in Fig. 5, increasing the mass fraction of the metal-poor component (blue star symbols) affects the line strength indices. A 20% metal-poor fraction lowers the SiI1.20 index to values seen in massive ETGs, but this level is inconsistent with optical and surface brightness fluctuation studies of massive ETGs, which limit this fraction to 5% (Vazdekis et al., 1997; Blakeslee et al., 2001; Ferreras et al., 2015; Vazdekis et al., 2020). Moreover, this adjustment does not reproduce the SiI1.58 index.
Appendix E Robustness tests
E.0.1 Index variations with aperture
To study aperture effects, we repeated our analysis using spectra extracted within one effective radius of the X-shooter individual galaxies (i.e. not in the stacked spectrum). This aperture plus the one that we used throughout the paper (matching the aperture for NGC 1277, i.e. 1.2 kpc) are shown in Fig. 5. We find that MgI1.18 and SiI1.58 values are indistinguishable within the measurement uncertainties. For SiI1.20, a lower value is observed in the aperture, yet it remains significantly below the value measured for NGC 1277. This confirms that the strong Si and Mg features observed in NGC 1277 compared to massive ETGs are not the result of aperture effects.
E.0.2 Abundance estimates with SPS models
We repeated the abundance estimation using SPS models constructed based on the empirical X-shooter Spectral Library (XSL; Verro et al. 2022) to assess the impact of model systematics. XSL provides a wide wavelength coverage (3000–25,000 Å) at a resolution of , enabling consistent modelling of both optical and NIR spectral features.
These models are available with two different sets of isochrones: Padova00 (Girardi et al., 2000) and PARSEC-COLIBRI (PC). The latter combines PARSEC v1.2S evolutionary tracks (Bressan et al., 2012; Chen et al., 2014, 2015) with COLIBRI thermally pulsing asymptotic giant branch models (Marigo et al., 2013; Rosenfield et al., 2016; Pastorelli et al., 2019), improving the treatment of the thermally pulsing asymptotic giant branch phase, crucial for accurate modelling of the NIR. They span a wide range of ages from 1 to 13.5 Gyr and metallicities from [M/H] 1.5 to 0.3, adopting a Kroupa-like IMF.
In this study, we exclusively used the XSL SSP models constructed with the PC isochrones. Our selected model grid spans five ages (1.0, 2.5, 5.0, 10.0, and 12.6 Gyr) and three metallicities ([Fe/H] = 0.0, 0.1, 0.2).
The overall trends in [Si/Fe] and [Si/Mg] remain stable. Although the XSL models produce slightly different absolute index strengths due to differences in spectral library and IMF, the relative differences between NGC 1277 and massive ETGs persist: the [Si/Mg] ratio remains significantly elevated in NGC 1277 (centred at 0.67 dex) compared to massive ETGs (centred at 0.16). This further confirms that the Si-enhancement in NGC 1277 is not an artefact of the adopted stellar population model.
E.0.3 Optical estimates of Si and Mg
To assess the consistency of our NIR-based abundance results, we analysed optical spectra of NGC 1277 and the stacked sample of massive ETGs. The optical spectrum of NGC 1277 was obtained with the ISIS spectrograph on the William Herschel Telescope (WHT) (see Trujillo et al. 2014 for observational details). Spectral fitting was carried out using both full index fitting and full spectral fitting methods, following the procedures outlined in La Barbera et al. (2025).
Each fit incorporated a two-component stellar population model (2SSP), consisting of an old and a younger SSP, to account for potential age variations. Abundance ratios of several elements (Mg, Na, C, Ca, N, Ti, Si, and O) were simultaneously fitted using response functions from Conroy et al. (2018) theoretical stellar population models, with the same methodology across NGC 1277 and stacked spectra of massive ETGs.
This analysis yielded four independent [X/Fe] estimates per element (2 fitting methods × 2 isochrones), with means and standard deviations computed to quantify uncertainties. For Si in particular, the [Si/Fe] in NGC 1277 was found to be modestly enhanced (by 0.05 dex) relative to massive ETGs, consistent in sign but smaller in amplitude than our NIR-derived estimate.
As an additional optical consistency check, we compared two full-spectrum fits: one in which [Si/Fe] was allowed to vary freely, and one in which [Si/Fe] was fixed to a high value of +0.6 dex, representative of the NIR-inferred enhancement, while the remaining stellar-population and abundance parameters were refitted. The free-[Si/Fe] fit favours a lower abundance, around [Si/Fe] ( 0.2) dex. The fixed-high-[Si/Fe] model provides a somewhat poorer fit and introduces localised residuals in some spectral regions, particularly around blended CN and metal-line complexes. However, the mismatch is not severe, with residuals remaining comparable to the observational uncertainties. We therefore interpret the optical spectrum as favouring a lower absolute [Si/Fe] value, while not decisively ruling out the higher value inferred from the NIR.
As a complementary theoretical sensitivity check, we also inspected theoretical optical SSP spectra, which we computed with the ISPy3 code (Larsen, 2020) using two different Si abundances, [Si/Fe] = +0.3 and +1.0. Both SSPs assume an old age of 12 Gyr (-enhanced BaSTI isochrones; Pietrinferni et al. 2004), a bottom-heavy IMF, and a metal-rich baseline composition of [M/H] = +0.2. The abundances of O, Ne, Mg, S, Ar, Ti, and Na were fixed at +0.3 dex, while Ca was kept solar. The models were computed using MARCS atmospheres for the coolest stars, with (Teff¡4000,K), and ATLAS12 atmospheres for the remaining stars, allowing the atmospheric structure and opacities to be computed consistently for the adopted abundance mixture. After smoothing the SSPs to the velocity dispersion of NGC 1277, ( = 440,km,s-1), we find that the strongest optical response to increasing Si occurs in the blue, particularly around SiI4102. For this feature, the index increases from 1.07 Å for [Si/Fe] = +0.3 to 1.79 Å for [Si/Fe] = +1.0. However, the observed difference between NGC 1277 and the X-shooter galaxy (XSG) stack is very small, (0.8310.029) Å versus (0.8070.022) Å. Conversely, SiI4513 is slightly stronger in NGC 1277 than in the XSG stack, (2.0780.027) Å versus (1.9900.027) Å, but the SSPs predict only a weak response in the opposite direction, decreasing from 2.47 Å to 2.40 Å. This confirms that the optical Si-sensitive features do respond to changes in Si abundance, but not in a clean or uniquely interpretable way at the velocity dispersion of NGC 1277.
The discrepancy likely stems from a critical limitation of optical spectra at the velocity dispersions typical of massive galaxies: the absence of clean, isolated features with strong sensitivity to Si. While Si-sensitive indices are formally included in optical index libraries (e.g. Serven et al. 2005), they are dominated by blended contributions from multiple elements, particularly in smoothed spectra with high velocity dispersion. Specifically, the commonly used SiI3905 Å line is significantly blended with CH molecular features, especially problematic in cool giants (Cayrel et al., 2004), while the SiI4102 Å line lies on the wing of the strong Hδ absorption, further complicating accurate abundance determinations (Cohen et al., 2004). We also inspected the red Si-sensitive windows at 5661–5671, 5685–5695, 5767–5777, 6150–6160, and 6232–6250 Å. However, in the NGC1277 spectrum, several of these regions are affected by broad continuum distortions and residual structures that are not present in either the XSG stack or the stellar population models. We therefore did not use these narrow optical windows to derive additional quantitative Si abundance constraints.
These limitations likely contribute to contradictory results in the literature. For example, Worthey et al. (2014) report [Si/Fe] abundances that are systematically higher than [Mg/Fe] in their galaxy sample. However, their estimates rely heavily on blue SiH molecular features, which are not well isolated in index-based analyses and are difficult to model reliably with synthetic spectra. As a result, their [Si/Fe] values are particularly sensitive to subtle systematics in the input data, leading to potentially unstable or uncertain abundance determinations. In contrast, Conroy et al. (2014), employing full spectral fitting with flexible IMFs and high-resolution synthetic models, often report higher [Mg/Fe] than [Si/Fe] (e.g. their Fig. 19). Yet because full spectral fits optimise the entire spectrum simultaneously without directly evaluating the quality of Si-dominated regions, it is not always clear how well constrained the [Si/Fe] values are in these analyses.
Altogether, these uncertainties emphasise the limitations of optical diagnostics for silicon. The optical analysis recovers a relative Si enhancement in NGC 1277 compared to massive ETGs, but with a smaller absolute amplitude than inferred from the NIR. We therefore regard the optical–NIR difference as a systematic uncertainty in the absolute abundance scale. In contrast, the NIR features used in our analysis are stronger, less blended, and more sensitive to Si abundance variations. These advantages make the NIR regime the preferred spectral window for tracing Si enrichment in stellar populations.
Appendix F Elemental abundance trends: [Si/Fe] and [Mg/Fe] versus progenitor mass
Complementing Fig. 2 in the main text, we present in Fig. 7 the predicted [Si/Fe] and [Mg/Fe] values as a function of SN progenitor mass and metallicity. These plots provide the underlying elemental abundance trends from which the [Si/Mg] ratio is derived, enabling a more complete interpretation of our results.

One can see that the [Mg/Fe] values for both galaxy samples fall within the range of predictions from all types of SNe . The [Mg/Fe] values are also consistent with estimates from optical studies (Trujillo et al., 2014), with NGC 1277 showing a slightly higher [Mg/Fe] enhancement than massive ETGs. In contrast, the [Si/Fe] panel shows a clear divergence: the high [Si/Fe] values inferred for NGC 1277 are best matched by models of metal-free SN progenitors, in particular a subset of PISNe with initial masses above 150 M⊙. A few of these PISN models predict [Si/Fe] values even higher than those observed in NGC 1277.
These results reinforce the interpretation that the unusually high [Si/Mg] ratio in NGC 1277 originates from the combined effect of elevated [Si/Fe] and modest [Mg/Fe], both shaped by enrichment from early, massive, and likely metal-free progenitors.