

A Bayesian Functional Accelerated Failure-Time Model with Varying Effects Correcting for Measurement Error
Abstract
Functional data collected as continuously observed trajectories arise naturally in many biomedical settings, and a key inferential goal is understanding how such functional covariates relate to time-to-event outcomes while allowing that relationship to vary across subgroups defined by scalar characteristics. Existing frequentist approaches to functional accelerated failure-time (AFT) models struggle to flexibly capture the joint, nonlinear influence of scalar covariates and time on the functional effect, and none adequately address the measurement error that frequently contaminates functionally observed exposures. We propose a Bayesian functional AFT model in which the functional coefficient is a varying effect function of both time and a set of scalar covariates, modeled through a Gaussian process single-index structure that provides a flexible, nonlinear framework for subgroup modification. Measurement error in the functional covariate is handled by pairing a proxy observation with an instrumental variable that accommodates non-linear associations with the latent functional exposure. A prominent source of such functional data is wearable devices, which can continuously monitor physical activity (PA) behavioral patterns — such as step counts — over time, yet whose outputs are well known to be prone to measurement error and to exhibit heterogeneous associations with health outcomes across demographic subgroups. Through simulations, we show that our approach recovers the true varying functional effects and reduces bias relative to naïve models that ignore measurement error. We apply our methods to the Reasons for Geographical and Racial Differences in Stroke (REGARDS) study to investigate how step-count physical activity relates to time-to-death from ischemic stroke across racial and regional groups.
1 Introduction
In many scientific domains where predictors are observed as trajectories over a continuous scale, functional data analysis has become a widely used framework with applications in health monitoring, environmental exposures, and longitudinal behavioral studies. A central objective in these settings is to understand how functional covariates relate to scalar outcomes, including time-to-event responses in epidemiological and biomedical research. Functional data survival analysis, including scalar-on-function regression, enables investigation of the association between function-valued trajectories and time-to-event scalar outcomes, with early developments based on Cox proportional hazards (PH) models with functional time-varying predictors (\@BBOPcitet\@BAP\@BBNMüller and Stadtmüller 2005\@BBCP). Subsequent work has extended these ideas using penalized likelihoods (\@BBOPcitet\@BAP\@BBNGoldsmith et al. 2011\@BBCP) and functional generalized additive models (\@BBOPcitet\@BAP\@BBNMcLean et al. 2014\@BBCP). While the functional Cox PH model is commonly used as a flexible semi-parametric method, functional accelerated failure-time (AFT) models offer a parametric alternative that directly models survival time and can yield improved fits when the proportional hazards assumption is violated (\@BBOPcitet\@BAP\@BBNGencer 2025\@BBCP). Efficient estimation techniques and asymptotic inference for functional AFT models have also been developed by \@BBOPcite\@BAP\@BBNLiu et al. (2025)\@BBCP, while related work has demonstrated the practical utility of functional AFT models in the application of longitudinal biomarkers (\@BBOPcitet\@BAP\@BBNQian et al. 2025\@BBCP).
In practice, functional covariates are often subject to uncertainty arising from imperfect observation processes, including device mis-calibration and incomplete recordings. As a result, the observed functional covariate may be viewed as a proxy for an unobserved latent covariate. One principled approach to addressing this uncertainty is through measurement error modeling, where studies have suggested that failure to account for such discrepancies can induce bias in model parameters (\@BBOPcitet\@BAP\@BBNCarroll et al. 2006\@BBCP). Methods for correcting measurement error in covariates include regression calibration (\@BBOPcitet\@BAP\@BBNSpiegelman et al. 1997\@BBCP, \@BBOPcitet\@BAP\@BBNWang and Song 2021\@BBCP), but can be computationally costly when extended to high-dimensional functional data. Mixed-effects model-based (MEM) approaches address this through two-stage procedures in which the latent functional covariate is first estimated and then incorporated into the outcome model (\@BBOPcitet\@BAP\@BBNLuan et al. 2023\@BBCP). Furthermore, Bayesian hierarchical models offer a flexible alternative by explicitly modeling the functional covariate as a latent process, allowing both the relationship between the outcome and the latent process, as well as the relationship between the observed surrogate and the latent covariate, to be modeled flexibly within a unified framework (\@BBOPcitet\@BAP\@BBNSinha et al. 2010\@BBCP).
In addition to measurement error, the effect of functional covariates may vary across individuals depending on observed characteristics. In many biomedical and epidemiology studies, the association between physical activity trajectories and health outcomes may vary across individuals due to underlying heterogeneity in population characteristics. Assuming a common population-level functional effect in such settings can obscure important effect modification and lead to oversmoothed or misleading inference. These considerations have motivated the development of varying-coefficient models that allow covariate effects to vary smoothly with modifying variables, beginning with the work by \@BBOPcite\@BAP\@BBNHastie and Tibshirani (1993)\@BBCP. More recently, Bayesian approaches have emerged as flexible alternatives for modeling heterogeneous effects. For example, Bayesian tree-based varying-coefficient models proposed by \@BBOPcite\@BAP\@BBNDeshpande et al. (2020)\@BBCP represent regression effects through additive ensembles of trees. In the context of functional data analysis, \@BBOPcite\@BAP\@BBNGuhaniyogi et al. (2022)\@BBCP developed Bayesian approaches to varying coefficient models with Gaussian process priors that allow regression effects to smoothly vary with scalar covariates. \@BBOPcite\@BAP\@BBNWu et al. (2010)\@BBCP provide a foundational frequentist approach to varying-coefficient functional regression, where the regression surface is modeled as a smooth function of the modifying covariate and employs functional principal component analysis with local polynomial smoothing to estimate covariate-specific effects. While this method demonstrates improved interpretability and predictive performance, it is limited to least-squares regression for continuous outcomes and does not accommodate censoring in time-to-event responses and measurement error in functional covariates within a unified probabilistic model.
In this work, we propose a Bayesian scalar-on-function accelerated failure-time model that jointly addresses censoring, measurement error in functional covariates, and covariate-dependent heterogeneity in functional effects. To date, most of the existing methodologies above address these challenges in isolation. Our modeling approach integrates a flexible single-index varying-effect structure with measurement error correction using an observed proxy and an instrumental variable. This unified framework enables coherent posterior inference for subgroup-specific functional effects while reducing bias induced by measurement error.
2 Model Approach
2.1 Model Specification
We consider right-censored survival data where and denote the true survival and censoring time respectively for individuals . Suppose each individual is observed with survival time , error-free scalar covariates , and , then the scalar-on-function accelerated failure-time model with functional covariates subject to measurement error is
| (1) | ||||
| (2) |
The coefficient is a function of both time and the subject-specific scalar covariates , thereby accommodating heterogeneity in the functional effect of across individuals. We assume are i.i.d. and follow distributions commonly used in accelerated failure time models (e.g. normal, logistic, exponential, etc). is an unbiased proxy of observed with measurement error that is modeled as a mean-zero Gaussian process with . Following previous work on measurement error modeling (\@BBOPcitet\@BAP\@BBNSarkar et al. 2018\@BBCP and \@BBOPcitet\@BAP\@BBNZoh et al. 2024\@BBCP), the model is not identifiable based solely on the observed proxy , and thus requires additional assumptions to estimate the model parameters. Therefore, in addition to models 1 and 2, we assume the following model for the observed instrumental variable (IV)) as
| (3) |
Similar to model 2, we also assume that is a mean-zero Gaussian process with . The scaling function allows a nonlinear association between and over time due to systematic differences in measurement conditions, such as weekday and weekend activity patterns. For estimation, we scale the instrumental variable by given that so that the model in (3) yields
| (4) |
where .
2.2 Dimension reduction
To reduce computational complexity and enable flexible modeling of effect heterogeneity, we adopt the basis expansion and single-index structure proposed by \@BBOPcite\@BAP\@BBNLi et al. (2010)\@BBCP. More specifically, we preselect basis functions (e.g., B-splines, Fourier, or functional principal components) and represent the varying effect function as
| (5) |
are smooth univariate functions that vary with the single-index projection , where the vector of weights lies on the unit sphere (i.e., ) and is shared across all components, ensuring identifiability and reducing the multivariate dependence of to a single direction. Applying the same basis to the latent functional covariate , define the corresponding scores , , and and let , and . Substituting these expansions into models (1)-(4) gives the reduced-rank system
| (6) | ||||
| (7) | ||||
| (8) |
and assume that , , and .
2.3 Imputation of Censored Individuals
In many works involving a Bayesian approach to fitting survival models, data augmentation is routinely leveraged to resolve complex censoring and thereby efficiently derive likelihood computations. See, for example, \@BBOPcite\@BAP\@BBNTanner and Wong (1987)\@BBCP. More specifically, by augmenting the model with latent log-event times for censored objects, we effectively bypass the survival-function term in the likelihood with a normal density evaluation truncated on the censoring threshold. In the conventional observed-data likelihood, censored observations require integration over the upper tail of the error distribution, which renders the model non-conjugate and greatly complicates MCMC updates. Following the data-augmentation approach in \@BBOPcite\@BAP\@BBNMaity et al. (2019)\@BBCP, censored log-survival times are imputed via truncated normal distributions at each step within the MCMC posterior sampling (see supplementary material).
2.4 Model Assumptions and Priors
We adopt a hierarchical Bayesian framework with priors specified for the model components. Diffuse priors are assigned to the fixed effects , and the single-index weights are constrained to a unit sphere using a Fisher-von Mises prior (\@BBOPcite\@BAP\@BBNAntoniadis et al. (2004)\@BBCP) for identifiability. The varying-effect functions are modeled using a Gaussian process prior (\@BBOPcitet\@BAP\@BBNChoi et al. 2011\@BBCP) to capture smooth nonlinear dependence on the linear combination of scalar covariates . Hyperparameters governing the covariance structure and smoothness of this Gaussian process are assigned with weakly informative priors similar to \@BBOPcite\@BAP\@BBNShi et al. (2005)\@BBCP and \@BBOPcite\@BAP\@BBNNeal and others (2011)\@BBCP. For the measurement error model in equation (7), with and . For the instrumental variable model in equation (8), and .
2.5 Posterior
Posterior inference is conducted using a Metropolis-within-Gibbs sampler. The form of the conditional posterior distributions are outlined in section S.4 of the supplementary material. To update the high-dimensional matrix of varying-effect coefficients, we employ the fast Gaussian sampling algorithm of \@BBOPcite\@BAP\@BBNBhattacharya et al. (2016)\@BBCP, which enables efficient sampling without explicit matrix inversion. The proposed Bayesian framework provides inference for the model parameters from the MCMC draws, and facilitates inference on subject-specific functional effects through the latent functional covariates .
3 Simulation
To assess the performance of the proposed Bayesian functional varying-effects AFT model, we conducted a comprehensive simulation study using physical activity trajectories from the National Health and Nutrition Examination Survey (NHANES) cohort. Consistent with previous empirical simulation studies of functional accelerometry data (\@BBOPcitet\@BAP\@BBNParker and Holan 2023\@BBCP, \@BBOPcitet\@BAP\@BBNGhosal et al. 2023\@BBCP), we generate datasets containing informative samples with realistic characteristics of the covariates, functional predictors, and model parameters are drawn directly from the NHANES cohort. Specifically, weekday and weekend average minute-level monitor-independent movement summary (MIMS) measurements were calculated for each individual. The latent functional covariate was defined as the log-transformed weekday-average MIMS trajectory. From each individual, we also retained two continuous scalar covariates and a binary subgroup indicator . True values of the functional effects corresponding to the two subgroups defined by were obtained by fitting general additive models with the mgcv package, and illustrated as dashed lines in Figure 3.
We considered a factorial simulation design examining different sample sizes, measurement error noise, censoring levels, and correlation structures in the functional measurement error process. Specifically, we examined sample sizes corresponding to small and large cohort settings, and simulated survival times from the accelerated failure-time model , where follows a normal distribution and . Right-censoring times were generated independently from an exponential distribution with the censoring rate calibrated with a root-finding algorithm similar to \@BBOPcite\@BAP\@BBNWan (2017)\@BBCP to achieve targeted censoring levels of approximately 40% or 80%. We simulated the observed proxy functional covariate as , where is a mean-zero Gausssian process with variance and correlation . The instrumental variable is simulated based on weekend-average MIMS trajectories log-transformed similar to , and scaled by a time-varying function defined as the ratio of weekend-to-weekday average MIMS. Similar to , is a mean-zero Gaussian process with and correlation . An example of the functional covariates and for a dataset simulated with and is shown in Figure 1. Additionally, we considered simulation cases with increased confounding between the scalar covariates and latent functional covariate. In these cases, we induce dependency of through the basis coefficients used to construct , resulting in larger correlations between and across time.

We generated 800 replicated datasets and compare four modeling approaches: (i) an oracle MCMC approach assuming the latent function covariate is fully observed without and , (ii) a naive MCMC approach that replaces with and does not correct for measurement error, (iii) the full MCMC approach that jointly corrects for measurement error, and (iv) subgroup-specific functional AFT models fitted using mgcv::gam. To evaluate estimation accuracy across simulation replicates, we computed the Monte Carlo root mean squared error (RMSE) and mean integrated squared error (MISE) for the scalar fixed effects and functional effect respectively. More specifically, let denote the true functional effect for the subject from the replicate evaluated at the time point on a grid where , and denote the corresponding posterior mean estimate. We computed the subject-averaged integrated squared error and report the mean integrated squared error (MISE) across replicates. That is,
| (9) | ||||
| (10) |
3.1 Results
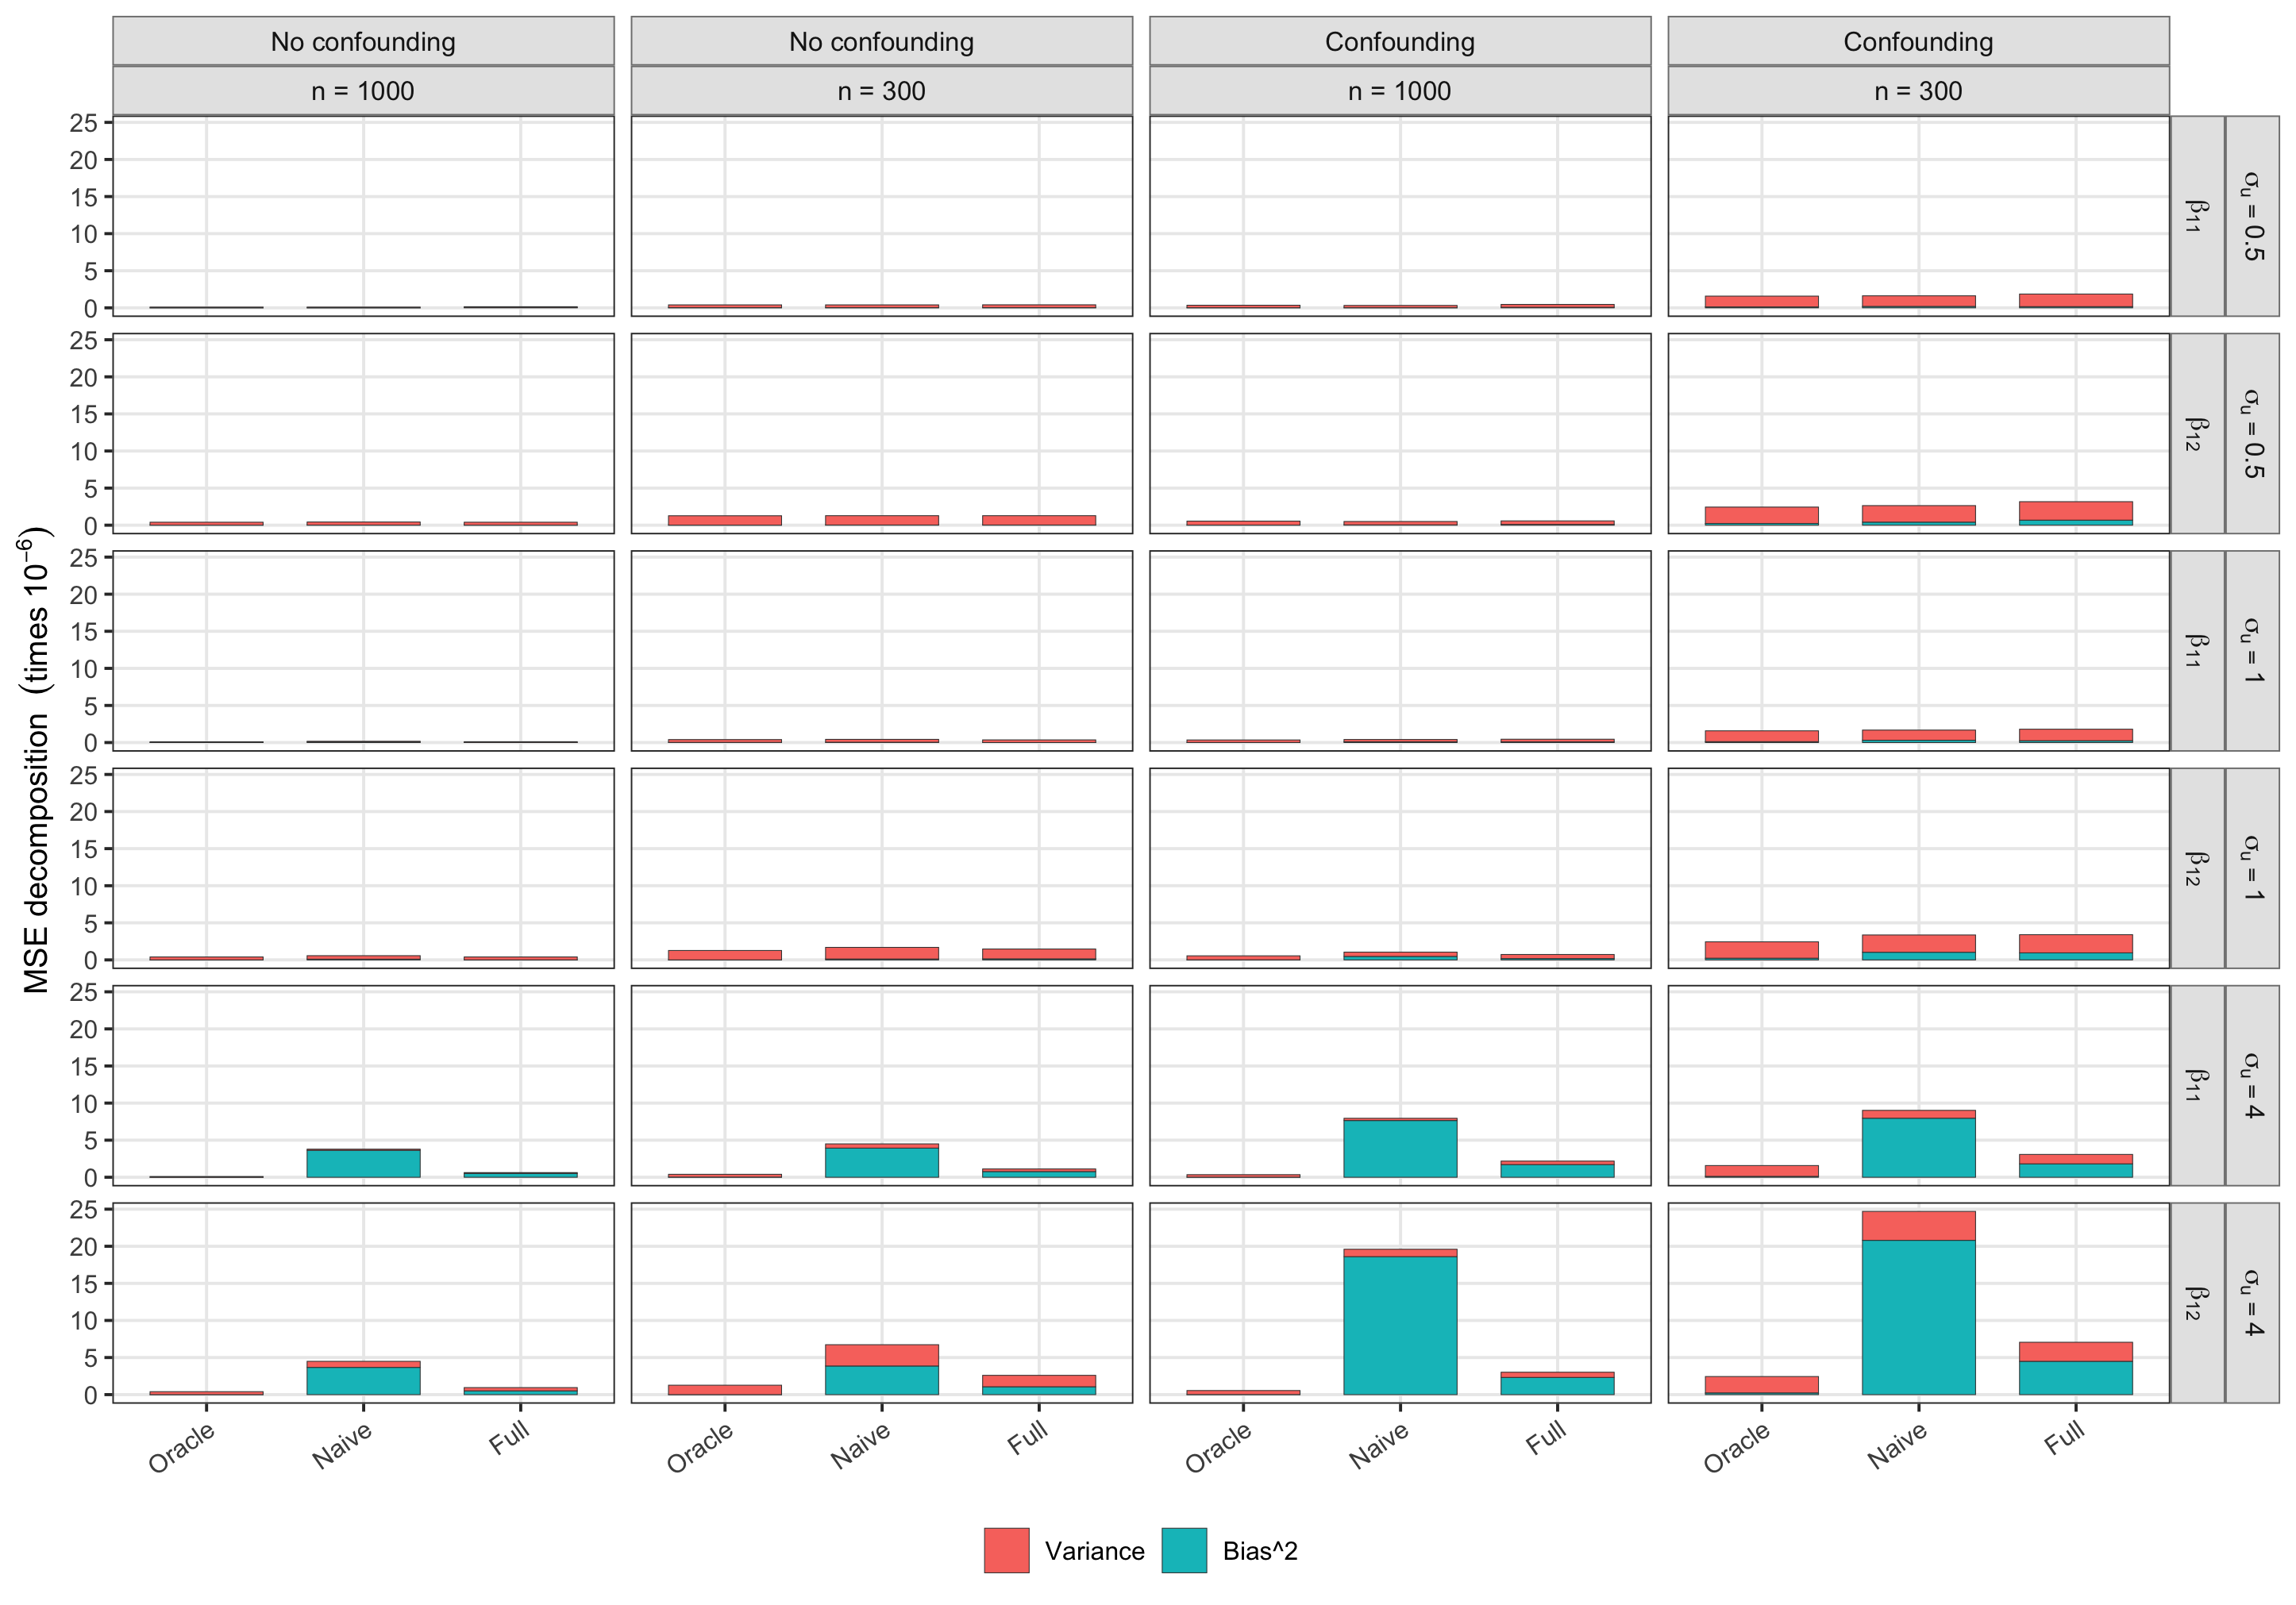
Figure 2 summarizes the Monte Carlo mean squared error (MSE) and squared bias for the scalar fixed effects across all simulation scenarios. Under the first simulation setting where the scalar covariates are generated independently of the latent , all approaches produce relatively small MSE values, particularly when the measurement error variance is low and the sample size is large. As increases, both the naive and full approaches exhibit increases in MSE and squared bias, although the deterioration is generally less pronounced for the full approach. Overall, the differences between the naive and full approaches remain modest, suggesting that measurement error in the functional covariate has a limited impact on estimation of the scalar regression coefficients when no confounding is present.
We next examine the estimation of the functional varying effect across all competing approaches in Table 1. We simulated datasets with and measurement error variances of , and . At each setting of , we compared the MISE performance across different sample sizes, correlation levels in , and censoring levels. Since the oracle approach assumes the latent functional covariate to be observed, its MISE values remain unchanged across different values of and serve as a benchmark for comparison. Under low measurement error (), the naive approach achieves MISE values comparable to the oracle approach since the observed proxy is similar to . However, as increases, the MISE values from the naive approach increase substantially. This behavior is illustrated in Figure 3, where the credible intervals corresponding to the naive approach do not fully capture the true effect in some time periods. We further observe that increasing the correlation level generally leads to larger MISE values for the naive approach, with the deterioration becoming more pronounced as increases. In contrast, the full approach that estimates the latent is less sensitive to increasing measurement error and generally outperforms the naive approach under larger values of , , and sample sizes. The subgroup-specific general additive models fitted using mgcv::gam consistently exhibits higher MISE values than the Bayesian approaches, which is expected since the subgroup models do not assume a functional varying effect, nor do they explicitly model measurement error in the functional covariate. Simulation settings with censoring levels at 80% showed higher MISE values across all methods, since a greater proportion of survival times were imputed during posterior sampling. Despite this, the full approach continues to outperform the naive method across censoring levels. Together, these results demonstrate that estimation of the functional varying effect without correcting for measurement error can result in biased estimates with larger MISE values, particularly when the measurement error process exhibits high variance and strong temporal correlation.
We next consider simulations with possible confounding between the scalar and latent functional covariates. Specifically, we induced dependence between and through the basis coefficients used to construct the latent functional trajectories. Under this setting, the measurement error in the functional covariates may potentially affect estimation of both the scalar fixed effects and the functional varying effect through the induced dependence structure. As shown in Figure 2, the MSE values for the scalar fixed effects are generally higher compared to the previous simulation setting, with the increase drivenprimarily by squared bias rather than variance. The increase in MSE is particularly pronounced for the naive approach under larger values of . Decomposition of the MSE shows that the deterioration is primarily from increased bias, while the variance remains comparatively stable. Thus, the induced dependence allows measurement error in the functional covariate to introduce systematic bias into estimation of the scalar covariate fixed effects.
Table 2 summarizes the estimation results of the functional varying effect under the second simulation setting. Compared to the results in Table 1, the presence of the scalar covariates as a confounder led to larger MISE values across all approaches. Investigation of the average squared bias and average variance in the MISE decomposition reveals that the increase is primarily driven by bias, while the variance remains comparatively stable across simulation settings. The effect is particularly pronounced for the naive method, where settings with larger values of show heavily deteriorated bias and MISE values. While the full approach also exhibits larger MISE under increased , the deterioration is comparatively milder and indicates how modeling the latent can mitigate the bias introduced by measurement error in . As in the first simulation setting, the MISE values for all methods are lower for settings with larger sample sizes. Overall, these results suggest that the presence of measurement error primarily impacts the estimation of functional varying effects through increased bias, with the impact becoming more pronounced in the presence of confounding.
| 40% Censoring | 80% Censoring | |||||
|---|---|---|---|---|---|---|
| Method | ||||||
| Oracle | 300 | – | 0.0248 | 0.0871 | ||
| 1000 | – | 0.0080 | 0.0256 | |||
| Naive | 300 | 0.50 | 0.0254 | 0.0262 | 0.0318 | 0.0872 |
| 1.00 | 0.0285 | 0.0318 | 0.0619 | 0.0900 | ||
| 4.00 | 0.1069 | 0.1423 | 0.2337 | 0.1628 | ||
| 1000 | 0.50 | 0.0085 | 0.0091 | 0.0158 | 0.0256 | |
| 1.00 | 0.0117 | 0.0155 | 0.0499 | 0.0320 | ||
| 4.00 | 0.0976 | 0.1344 | 0.2297 | 0.1333 | ||
| Full | 300 | 0.50 | 0.0470 | 0.0463 | 0.0432 | 0.1588 |
| 1.00 | 0.0438 | 0.0424 | 0.0390 | 0.1628 | ||
| 4.00 | 0.0417 | 0.0457 | 0.0602 | 0.1410 | ||
| 1000 | 0.50 | 0.0169 | 0.0163 | 0.0139 | 0.0397 | |
| 1.00 | 0.0148 | 0.0138 | 0.0130 | 0.0358 | ||
| 4.00 | 0.0172 | 0.0252 | 0.1065 | 0.0625 | ||
| mgcv::gam | 300 | – | 0.4638 | 0.4768 | ||
| 1000 | – | 0.4606 | 0.4594 | |||

| Method | AVar | MISE | AVar | MISE | ||||||
|---|---|---|---|---|---|---|---|---|---|---|
| Oracle | 300 | – | 0.0118 | 0.0119 | 0.0237 | 1000 | – | 0.0016 | 0.0058 | 0.0074 |
| Naive | 300 | 0.5 | 0.0138 | 0.0114 | 0.0252 | 1000 | 0.5 | 0.0028 | 0.0058 | 0.0086 |
| 300 | 1.0 | 0.0202 | 0.0107 | 0.0309 | 1000 | 1.0 | 0.0095 | 0.0051 | 0.0146 | |
| 300 | 4.0 | 0.1280 | 0.0066 | 0.1346 | 1000 | 4.0 | 0.1230 | 0.0027 | 0.1257 | |
| Full | 300 | 0.5 | 0.0244 | 0.0122 | 0.0366 | 1000 | 0.5 | 0.0058 | 0.0086 | 0.0144 |
| 300 | 1.0 | 0.0240 | 0.0122 | 0.0362 | 1000 | 1.0 | 0.0053 | 0.0085 | 0.0138 | |
| 300 | 4.0 | 0.0271 | 0.0151 | 0.0422 | 1000 | 4.0 | 0.0131 | 0.0162 | 0.0293 |
4 Application
We applied the proposed Bayesian functional varying-effects AFT model to data from the Reasons for Geographic and Racial Differences in Stroke (REGARDS) study, a national prospective cohort initiated between 2003 and 2007 enrolling 30,239 adults aged 45 and above, with oversampling in the southeastern “stroke belt” region to investigate racial and geographic disparities in stroke and cardiovascular disease (\@BBOPcitet\@BAP\@BBNHoward et al. 2005\@BBCP). Previous analyses of the REGARDS cohort have primarily used Bayesian hierarchical models to study spatial and demographic heterogeneity in scalar cardiovascular health outcomes (\@BBOPcitet\@BAP\@BBNTabb et al. 2022\@BBCP). Our analyses included 1,268 individuals with complete accelerometer data for a full week. Given the distinct roles of race and geographic regions in the REGARDS study, we conducted two separate analyses in which the functional varying effect was allowed to vary with either race or region, along with season and the Life’s Simple Seven (LS7) score. The LS7 score is a composite measure of behavioral and biological risk factors (e.g. blood pressure, smoking habits, and BMI) related to cardiovascular health, where previous studies of the REGARDS cohort have demonstrated that changes in cardiovascular health are more effectively captured through an aggregate LS7 score compared to its separate behavioral and clinical components (\@BBOPcitet\@BAP\@BBNGarg et al. 2018\@BBCP, and \@BBOPcitet\@BAP\@BBNLiu et al. 2021\@BBCP). To account for systematic differences in physical activity across days of the week (\@BBOPcitet\@BAP\@BBNTo et al. 2022\@BBCP), we treated the log-transformed weekday and weekend average activity binned to five-minute intervals as the observed proxy () and instrumental variable () respectively. Figures 4 and 5 display the weekday and weekend average activity respectively for representative individuals across the subgroup categories of interest, with subgroup mean trajectories overlaid. The scalar covariates considered in our analyses include age, gender, cancer history, and the neighborhood socioeconomic score (NSES).


We used the priors discussed in Section 2.4 and ran our MCMC for 10,000 iterations discarding 2,000 as burn-in. For the race-based analysis, the estimated functional varying effect shows a broadly consistent pattern across the two racial subgroups, with physical activity having the strongest positive association to longer survival times during the morning and mid-day hours (approximately 06:00 to 17:00). Figure 6 illustrates the estimated functional effect as a function of race, season, and LS7 score. Across both racial groups and seasonal panels, the estimated curves share similar curvatures and magnitudes. An increasing gradient pattern associated with LS7 score is visible, with higher LS7 scores corresponding to higher values of throughout the day. The overlapping credible interval bands across race groups and seasons suggest modest differences between these groupings. Overall, the estimated association between physical activity and survival appears largely consistent across the examined subgroups.

We next examine the analysis where the functional varying effect assumes heterogeneity based on geographic region, season, and LS7 scores. The posterior estimate of the functional effect shows temporal patterns consistent with those observed in the previous race-based analysis, with effects increasing from early morning and declining later in the day. Across regions, the functional varying effects exhibit similar magnitudes and shapes, with overlapping corresponding credible interval bands. While a modest gradient associated with LS7 score is visible, the overall pattern remains consistent across regions and seasons. These findings suggest that geographic region does not contribute to heterogeneity in the estimated relationship between physical activity and survival time.

We evaluated predictive performance using the integrated Brier score (IBS) and concordance C index. Predictions were constructed using both the naive MCMC approach based on the observed proxy , and the full MCMC approach using posterior-based recovery of the latent functional covariate . As shown in Table 3, the full approach correcting for measurement error yields the lowest IBS in both the race-and region-based analyses, although improvements relative to the naive approach are modest. A similar ordering is observed for the C-index, with the full MCMC approach achieving the highest concordance, followed by the naive approach and the mgcv::gam model that ignores varying effects. These results indicate that accounting for measurement error improves predictive accuracy, while both Bayesian approaches outperform the subgroup-specific general additive models. The scaling function was estimated empirically as and treated as fixed during posterior sampling, consistent with previous work (\@BBOPcitet\@BAP\@BBNZoh et al. 2024\@BBCP). Table 4 summarizes posterior mean estimates and 95% credible intervals for the error-free scalar covariates in both race- and region-based analyses. Age exhibits a consistent negative association with log-survival time, while the effects of gender, cancer history, and NSES are comparatively modest with credible intervals containing zero.
| Method | Race-based | Region-based |
|---|---|---|
| Full MCMC | 0.7262 (0.0479) | 0.7396 (0.0494) |
| Naive MCMC using | 0.7195 (0.0491) | 0.7300 (0.0488) |
| mgcv::gam ignoring varying effects | 0.6880 (0.0591) | 0.6880 (0.0591) |
| Race | Region | |||
|---|---|---|---|---|
| Covariate | Mean | 95% Credible interval | Mean | 95% Credible interval |
| Intercept | 2.9235 | (2.4634, 3.3601) | 3.0087 | (2.6301, 3.4390) |
| Gender (male) | -0.1012 | (-0.2301, 0.0275) | -0.1017 | (-0.2301, 0.0228) |
| Age | -0.1723 | (-0.2494, -0.1009) | -0.1771 | (-0.2489, -0.1089) |
| Cancer (yes) | -0.1251 | (-0.3124, 0.0591) | -0.1318 | (-0.3156, 0.0509) |
| DASH | 0.0351 | (-0.0295, 0.1022) | 0.0281 | (-0.0356, 0.0915) |
| NSES | 0.0056 | (-0.0072, 0.0187) | 0.0052 | (-0.0074, 0.0179) |
5 Conclusion
In this work, we proposed a Bayesian scalar-on-function accelerated failure time model that accommodates covariate-dependent functional effects and corrects for measurement error in functional predictors. Our proposed framework integrates Gaussian process single-index structures and instrumental variable-based measurement error modeling, enabling flexible inference on heterogeneous functional associations with survival outcomes, and posterior inference through an efficient Metropolis-within-Gibbs sampler.
Simulation studies demonstrate that the proposed method achieves higher estimation accuracy than naive approaches that ignore measurement error, particularly under substantial noise in the observed functional covariate. Across a range of scenarios, the model recovers the underlying varying-effect structure, highlighting the importance of jointly modeling measurement error and heterogeneous effects in functional survival analysis. In the REGARDS cohort application, the estimated functional varying effect exhibited broadly similar patterns across race, region, and seasons, with modest variation associated with the Life’s Simple 7 score. These findings suggest that the relationship between physical activity and survival is largely consistent across the examined subgroups, while revealing heterogeneity related to cardiovascular health status. Compared with subgroup-specific frequentist approaches, the proposed framework provides a unified model that captures subgroup-specific functional effects while maintaining comparable fixed-effect estimates across model specifications.
Future work may extend the proposed framework in several directions. Alternative representations of the varying functional effect, such as tensor product basis expansions, may proide greater flexibility in capturing interactions between time and scalar covariates. More flexible distributional assumptions, including Dirichlet process mixture-based error models, could improve robustness to departures from Gaussian assumptions. Finally, scalable alternatives such as variational inference or integrated nested Laplace approximations may be advantageous for large-scale applications.
6 Acknowledgments
This research was supported by the National Institutes of Health under grants R01DK136994 and R01DK132385.
References
- Bayesian estimation in single-index models. Statistica Sinica, pp. 1147–1164. Cited by: §2.4.
- Fast sampling with gaussian scale mixture priors in high-dimensional regression. Biometrika, pp. asw042. Cited by: §2.5.
- Measurement error in nonlinear models: a modern perspective, second edition. Chapman and Hall. Cited by: §1.
- A gaussian process regression approach to a single-index model. Journal of Nonparametric Statistics 23 (1), pp. 21–36. Cited by: §2.4.
- VCBART: bayesian trees for varying coefficients. arXiv preprint arXiv:2003.06416 2, pp. 32–33. Cited by: §1.
- Usefulness of the american heart association’s life simple 7 to predict the risk of atrial fibrillation (from the reasons for geographic and racial differences in stroke [regards] study). The American journal of cardiology 121 (2), pp. 199–204. Cited by: §4.
- Lung cancer survival analysis: a comparative evaluation of cox proportional hazards and accelerated failure time models: an analytical study. Türkiye Klinikleri. Tip Bilimleri Dergisi 45 (1), pp. 8–16. Cited by: §1.
- Functional proportional hazards mixture cure model and its application to modelling the association between cancer mortality and physical activity in nhanes 2003-2006. arXiv preprint arXiv:2302.07340. Cited by: §3.
- Penalized functional regression. Journal of Computational and Graphical Statistics 20 (4), pp. 830–851. Cited by: §1.
- Distributed bayesian varying coefficient modeling using a gaussian process prior. Journal of machine learning research 23 (84), pp. 1–59. Cited by: §1.
- Varying-coefficient models. Journal of the Royal Statistical Society Series B: Statistical Methodology 55 (4), pp. 757–779. Cited by: §1.
- The reasons for geographic and racial differences in stroke study: objectives and design. Neuroepidemiology 25 (3), pp. 135–143. Cited by: §4.
- Generalized functional linear models with semiparametric single-index interactions. Journal of the American Statistical Association 105 (490), pp. 621–633. Cited by: §2.2.
- Efficient estimation for functional accelerated failure time models. Biometrika 112 (2), pp. asaf011. Cited by: §1.
- Change in life’s simple 7 measure of cardiovascular health after incident stroke: the regards study. Stroke 52 (3), pp. 878–886. Cited by: §4.
- Scalable regression calibration approaches to correcting measurement error in multi-level generalized functional linear regression models with heteroscedastic measurement errors. arXiv preprint arXiv:2305.12624. Cited by: §1.
- Integration of survival and binary data for variable selection and prediction: a bayesian approach. Journal of the Royal Statistical Society. Series C (Applied Statistics) 68 (5), pp. pp. 1577–1595. External Links: ISSN 00359254, 14679876 Cited by: §2.3.
- Functional generalized additive models. Journal of Computational and Graphical Statistics 23 (1), pp. 249–269. Cited by: §1.
- Generalized functional linear models. Cited by: §1.
- MCMC using hamiltonian dynamics. Handbook of markov chain monte carlo 2 (11), pp. 2. Cited by: §2.4.
- A bayesian functional data model for surveys collected under informative sampling with application to mortality estimation using nhanes. Biometrics 79 (2), pp. 1397–1408. Cited by: §3.
- Functional accelerated failure time models for predicting time since cannabis use. arXiv preprint arXiv:2510.22343. Cited by: §1.
- Bayesian semiparametric multivariate density deconvolution. Journal of the American Statistical Association 113 (521), pp. 401–416. Cited by: §2.1.
- Hierarchical gaussian process mixtures for regression. Statistics and computing 15 (1), pp. 31–41. Cited by: §2.4.
- Semiparametric bayesian analysis of nutritional epidemiology data in the presence of measurement error. Biometrics 66 (2), pp. 444–454. Cited by: §1.
- Regression calibration method for correcting measurement-error bias in nutritional epidemiology. The American journal of clinical nutrition 65 (4), pp. 1179S–1186S. Cited by: §1.
- Spatially varying racial inequities in cardiovascular health and the contribution of individual-and neighborhood-level characteristics across the united states: the reasons for geographic and racial differences in stroke (regards) study. Spatial and spatio-temporal epidemiology 40, pp. 100473. Cited by: §4.
- The calculation of posterior distributions by data augmentation. Journal of the American statistical Association 82 (398), pp. 528–540. Cited by: §2.3.
- Differences in physical activity between weekdays and weekend days among us children and adults: cross-sectional analysis of nhanes 2011–2014 data. Preventive Medicine Reports 28, pp. 101892. Cited by: §4.
- Simulating survival data with predefined censoring rates for proportional hazards models. Statistics in medicine 36 (5), pp. 838–854. Cited by: §3.
- Semiparametric regression calibration for general hazard models in survival analysis with covariate measurement error; surprising performance under linear hazard. Biometrics 77 (2), pp. 561–572. Cited by: §1.
- Varying-coefficient functional linear regression. Cited by: §1.
- A bayesian semi-parametric scalar-on-function regression with measurement error using instrumental variables. Statistics in Medicine 43 (21), pp. 4043–4054. Cited by: §2.1, §4.