
by
IPO-Mine: A Toolkit and Dataset for Section-Structured Analysis of Long, Multimodal IPO Documents
Abstract.
An Initial Public Offering (IPO) filing is a document released when a private firm goes public, allowing individual (retail) investors to purchase its shares. These filings describe a firm’s business, financials, and risks and are long, multimodal documents with narrative text and images. Despite their importance to financial markets, there is no large-scale, standardized dataset or benchmark for studying IPO filings with modern language and multimodal models. These documents pose significant challenges: filings frequently exceed 500,000 tokens and lack consistent structural organization. We introduce the IPO-Toolkit, an open-source framework for downloading and parsing IPO filings into standardized section-structured text and extracted images. The toolkit segments filings, extracts embedded images, and produces structured outputs that enable large-scale, reproducible analysis workflows over long, multimodal documents. Using this infrastructure, we construct the IPO-Dataset, a large, section-structured, multimodal dataset covering more than 109,000 IPO filings and amendments from 1994 to 2026 and containing over 76,000 images. We establish structured evaluation tasks over extracted financial charts, including chart quality and misleadingness assessment. Our experiments show that state-of-the-art multimodal models often diverge from expert human judgments on these tasks, exposing alignment challenges in multimodal reasoning over long, real-world regulatory documents. Beyond benchmarking, the IPO-Dataset enables large-scale analysis of section-level textual variation and cross-industry differences in visual and textual disclosure practices. Our code, dataset, and website are publicly available under CC-BY-4.0.
1. Introduction
To begin trading on public markets, a company must file an Initial Public Offering (IPO) registration with the U.S. Securities and Exchange Commission (SEC), disclosing detailed information about its business operations, financial condition, and risk exposure. These disclosures are submitted as S-1 statements for domestic issuers and F-1 statements for foreign issuers and are organized into sections such as Risk Factors, Prospectus Summary, and Legal Matters. IPO filings play a critical role in shaping investor expectations, regulatory oversight, and capital allocation, particularly as individual (retail) participation in IPO markets grows and increasingly influences demand, pricing, and share allocations (Bloomberg News, 2025).
Despite their importance, IPO filings are difficult to analyze. They routinely span hundreds of thousands of tokens and integrate heterogeneous content, including text, tables, and figures. As a result, direct end-to-end processing with large language models (LLMs) is both computationally expensive (Chen et al., 2024) and empirically unreliable at these lengths, even when inputs fall within claimed context limits (He et al., 2025; Zhang et al., 2024; Du et al., 2025). Beyond document length, IPO filings pose a structural challenge: filings vary widely in section ordering, labeling, and formatting across issuers and over time. Reliable section-level and multimodal analysis therefore requires methods that operate on long, heterogeneous documents. Prior work on financial text analysis has focused on standardized filings such as 10-K annual reports (Wang et al., 2025). As a result, existing tools target these filings and replicate proprietary platforms (Lonare et al., 2021; Loukas et al., 2021, 2025), but do not support reliable section-level extraction or multimodal processing for IPO filings.
To address these challenges, we introduce a toolkit and dataset for large-scale, section-aware, multimodal analysis of IPO filings. The suite consists of two core components: IPO-Toolkit, a processing framework for S-1 and F-1 filings, and IPO-Dataset (see Table 1), a structured multimodal dataset constructed using this toolkit. Together, they enable scalable analysis of textual and visual patterns across industries and over time. Our contributions are as follows:
-
•
IPO-Toolkit: An open-source Python framework for scalable processing of IPO filings (S-1/F-1), supporting both HTML and legacy ASCII formats and enabling structured and multimodal extraction from long regulatory documents.
-
•
IPO-Dataset: A large-scale, multimodal dataset of IPO filings (1994–2026) with section-aligned text and classified images to support longitudinal and cross-industry analysis.
-
•
Benchmark Suite: Human-annotated benchmarks for section extraction and image classification, providing standardized evaluation tasks for IPO understanding.
-
•
Disclosure Analysis: An empirical study of textual and visual disclosure trends using IPO-Dataset, including quantitative evaluation of misleading visual features across industries.
| Metric | Value |
|---|---|
| Number of Initial Filings | 20,819 |
| Number of IPO Filings | 109,690 |
| S-1 Filings | 18,813 |
| F-1 Filings | 2,006 |
| Amendments | 88,871 |
| Number of Images | 76,104 |
| Human Annotated Images | 2,400 |
| Years Covered | 1994–2026 |
2. Related Work
2.1. Benchmarking on Financial Text
Financial NLP benchmarks focus on earnings calls, 10-K filings, and news articles. FinBERT (Araci, 2019) was an early model for sentiment analysis, followed by FLANG (Shah et al., 2022), BloombergGPT (Wu et al., 2023), and FinGPT (Yang et al., 2023). Benchmarks range from dictionary-based sentiment analysis (Loughran and McDonald, 2011) to question answering and multi-label datasets, including FiQA (Maia et al., 2018), SubjECTive-QA (Pardawala et al., 2025), and World Central Banks (Shah et al., 2025a).
2.2. Multimodality in Finance
Multimodal signals in finance include earnings calls, financial news, and investor-facing media. Applications include vocal cues from earnings calls (Sawhney et al., 2020), numerical data fused with news (Ang and Lim, 2022), headline–market alignment in FNSPID (Dong et al., 2024), visual sentiment in investor media (Gu et al., 2025), financial short-form video captioning (Sukhani et al., 2025), and influencer stock recommendations from video, transcript, and audio signals (Galarnyk et al., 2025a).
2.3. Analyzing Charts and Visual Elements
Visual elements are central to financial communication but remain difficult for models to interpret reliably. Benchmarks such as SciHorizon (Qin et al., 2025) and SPIQA (Pramanick et al., 2025) evaluate structured reasoning and question answering over figures, while Thibault et al. (2025) show that categorical figure labels can obscure what models actually learn. Misleading-visualization studies examine deceptive chart features from web-sourced or synthetic examples (Lo and Qu, 2025; Chen et al., 2025), and REVEAL (Jindal and Deshpande, 2025) shows that visual misinformation becomes harder to detect in multi-turn settings.
3. IPO-Dataset and Construction
We introduce IPO-Dataset, a large-scale, section-aligned, multimodal corpus of IPO filings from 1994–2026. The dataset is constructed from public SEC EDGAR filings and is not subject to copyright protection (U.S. Congress, 2011), enabling redistribution for research use. Dataset construction is supported by a Python toolkit that deterministically extracts document structure, filing text, and images.111https://pypi.org/project/ipo-mine/
3.1. IPO-Toolkit
We implement a structure-first dataset construction pipeline as a modular Python package built on top of the SEC EDGAR API. The toolkit enables deterministic, structure-aware extraction of IPO text and images directly from EDGAR source files and supports both legacy ASCII and modern HTML formats used in IPO filings. Although EDGAR provides programmatic access to filings, it lacks IPO-specific functionality required for analysis. For example, filings are indexed by Central Index Keys (CIKs) rather than tickers, recent and historical submissions are distributed across index tables, and embedded images are not directly exposed. IPO-Toolkit extends EDGAR with additional capabilities needed for dataset construction, including resolving ticker-to-CIK mappings, retrieving IPO filings across indices, downloading source documents, and aligning extracted text and images with filing-level metadata. Rather than relying on full-document processing, the toolkit leverages issuer-provided document structure (Giovannini and Marinai, 2025). Filing Table of Contents (TOCs) are parsed to identify section names and page numbers, enabling segmentation into standardized sections while preserving original document organization. Because TOC parsing is a critical dependency for section segmentation, the toolkit includes automated validation and regression tests to ensure consistent behavior across filing formats and software updates. This design supports scalable processing across decades of filings while maintaining structural fidelity to the original documents. Appendix A compares IPO-Toolkit with existing tools for structured SEC document processing.
3.2. IPO Text

Figure 1 illustrates the three-stage workflow used to construct the section-structured IPO text dataset: (1) filing retrieval, (2) TOC parsing, and (3) section extraction with LLM-assisted validation and targeted human review. Rather than treating each IPO filing as a single block of text, the pipeline splits filings into standardized, section-level text that preserves document structure.
The resulting IPO text dataset contains standardized sections aligned to TOC-derived boundaries and normalized to a curated set of canonical section labels (e.g., Summary, Risk Factors, Legal Matters). Section names are normalized using fuzzy string matching against a curated dictionary of canonical labels (Hiray et al., 2024), ensuring consistency across issuers and years despite formatting variation. Each filing includes the original ASCII or HTML source, section-aligned text, associated images, and filing-level metadata such as accession number, filing date, and standard industry classification (SIC).
To ensure reliable section boundaries, we apply deterministic checks during TOC-based extraction to verify that sections are present, complete, and aligned with expected headers. This yields an average section extraction accuracy of 94.86% across years. Because TOC-derived boundaries may produce truncated or misaligned sections, the pipeline incorporates a lightweight section-level validation step (Figure 1, Stage 3). Extracted sections are labeled as Safe to Use, Manual Review, or Do Not Use based on structural cues such as abrupt sentence endings or boundary spillover. The validator operates on surface-level completeness signals rather than semantic interpretation, enabling reliable quality control without full-document inference. This design avoids reliance on model-level financial knowledge that may exhibit temporal knowledge bias (Shah et al., 2025b).
3.3. Verifying Text Section Extraction
We use a dual-validation prompt strategy combining a binary classification prompt (Figure 2) with a 1–5 Likert confidence score (Figure 3). The binary output provides a clear filtering decision, while the Likert score captures graded confidence and helps identify borderline cases. Requiring agreement between both signals yields a conservative validation criterion, consistent with recent work emphasizing careful LLM-as-a-judge evaluation (Lee et al., 2025). Sections are marked as SAFE TO USE when the validator assigns a binary label of “Yes” and a Likert score . Under this criterion, 22,666 documents (98.4%) were automatically approved. The remaining 362 documents (1.6%) were flagged for manual inspection before inclusion in the final dataset. To assess reliability, we manually review a subset of 200 sections labeled SAFE TO USE and find that they are consistently free of truncation and boundary errors. This confirms that the dual-signal validator provides a high-precision filter for structurally valid sections.
3.4. IPO Images

Figure 4 illustrates the three-stage workflow used to construct the IPO image dataset: (1) human image labeling, (2) large-scale YOLO classification, and (3) class verification and feature extraction using multimodal large language models (MLLMs). The pipeline assigns each image a standardized class label and extracts structured visual attributes for charts.
The resulting dataset contains over 76,000 images extracted from IPO filings, including more than 17,000 charts. Each image is linked to its source filing and associated metadata, including accession number, filing date, and SIC. A comparison with existing vision-centric financial and chart benchmarks is provided in Appendix A, where we contrast dataset scale, image composition, and document-level traceability. We define five mutually exclusive image classes: Charts, Infographics, Logos, Maps, and Other. The taxonomy was developed through an iterative pilot study in which approximately 1,000 images were manually labeled to refine category definitions and resolve ambiguous cases. The final label set emphasizes semantic intent (e.g., quantitative charts versus visually rich but non-quantitative infographics) rather than low-level visual cues. Each seed image is labeled by three annotators using a shared guideline, with majority voting used to resolve disagreements. Inter-annotator agreement statistics are reported in Table 2.
To scale labeling across the full corpus, we fine-tune YOLOv8-small (Jocher et al., 2023), a widely adopted real-time vision model known for its balance of speed, accuracy, and computational efficiency (Talaat and ZainEldin, 2023; Xiao et al., 2024; Liu et al., 2025). Using the human annotations, the model is trained to assign one of the five image classes at scale. Because distinctions between certain categories can be subtle, model predictions are subsequently verified using an ensemble of MLLMs. Labels are aggregated via majority voting, and images are retained when a majority of models agree on the assigned class. We analyze the sensitivity of this threshold and its relationship to human agreement in Table 3.
For images classified as charts, we extract structured visual attributes using a constrained MLLM prompt focused on observable visual properties. The feature schema captures four components: (1) basic metadata (e.g., chart type and presence of embedded data tables), (2) labels and legends (e.g., presence of descriptive axis labels and legends), (3) axis configuration (e.g., number of y-axes, whether the y-axis begins at zero, tick spacing consistency), and (4) visual quality indicators (e.g., use of 3D effects). Feature predictions are aggregated across multiple MLLMs via majority voting to reduce sensitivity to single-model errors. Detailed performance metrics and error analysis are reported in Appendix C.
3.5. Human–YOLO Agreement
Table 2 reports inter-annotator agreement on the human-labeled image subset used to fine-tune YOLO for large-scale classification. Each image was independently labeled by three annotators. Reliability was measured using Krippendorff’s (Krippendorff, 2011), which accounts for multiple raters and categories. Overall agreement is high (). To examine disagreement patterns, we compute pairwise for all unordered category pairs, restricting each calculation to images where annotators selected only the two categories under comparison. Disagreement is concentrated in comparisons involving Infographic.
| Category Pair | Krippendorff’s |
|---|---|
| Chart vs. Logo | 1.000 |
| Chart vs. Map | 1.000 |
| Logo vs. Map | 1.000 |
| Chart vs. Other | 0.986 |
| Infographic vs. Logo | 0.980 |
| Chart vs. Infographic | 0.973 |
| Infographic vs. Map | 0.958 |
| Map vs. Other | 0.937 |
| Logo vs. Other | 0.908 |
| Infographic vs. Other | 0.793 |
| All categories (overall) | 0.911 |
3.6. MLLM–Human Agreement and Voting
Table 3 reports how agreement among MLLMs relates to alignment with human annotations in the verification stage of the pipeline. Using outputs from 8 MLLMs, we group images by agreement level and measure alignment with human labels. For evaluation, we annotate all images with less than 100% MLLM agreement and sample from the 100% agreement bucket due to its larger size. Higher agreement among models consistently corresponds to stronger alignment with humans, indicating that inter-model agreement serves as a useful proxy for prediction confidence. Performance is relatively stable across agreement thresholds, suggesting that majority voting is a robust aggregation strategy. We therefore adopt a 50% threshold as a simple and effective default for label aggregation.
| Predicted | Chart Agreement | |||||
| Agree | Total | Info | Logo | Map | Chart | LLM–Human |
| 8/8 | 33,275 | 6,274 | 13,985 | 1,932 | 11,084 | 1,000/1,000 (100.00%) |
| 7/8 | 19,131 | 8,758 | 2,233 | 2,486 | 5,654 | 997/1,000 (99.70%) |
| 6/8 | 3,815 | 2,622 | 854 | 137 | 202 | 186/202 (92.08%) |
| 5/8 | 2,583 | 1,906 | 548 | 41 | 88 | 70/88 (79.55%) |
| 4/8 | 1,218 | 982 | 221 | 13 | 2 | 1/2 (50.00%) |
| Firms | Images / Filing | Tokens / Filing | Tokens / Section | |||||
| Year | Format | Total | With Images | Total | Charts | ASCII/HTML | Filtered | Risk Factors |
| 1994 | E-File Option | 35 | 0 (0%) | 0.0 0.0 | 0.0 0.0 | 182,463 115,884 | 182,463 115,884 | 3,646 1,675 |
| 1995 | \cellcolorgray!1067 | \cellcolorgray!100 (0%) | \cellcolorgray!100.0 0.0 | \cellcolorgray!100.0 0.0 | \cellcolorgray!10142,475 75,123 | \cellcolorgray!10142,475 75,123 | \cellcolorgray!104,300 2,093 | |
| 1996 | ASCII Only | 708 | 0 (0%) | 0.0 0.0 | 0.0 0.0 | 142,338 97,567 | 142,338 97,567 | 5,238 1,915 |
| 1997 | \cellcolorgray!10815 | \cellcolorgray!100 (0%) | \cellcolorgray!100.0 0.0 | \cellcolorgray!100.0 0.0 | \cellcolorgray!10133,424 105,533 | \cellcolorgray!10133,424 105,533 | \cellcolorgray!105,321 1,987 | |
| 1998 | 775 | 0 (0%) | 0.0 0.0 | 0.0 0.0 | 151,146 121,177 | 151,146 121,177 | 5,730 2,015 | |
| 1999 | \cellcolorgray!10707 | \cellcolorgray!100 (0%) | \cellcolorgray!100.0 0.0 | \cellcolorgray!100.0 0.0 | \cellcolorgray!10129,447 100,460 | \cellcolorgray!10128,436 98,534 | \cellcolorgray!105,848 2,062 | |
| 2000 | ASCII or HTML | 679 | 14 (2.1%) | 3.0 2.5 | 0.1 0.5 | 140,889 117,194 | 129,857 109,702 | 6,524 1,952 |
| 2001 | \cellcolorgray!10255 | \cellcolorgray!1014 (5.5%) | \cellcolorgray!102.6 1.3 | \cellcolorgray!100.4 0.9 | \cellcolorgray!10116,446 99,913 | \cellcolorgray!1097,657 60,003 | \cellcolorgray!105,792 2,329 | |
| 2002 | 537 | 103 (19.2%) | 3.2 2.3 | 0.6 1.3 | 255,624 277,639 | 138,387 58,118 | 6,064 2,540 | |
| 2003 | \cellcolorgray!10223 | \cellcolorgray!10103 (46.2%) | \cellcolorgray!105.3 23.0 | \cellcolorgray!100.4 0.9 | \cellcolorgray!10437,434 531,847 | \cellcolorgray!10119,250 79,524 | \cellcolorgray!106,761 2,183 | |
| 2004 | 842 | 671 (79.7%) | 4.5 5.2 | 0.5 2.7 | 758,999 537,389 | 180,613 90,335 | 7,949 2,116 | |
| 2005 | \cellcolorgray!10444 | \cellcolorgray!10276 (62.2%) | \cellcolorgray!104.1 4.6 | \cellcolorgray!100.8 2.1 | \cellcolorgray!10495,387 506,380 | \cellcolorgray!10117,204 81,279 | \cellcolorgray!107,279 2,362 | |
| 2006 | Mostly HTML | 708 | 558 (78.8%) | 3.0 3.1 | 0.5 1.8 | 690,094 520,644 | 175,834 119,800 | 7,384 2,647 |
| 2007 | \cellcolorgray!10600 | \cellcolorgray!10420 (70.0%) | \cellcolorgray!104.5 5.9 | \cellcolorgray!100.7 2.0 | \cellcolorgray!10628,964 527,778 | \cellcolorgray!10138,530 87,482 | \cellcolorgray!108,086 2,187 | |
| 2008 | 868 | 458 (52.8%) | 4.2 5.2 | 0.8 2.4 | 507,818 537,178 | 93,907 77,197 | 6,062 2,892 | |
| 2009 | \cellcolorgray!10719 | \cellcolorgray!10284 (39.5%) | \cellcolorgray!105.6 14.1 | \cellcolorgray!102.4 12.3 | \cellcolorgray!10540,824 583,496 | \cellcolorgray!10112,364 103,323 | \cellcolorgray!106,695 2,750 | |
| 2010 | 852 | 501 (58.8%) | 4.5 5.9 | 0.9 2.9 | 593,251 543,764 | 113,632 86,955 | 6,542 2,643 | |
| 2011 | \cellcolorgray!10963 | \cellcolorgray!10655 (68.0%) | \cellcolorgray!104.0 4.9 | \cellcolorgray!100.7 2.2 | \cellcolorgray!10582,792 471,728 | \cellcolorgray!10115,774 91,627 | \cellcolorgray!106,861 2,507 | |
| 2012 | 772 | 538 (69.7%) | 6.0 4.8 | 0.8 2.3 | 803,347 794,944 | 132,062 110,615 | 6,875 2,727 | |
| 2013 | \cellcolorgray!10678 | \cellcolorgray!10472 (69.6%) | \cellcolorgray!106.4 12.6 | \cellcolorgray!102.0 10.1 | \cellcolorgray!10567,364 521,496 | \cellcolorgray!10111,397 84,409 | \cellcolorgray!107,123 2,662 | |
| 2014 | 886 | 512 (57.8%) | 7.5 13.3 | 2.3 10.3 | 605,421 626,288 | 114,793 91,650 | 7,054 2,574 | |
| 2015 | \cellcolorgray!10601 | \cellcolorgray!10448 (74.5%) | \cellcolorgray!106.6 6.9 | \cellcolorgray!101.7 3.5 | \cellcolorgray!10497,325 481,589 | \cellcolorgray!10103,440 84,391 | \cellcolorgray!107,173 2,678 | |
| 2016 | 389 | 250 (64.3%) | 6.6 8.9 | 1.7 4.1 | 480,232 503,547 | 93,925 83,328 | 6,897 2,721 | |
| 2017 | \cellcolorgray!10438 | \cellcolorgray!10319 (72.8%) | \cellcolorgray!107.9 11.4 | \cellcolorgray!101.8 3.8 | \cellcolorgray!10521,253 586,802 | \cellcolorgray!10106,423 91,388 | \cellcolorgray!107,059 2,926 | |
| 2018 | 479 | 345 (72.0%) | 9.9 12.2 | 3.2 6.0 | 561,279 663,917 | 108,833 85,914 | 7,217 2,661 | |
| 2019 | \cellcolorgray!10442 | \cellcolorgray!10348 (78.7%) | \cellcolorgray!1010.5 12.5 | \cellcolorgray!102.4 5.0 | \cellcolorgray!10691,762 720,346 | \cellcolorgray!10133,956 98,068 | \cellcolorgray!107,217 2,681 | |
| 2020 | 540 | 369 (68.3%) | 11.7 14.2 | 3.1 5.2 | 648,644 670,756 | 130,408 86,279 | 7,145 2,903 | |
| 2021 | \cellcolorgray!101,621 | \cellcolorgray!10949 (58.5%) | \cellcolorgray!1010.7 13.0 | \cellcolorgray!102.5 5.2 | \cellcolorgray!10746,067 679,402 | \cellcolorgray!10148,483 75,960 | \cellcolorgray!108,465 1,717 | |
| 2022 | 609 | 452 (74.2%) | 7.3 8.7 | 1.4 3.2 | 931,405 878,375 | 151,227 98,684 | 7,672 2,576 | |
| 2023 | \cellcolorgray!10485 | \cellcolorgray!10379 (78.1%) | \cellcolorgray!108.9 11.7 | \cellcolorgray!101.8 4.2 | \cellcolorgray!10781,395 934,000 | \cellcolorgray!10125,559 90,769 | \cellcolorgray!107,350 3,020 | |
| 2024 | 653 | 486 (74.4%) | 9.3 12.6 | 2.1 5.7 | 725,949 816,058 | 119,201 84,795 | 7,430 2,900 | |
| 2025 | \cellcolorgray!101,223 | \cellcolorgray!10846 (69.2%) | \cellcolorgray!108.9 11.1 | \cellcolorgray!101.7 3.7 | \cellcolorgray!10738,071 785,027 | \cellcolorgray!10124,794 86,966 | \cellcolorgray!107,891 2,640 | |
| 2026 | 206 | 139 (67.5%) | 10.8 18.7 | 1.9 5.7 | 874,527 835,035 | 137,670 79,803 | 7,651 2,625 | |
3.7. Filing Format Evolution and Dataset Implications
Table 4 summarizes the evolution of IPO filing format, document length, and visual content over time. From 1994 to 1995, electronic submission was optional; between 1996 and 1999, filings were electronic but restricted to plain-text (ASCII), which does not support embedded images. In 2000, the SEC permitted HTML submissions and images (Securities and Commission, 2000), initiating a structural shift in how IPO filings were formatted. By 2006, the majority of IPO filings were submitted in HTML (Securities and Commission, 2025). In financial disclosures, longer filings are associated with lower readability and greater difficulty in assimilating valuation-relevant information (Loughran and McDonald, 2014).
The transition to HTML has two direct implications for dataset construction. First, images emerge and increase steadily following HTML adoption, consistent with the growth in images per filing reported in Table 4. Second, raw token counts increase after HTML adoption due to markup and layout tags, while filtered text remains comparatively stable. Since filing length is often used as a proxy for readability and information-processing costs (Loughran and McDonald, 2014), this raw-versus-filtered distinction matters for comparisons over time. The pattern suggests that much of the apparent growth in document length reflects formatting rather than substantive expansion of narrative disclosure. Consistent with this interpretation, we do not observe a clear increase in filtered IPO filing length around the Sarbanes–Oxley Act of 2002 (Congress, 2002), unlike findings for 10-K filings (Kogan et al., 2009; Tsai and Wang, 2017). Notably, filtered token counts for the Risk Factors section remain relatively stable over time.
4. Experiments
| Industry Classification | Visual Property Subsets | ||||||||||||||||
| Model | AFF | MIN | CON | MAN | TRN | WHO | RET | FIRE | SER | ALL | 3DP | 3DB | 2YA | TRC | COM | GRA | COL |
| \rowcolorgray!10 Panel A: Average Scores | |||||||||||||||||
| Human Baseline | 2.24 | 2.44 | 1.89 | 2.17 | 2.51 | 2.19 | 2.53 | 3.01 | 2.52 | 2.48 | 3.24 | 3.47 | 2.47 | 2.89 | 2.57 | 2.65 | 2.35 |
| MLLM Avg. (No CoT) | 2.49 | 2.68 | 2.60 | 2.68 | 2.62 | 2.38 | \cellcolorgreen!202.63 | 2.70 | \cellcolorgreen!202.62 | 2.61 | 2.48 | 3.13 | 3.00 | \cellcolorgreen!202.85 | 2.92 | \cellcolorgreen!202.62 | 2.61 |
| MLLM Avg. (CoT) | \cellcolorgreen!202.21 | \cellcolorgreen!202.37 | \cellcolorgreen!202.20 | \cellcolorgreen!202.46 | \cellcolorgreen!202.50 | \cellcolorgreen!202.15 | 2.34 | \cellcolorgreen!203.07 | 2.29 | \cellcolorgreen!202.51 | \cellcolorgreen!203.85 | \cellcolorgreen!203.56 | \cellcolorgreen!202.49 | 3.44 | \cellcolorgreen!202.42 | 2.75 | \cellcolorgreen!202.33 |
| \rowcolorgray!10 Panel B: Model-Level Scores | |||||||||||||||||
| MLLMs (No CoT) | |||||||||||||||||
| Claude Opus 4.5 | 2.74 | 2.74 | 2.88 | 2.87 | 2.61 | 2.67 | 3.03 | 2.97 | 2.84 | 2.83 | 2.38 | 3.60 | 3.23 | \cellcolorgreen!203.19 | 3.13 | 2.76 | 2.88 |
| Claude Sonnet 4.5 | 2.92 | 3.09 | 2.76 | 2.97 | 3.19 | 2.85 | 3.03 | \cellcolorgreen!203.03 | 3.16 | 3.00 | 2.65 | 3.79 | 3.50 | 3.35 | 3.32 | 3.14 | 2.90 |
| GPT-5.2 | 2.87 | 3.01 | 2.95 | 3.29 | 3.04 | 2.63 | 3.05 | 3.35 | 2.99 | 3.08 | 3.60 | 3.83 | 3.17 | 3.36 | 3.22 | 3.11 | 3.05 |
| GPT-5-nano | 2.03 | \cellcolorgreen!202.44 | 2.35 | \cellcolorgreen!202.21 | 2.20 | 1.82 | 2.06 | 2.09 | 2.07 | 2.13 | 1.72 | 2.33 | 2.75 | 2.35 | 2.69 | 2.10 | 2.16 |
| Qwen3-VL-32B | 1.90 | 2.10 | 2.09 | 2.05 | 2.05 | 1.95 | 1.96 | 2.05 | 2.03 | 2.03 | 2.06 | 2.12 | 2.34 | 2.03 | 2.27 | 2.00 | 2.05 |
| MLLMs (With CoT) | |||||||||||||||||
| Claude Opus 4.5 | 2.60 | 2.80 | 2.45 | 2.64 | 2.89 | 2.54 | \cellcolorgreen!202.52 | 3.29 | 2.67 | 2.80 | 4.00 | 3.76 | 2.68 | 3.44 | \cellcolorgreen!202.62 | 3.03 | 2.63 |
| Claude Sonnet 4.5 | \cellcolorgreen!202.16 | 2.40 | \cellcolorgreen!201.80 | 2.39 | \cellcolorgreen!202.47 | \cellcolorgreen!202.11 | 2.27 | 3.05 | 2.31 | \cellcolorgreen!202.45 | 4.02 | \cellcolorgreen!203.45 | 1.97 | \cellcolorgreen!203.19 | 2.04 | 2.71 | \cellcolorgreen!202.25 |
| GPT-5.2 | 2.44 | 2.47 | 2.23 | 2.62 | 2.56 | 2.41 | 2.59 | 3.18 | \cellcolorgreen!202.57 | 2.67 | 3.97 | 3.59 | \cellcolorgreen!202.46 | 3.45 | 2.47 | 2.85 | 2.53 |
| GPT-5-nano | 2.11 | 2.22 | 2.33 | 2.45 | 2.37 | 1.97 | 2.17 | 2.78 | 1.97 | 2.36 | \cellcolorgreen!203.36 | 3.21 | 3.19 | 3.35 | 2.88 | \cellcolorgreen!202.63 | 2.17 |
| Qwen3-VL-32B | 1.73 | 1.95 | 2.20 | \cellcolorgreen!202.21 | 2.19 | 1.75 | 2.16 | \cellcolorgreen!203.03 | 1.93 | 2.28 | 3.92 | 3.78 | 2.15 | 3.75 | 2.07 | 2.53 | 2.09 |
4.1. Detection of Misleading Financial Charts
Misleading charts can distort interpretation through truncated axes, disproportionate scaling, dual y-axes, and 3D perspective effects. IPO filings provide a challenging setting because charts appear inside long regulatory documents, vary across industries, and combine standardized reporting with discretionary visual design. Because misleadingness is a subjective judgment task, we use expert human ratings as the reference point for evaluating model alignment (Galarnyk et al., 2025b). We construct a stratified sample of 1,185 charts from IPO filings spanning nine industries. Each chart is labeled by three annotators on a 5-point Likert scale (1 = highly accurate, 5 = highly misleading), and we use the mean human rating as the baseline. We analyze results along two dimensions for human and model judgments: (i) industry aggregates (AFF, MIN, CON, MAN, TRN, WHO, RET, FIRE, SER) and (ii) visual-property subsets, including 3D pie charts (3DP), 3D bar charts (3DB), dual y-axes (2YA), truncated axes (TRC), combo charts (COM), grayscale charts (GRA), and color charts (COL). Models are evaluated under two prompting regimes: (1) Direct prompting (No CoT), where the model assigns a score directly from the image; and (2) Chain-of-thought prompting (CoT), where the model produces intermediate reasoning before outputting a final rating (Wei et al., 2023). In the CoT setting, we use a region-aware prompt that directs attention to potentially misleading regions (axes, scaling, legends, and perspective effects) before producing a misleadingness score (Chen et al., 2025).
4.2. Models
We evaluate the following MLLMs on IPO-Dataset images: Claude Sonnet 4.5, Claude Opus 4.5 (Anthropic, 2025), GPT-5.2, GPT-5 Nano (OpenAI, 2025), and Qwen3-VL-32B (Qwen Team, 2025). Implementation details are in Appendix D.
4.3. Results
Table 4 reports average misleadingness scores on the 5-point scale. Columns under Industry Classification aggregate scores within each industry. Columns under Visual Property Subsets restrict evaluation to charts exhibiting a specific visual property (e.g., 3D pie charts, truncated y-axes, dual y-axes), pooled across industries.
Alignment under No CoT
Under No CoT, the average MLLM score in the ALL industry column is close to the human baseline (2.61 vs. 2.48), but individual models differ substantially. GPT-5.2 and Claude Sonnet 4.5 assign higher misleadingness scores (3.08 and 3.00), while GPT-5-nano and Qwen3-VL-32B assign lower scores (2.13 and 2.03). This spread shows that alignment with expert judgments varies considerably across models.
Effect of CoT prompting
CoT improves alignment in the ALL industry column, shifting the MLLM average from 2.61 to 2.51, closer to the human baseline of 2.48. This is consistent with misleading-chart benchmarks showing that reasoning guidance can improve alignment with human judgments (Chen et al., 2025).
Industry-level variation
Industry differences are modest for most sectors. FIRE receives the highest human misleadingness score (3.01), and the CoT average remains similar (3.07). No CoT scores vary less across industries, assigning similar scores even to lower-scoring sectors such as CON and MAN. This suggests that CoT improves industry-level calibration.
Visual property subsets
Visual-property subsets separate chart-design effects from industry composition. Humans assign the highest scores to 3D bar charts (3.47), 3D pie charts (3.24), and truncated-axis charts (2.89), while model scores also rise for several of these subsets.
5. Text and Image Analysis
5.1. Lexical and Semantic Diversity
We extract section text from IPO filings and apply LLM-based validation to remove truncated segments. The final corpus contains 29,032 validated sections, including Risk Factors (10,286), Prospectus Summary (7,346), and Legal Matters (5,396).
Lexical Diversity
Figure 6 reports lexical diversity over time using Type–Token Ratio (TTR) (Masry et al., 2025). Because section lengths are comparable over time, TTR provides a consistent measure of lexical variation across years and sections. TTR is stable or gradually declining in all three sections, with the most pronounced reduction in Legal Matters. This pattern is consistent with increasing linguistic standardization in IPO filings, particularly in legally sensitive sections where templated language is common (Campbell et al., 2014; Cohen et al., 2020).

Semantic Diversity
Figure 7 reports semantic diversity over time using sentence embeddings. For each section, we encode all sentences with a Sentence-BERT model (Reimers and Gurevych, 2019) and calculate the average pairwise cosine distance between embeddings. Higher average distance indicates greater conceptual spread within the section. Unlike TTR, semantic diversity increases over time, most notably in Legal Matters. This divergence suggests that while firms rely on increasingly standardized phrasing, they address a broader range of topics and contingencies. In other words, filings become more linguistically uniform yet conceptually more expansive, consistent with prior evidence on the evolution of corporate reporting (Dyer et al., 2017; Brown and Tucker, 2011).

5.2. Rising Visual Heterogeneity in IPO Filings
| Image Class Distribution | ||||||
|---|---|---|---|---|---|---|
| Industry | Abbreviation | Chart | Infographic | Logo | Map | Other |
| Agriculture, Forestry & Fishing | AFF | \cellcolorImgBinC14.8% (43) | \cellcolorImgBinD26.4% (77) | \cellcolorImgBinD20.3% (59) | \cellcolorImgBinA4.1% (12) | \cellcolorImgBinE35.6% (103) |
| Construction | CON | \cellcolorImgBinF61.6% (908) | \cellcolorImgBinC10.5% (154) | \cellcolorImgBinB9.0% (132) | \cellcolorImgBinA2.6% (38) | \cellcolorImgBinC16.2% (238) |
| Finance, Insurance & Real Estate | FIRE | \cellcolorImgBinE39.1% (8,229) | \cellcolorImgBinC19.8% (4,169) | \cellcolorImgBinC19.2% (4,050) | \cellcolorImgBinA4.2% (889) | \cellcolorImgBinC17.5% (3,682) |
| Manufacturing | MAN | \cellcolorImgBinD24.5% (6,925) | \cellcolorImgBinC19.7% (5,571) | \cellcolorImgBinC16.6% (4,677) | \cellcolorImgBinA1.1% (319) | \cellcolorImgBinE38.1% (10,757) |
| Mining | MIN | \cellcolorImgBinC17.6% (856) | \cellcolorImgBinD27.5% (1,336) | \cellcolorImgBinC16.6% (808) | \cellcolorImgBinE30.6% (1,487) | \cellcolorImgBinB7.8% (380) |
| Retail Trade | RET | \cellcolorImgBinC17.8% (486) | \cellcolorImgBinD28.2% (770) | \cellcolorImgBinC19.9% (543) | \cellcolorImgBinA2.2% (60) | \cellcolorImgBinE32.0% (873) |
| Services | SER | \cellcolorImgBinC14.6% (2,384) | \cellcolorImgBinD25.1% (4,079) | \cellcolorImgBinC19.2% (3,119) | \cellcolorImgBinA1.6% (255) | \cellcolorImgBinE39.3% (6,398) |
| Transportation & Utilities | TRN | \cellcolorImgBinE30.6% (1,814) | \cellcolorImgBinC16.5% (979) | \cellcolorImgBinC19.1% (1,132) | \cellcolorImgBinA1.8% (107) | \cellcolorImgBinE32.0% (1,896) |
| Wholesale Trade | WHO | \cellcolorImgBinC19.1% (265) | \cellcolorImgBinC18.3% (254) | \cellcolorImgBinD25.8% (357) | \cellcolorImgBinB5.2% (72) | \cellcolorImgBinE31.6% (438) |
| Other/Unknown | OU | \cellcolorImgBinC12.4% (776) | \cellcolorImgBinD23.8% (1,489) | \cellcolorImgBinE38.6% (2,421) | \cellcolorImgBinA3.0% (185) | \cellcolorImgBinD22.6% (1,373) |
| Total | \cellcolorImgBinD22.4% (17,030) | \cellcolorImgBinD20.6% (15,657) | \cellcolorImgBinC19.5% (14,876) | \cellcolorImgBinA4.0% (3,014) | \cellcolorImgBinE33.5% (25,527) | |
The dataset contains over 76,000 images across five classes: charts, infographics, logos, maps, and other. Figure 8 reports image-type diversity using a 3-year rolling average. In contrast to IPO text, IPO images have become more heterogeneous over time. To quantify visual diversity, we follow Masry et al. (2025), which encodes images into feature vectors using a CLIP vision encoder (Radford et al., 2021) and computes average pairwise cosine distances. By this measure, both Charts and Infographics become steadily more diverse over time.
This matters for model evaluation because visual diversity increases the difficulty of chart and figure understanding. Early chart benchmarks such as ChartQA (Masry et al., 2022) relied on relatively constrained chart distributions, leading to performance saturation among MLLMs. ChartQA-Pro showed that model accuracy declines on more structurally diverse and visually complex charts (Masry et al., 2025). The upward trajectory in IPO visual diversity suggests that financial filings increasingly resemble this more challenging regime rather than the simplified distributions in most benchmarks. These results highlight a growing modality gap: language becomes more templated over time, while visuals become more structurally diverse. Multimodal systems must therefore generalize across increasingly heterogeneous visual inputs embedded within standardized text.
5.3. Industry-Level Variation in IPO Images
Table 6 characterizes industry variation in IPO filing images, with the corresponding chart-class breakdown provided in Appendix B. Charts constitute 22.4% of images, with prevalence varying by sector. Construction (CON) filings are the most chart-intensive (61.6%), followed by Finance, Insurance & Real Estate (FIRE) at 39.1% and Transportation & Utilities (TRN) at 30.6%. Other sectors rely more heavily on non-chart visuals, including Agriculture (AFF), Services (SER), and Other/Unknown (OU). Across the dataset, the largest single category is Other (33.5%), encompassing photos, table renderings, text blocks, signatures, and product screenshots.
Certain visual types exhibit strong sectoral concentration. Maps are rare overall (4.0%) but highly concentrated in Mining (MIN), where they account for 30.6% of images, consistent with geographically grounded resource disclosures. Logos are especially prominent in Other/Unknown (OU) and Wholesale (WHO), reflecting branding-oriented filings. Manufacturing (MAN) and Services (SER) have the highest shares of Other images, indicating greater use of photos, screenshots, text-heavy images, and other non-chart visuals.
Within charts, bar charts dominate (47.5%), reflecting frequent categorical comparisons such as segment revenues or market composition. Line charts account for 22.9% and are especially common in MAN and FIRE, where longitudinal trends are emphasized. Combination charts appear most often in CON and MIN, integrating levels and trends within a single visualization. Pie charts comprise just 10.1%, indicating limited reliance on proportional encodings despite their common use in investor-facing materials.
6. Conclusion

We present an open-source toolkit and dataset for section-structured, multimodal analysis of IPO filings. By combining issuer-provided document structure with automated processing and human validation, our work enables large-scale, reproducible extraction of textual sections and visual content from IPO filings spanning 1994–2026. Using the toolkit, we construct a dataset of over 109,000 filings containing more than 76,000 classified images. Our analysis reveals divergent trends in textual and visual disclosures: while text shows increasing standardization, visual content exhibits greater variation. These differences motivate benchmarks that evaluate visual design choices in realistic regulatory documents.
References
- (1)
- sec ([n. d.]) [n. d.]. SEC API. https://sec-api.io/. Accessed: 2025-02-19.
- Akhtar et al. (2024) Mubashara Akhtar, Nikesh Subedi, Vivek Gupta, Sahar Tahmasebi, Oana Cocarascu, and Elena Simperl. 2024. ChartCheck: Explainable Fact-Checking over Real-World Chart Images. In Findings of the Association for Computational Linguistics: ACL 2024, Lun-Wei Ku, Andre Martins, and Vivek Srikumar (Eds.). Association for Computational Linguistics, Bangkok, Thailand, 13921–13937. doi:10.18653/v1/2024.findings-acl.828
- Ang and Lim (2022) Gary Ang and Ee-Peng Lim. 2022. Guided Attention Multimodal Multitask Financial Forecasting with Inter-Company Relationships and Global and Local News. In Proceedings of the 60th Annual Meeting of the Association for Computational Linguistics (Volume 1: Long Papers), Smaranda Muresan, Preslav Nakov, and Aline Villavicencio (Eds.). Association for Computational Linguistics, Dublin, Ireland, 6313–6326. doi:10.18653/v1/2022.acl-long.437
- Anthropic (2025) Anthropic. 2025. Introducing Claude 4. https://www.anthropic.com/news/claude-4. Accessed: 2025-12-18.
- Araci (2019) Dogu Araci. 2019. FinBERT: Financial Sentiment Analysis with Pre-trained Language Models. arXiv:1908.10063 [cs.CL] https://arxiv.org/abs/1908.10063
- Bloomberg News (2025) Bloomberg News. 2025. Retail Traders Reshape the Market for IPO Debuts. Bloomberg.com (8 September 2025). https://www.bloomberg.com/news/articles/2025-09-08/retail-traders-reshape-the-market-for-ipo-debuts Accessed: 2026-02-19.
- Brown and Tucker (2011) Stephen V. Brown and Jennifer Wu Tucker. 2011. Large-sample evidence on firms’ year-over-year MD&A modifications. Journal of Accounting Research 49, 2 (2011), 309–346.
- Campbell et al. (2014) John L. Campbell, Hsinchun Chen, Dan S. Dhaliwal, Hai Lu, and Logan B. Steele. 2014. The Information Content of Mandatory Risk Factor Disclosures in Corporate Filings. Review of Accounting Studies 19, 1 (2014), 396–455. doi:10.1007/s11142-013-9258-3
- Chang et al. (2022) Shuaichen Chang, David Palzer, Jialin Li, Eric Fosler-Lussier, and Ningchuan Xiao. 2022. MapQA: A Dataset for Question Answering on Choropleth Maps. arXiv:2211.08545 [cs.CV] https://arxiv.org/abs/2211.08545
- Chen et al. (2024) Yukang Chen, Shengju Qian, Haotian Tang, Xin Lai, Zhijian Liu, Song Han, and Jiaya Jia. 2024. LongLoRA: Efficient Fine-tuning of Long-Context Large Language Models. arXiv:2309.12307 [cs.CL] https://arxiv.org/abs/2309.12307
- Chen et al. (2025) Zixin Chen, Sicheng Song, KaShun Shum, Yanna Lin, Rui Sheng, Weiqi Wang, and Huamin Qu. 2025. Unmasking Deceptive Visuals: Benchmarking Multimodal Large Language Models on Misleading Chart Question Answering. In Proceedings of the 2025 Conference on Empirical Methods in Natural Language Processing, Christos Christodoulopoulos, Tanmoy Chakraborty, Carolyn Rose, and Violet Peng (Eds.). Association for Computational Linguistics, Suzhou, China, 13767–13800. doi:10.18653/v1/2025.emnlp-main.695
- Cohen et al. (2020) Lauren Cohen, Umit G. Gurun, and Christopher J. Malloy. 2020. Resident Networks and Firm Disclosure. Journal of Finance 75, 2 (2020), 743–785. doi:10.1111/jofi.12878
- Congress (2002) U.S. Congress. 2002. Sarbanes–Oxley Act of 2002. https://www.govinfo.gov/content/pkg/PLAW-107publ204/pdf/PLAW-107publ204.pdf. Public Law 107-204. Accessed: 2025-12-12.
- Dong et al. (2024) Zihan Dong, Xinyu Fan, and Zhiyuan Peng. 2024. FNSPID: A Comprehensive Financial News Dataset in Time Series. In Proceedings of the 30th ACM SIGKDD Conference on Knowledge Discovery and Data Mining (Barcelona, Spain) (KDD ’24). Association for Computing Machinery, New York, NY, USA, 4918–4927. doi:10.1145/3637528.3671629
- Du et al. (2025) Yufeng Du, Minyang Tian, Srikanth Ronanki, Subendhu Rongali, Sravan Babu Bodapati, Aram Galstyan, Azton Wells, Roy Schwartz, Eliu A Huerta, and Hao Peng. 2025. Context Length Alone Hurts LLM Performance Despite Perfect Retrieval. In Findings of the Association for Computational Linguistics: EMNLP 2025, Christos Christodoulopoulos, Tanmoy Chakraborty, Carolyn Rose, and Violet Peng (Eds.). Association for Computational Linguistics, Suzhou, China, 23281–23298. doi:10.18653/v1/2025.findings-emnlp.1264
- Dyer et al. (2017) Travis Dyer, Mark Lang, and Lorien Stice-Lawrence. 2017. The evolution of 10-K textual disclosure: Evidence from Latent Dirichlet Allocation. Journal of Accounting and Economics 64, 2–3 (2017), 221–245.
- Galarnyk et al. (2025a) Michael Galarnyk, Veer Kejriwal, Agam Shah, Yash Bhardwaj, Nicholas Watney Meyer, Anand Krishnan, and Sudheer Chava. 2025a. VideoConviction: A Multimodal Benchmark for Human Conviction and Stock Market Recommendations. In Proceedings of the 31st ACM SIGKDD Conference on Knowledge Discovery and Data Mining V.2 (Toronto ON, Canada) (KDD ’25). Association for Computing Machinery, New York, NY, USA, 5447–5458. doi:10.1145/3711896.3737417
- Galarnyk et al. (2025b) Michael Galarnyk, Agam Shah, Dipanwita Guhathakurta, Poojitha Nandigam, and Sudheer Chava. 2025b. How Inclusively do LMs Perceive Social and Moral Norms?. In Findings of the Association for Computational Linguistics: NAACL 2025, Luis Chiruzzo, Alan Ritter, and Lu Wang (Eds.). Association for Computational Linguistics, Albuquerque, New Mexico, 4874–4884. doi:10.18653/v1/2025.findings-naacl.273
- Gan et al. (2025) Ziliang Gan, Dong Zhang, Haohan Li, Yang Wu, Xueyuan Lin, Ji Liu, Haipang Wu, Chaoyou Fu, Zenglin Xu, Rongjunchen Zhang, and Yong Dai. 2025. MME-Finance: A Multimodal Finance Benchmark for Expert-level Understanding and Reasoning. In Proceedings of the 33rd ACM International Conference on Multimedia (Dublin, Ireland) (MM ’25). Association for Computing Machinery, New York, NY, USA, 12867–12874. doi:10.1145/3746027.3758230
- Giovannini and Marinai (2025) Simone Giovannini and Simone Marinai. 2025. A Survey on Reading Order, Table of Contents, and Structure Extraction in Document Analysis. In Proceedings of the IEEE/CVF International Conference on Computer Vision (ICCV) Workshops. 7585–7594.
- Gu et al. (2025) Ming Gu, David Hirshleifer, Siew Hong Teoh, and Shijia Wu. 2025. GIFfluence: A Visual Approach to Investor Sentiment and the Stock Market. arXiv:2512.20027 [q-fin.PR] https://arxiv.org/abs/2512.20027
- He et al. (2025) Ziyuan He, Yuxuan Wang, Jiaqi Li, Kexin Liang, and Muhan Zhang. 2025. LooGLE v2: Are LLMs Ready for Real World Long Dependency Challenges? arXiv:2510.22548 [cs.CL] https://arxiv.org/abs/2510.22548
- Hiray et al. (2024) Arnav Hiray, Yunsong Liu, Mingxiao Song, Agam Shah, and Sudheer Chava. 2024. CoCoHD: Congress Committee Hearing Dataset. In Findings of the Association for Computational Linguistics: EMNLP 2024, Yaser Al-Onaizan, Mohit Bansal, and Yun-Nung Chen (Eds.). Association for Computational Linguistics, Miami, Florida, USA, 15529–15542. doi:10.18653/v1/2024.findings-emnlp.911
- Jindal and Deshpande (2025) Madhur Jindal and Saurabh Deshpande. 2025. REVEAL: multi-turn evaluation of image-input harms for vision LLMs. In Proceedings of the Thirty-Fourth International Joint Conference on Artificial Intelligence (Montreal, Canada) (IJCAI ’25). Article 1081, 9 pages. doi:10.24963/ijcai.2025/1081
- Jocher et al. (2023) Glenn Jocher, Ayush Chaurasia, and Jing Qiu. 2023. Ultralytics YOLOv8. https://github.com/ultralytics/ultralytics
- Kogan et al. (2009) Shimon Kogan, Dimitry Levin, Bryan R. Routledge, Jacob S. Sagi, and Noah A. Smith. 2009. Predicting risk from financial reports with regression. In Proceedings of Human Language Technologies: The 2009 Annual Conference of the North American Chapter of the Association for Computational Linguistics (Boulder, Colorado) (NAACL ’09). Association for Computational Linguistics, USA, 272–280.
- Krippendorff (2011) Klaus Krippendorff. 2011. Computing Krippendorff’s Alpha-Reliability. https://api.semanticscholar.org/CorpusID:59901023
- Lee et al. (2025) Yukyung Lee, JoongHoon Kim, Jaehee Kim, Hyowon Cho, Jaewook Kang, Pilsung Kang, and Najoung Kim. 2025. CheckEval: A reliable LLM-as-a-Judge framework for evaluating text generation using checklists. In Proceedings of the 2025 Conference on Empirical Methods in Natural Language Processing, Christos Christodoulopoulos, Tanmoy Chakraborty, Carolyn Rose, and Violet Peng (Eds.). Association for Computational Linguistics, Suzhou, China, 15771–15798. doi:10.18653/v1/2025.emnlp-main.796
- Liu et al. (2025) Fukun Liu, Adam T. Greer, Gengchen Mai, and Jin Sun. 2025. ZooplanktonBench: A Geo-Aware Zooplankton Recognition and Classification Dataset from Marine Observations. In Proceedings of the 31st ACM SIGKDD Conference on Knowledge Discovery and Data Mining V.2 (Toronto ON, Canada) (KDD ’25). Association for Computing Machinery, New York, NY, USA, 5631–5639. doi:10.1145/3711896.3737395
- Lo and Qu (2025) Leo Yu-Ho Lo and Huamin Qu. 2025. How Good (Or Bad) Are LLMs at Detecting Misleading Visualizations? IEEE Transactions on Visualization and Computer Graphics 31, 1 (Jan. 2025), 1116–1125. doi:10.1109/TVCG.2024.3456333
- Lonare et al. (2021) Gunratan Lonare, Bharat Patil, and Nilesh Raut. 2021. edgar: An R Package for the U.S. SEC EDGAR Retrieval and Parsing of Corporate Filings. SoftwareX 16 (2021), 100865. doi:10.1016/j.softx.2021.100865
- Loughran and McDonald (2011) Tim Loughran and Bill McDonald. 2011. When is a liability not a liability? Textual analysis, dictionaries, and 10-Ks. The Journal of finance 66, 1 (2011), 35–65.
- Loughran and McDonald (2014) Tim Loughran and Bill McDonald. 2014. Measuring readability in financial disclosures. the Journal of Finance 69, 4 (2014), 1643–1671.
- Loukas et al. (2025) Lefteris Loukas, Fabian Billert, Manos Fergadiotis, Prodromos Malakasiotis, and Ion Androutsopoulos. 2025. EDGAR-CRAWLER: From Raw Web Documents to Structured Financial NLP Datasets. In Companion Proceedings of the ACM on Web Conference 2025 (Sydney NSW, Australia) (WWW ’25). Association for Computing Machinery, New York, NY, USA, 761–764. doi:10.1145/3701716.3715289
- Loukas et al. (2021) Lefteris Loukas, Manos Fergadiotis, Ion Androutsopoulos, and Prodromos Malakasiotis. 2021. EDGAR-CORPUS: Billions of Tokens Make The World Go Round. In Proceedings of the Third Workshop on Economics and Natural Language Processing, Udo Hahn, Veronique Hoste, and Amanda Stent (Eds.). Association for Computational Linguistics, Punta Cana, Dominican Republic, 13–18. doi:10.18653/v1/2021.econlp-1.2
- Luo et al. (2025) Junyu Luo, Zhizhuo Kou, Liming Yang, Xiao Luo, Jinsheng Huang, Zhiping Xiao, Jingshu Peng, Chengzhong Liu, Jiaming Ji, Xuanzhe Liu, Sirui Han, Ming Zhang, and Yike Guo. 2025. FinMME: Benchmark Dataset for Financial Multi-Modal Reasoning Evaluation. In Proceedings of the 63rd Annual Meeting of the Association for Computational Linguistics (Volume 1: Long Papers), Wanxiang Che, Joyce Nabende, Ekaterina Shutova, and Mohammad Taher Pilehvar (Eds.). Association for Computational Linguistics, Vienna, Austria, 29465–29489. doi:10.18653/v1/2025.acl-long.1426
- Maia et al. (2018) Macedo Maia, Siegfried Handschuh, André Freitas, Brian Davis, Ross McDermott, Manel Zarrouk, and Alexandra Balahur. 2018. WWW’18 Open Challenge: Financial Opinion Mining and Question Answering. In Companion Proceedings of the The Web Conference 2018 (Lyon, France) (WWW ’18). International World Wide Web Conferences Steering Committee, Republic and Canton of Geneva, CHE, 1941–1942. doi:10.1145/3184558.3192301
- Masry et al. (2025) Ahmed Masry, Mohammed Saidul Islam, Mahir Ahmed, Aayush Bajaj, Firoz Kabir, Aaryaman Kartha, Md Tahmid Rahman Laskar, Mizanur Rahman, Shadikur Rahman, Mehrad Shahmohammadi, Megh Thakkar, Md Rizwan Parvez, Enamul Hoque, and Shafiq Joty. 2025. ChartQAPro: A More Diverse and Challenging Benchmark for Chart Question Answering. In Findings of the Association for Computational Linguistics: ACL 2025, Wanxiang Che, Joyce Nabende, Ekaterina Shutova, and Mohammad Taher Pilehvar (Eds.). Association for Computational Linguistics, Vienna, Austria, 19123–19151. doi:10.18653/v1/2025.findings-acl.978
- Masry et al. (2022) Ahmed Masry, Do Xuan Long, Jia Qing Tan, Shafiq Joty, and Enamul Hoque. 2022. ChartQA: A Benchmark for Question Answering about Charts with Visual and Logical Reasoning. In Findings of the Association for Computational Linguistics: ACL 2022, Smaranda Muresan, Preslav Nakov, and Aline Villavicencio (Eds.). Association for Computational Linguistics, Dublin, Ireland, 2263–2279. doi:10.18653/v1/2022.findings-acl.177
- Mathew et al. (2022) Minesh Mathew, Viraj Bagal, Rubèn Tito, Dimosthenis Karatzas, Ernest Valveny, and C. V. Jawahar. 2022. InfographicVQA. In 2022 IEEE/CVF Winter Conference on Applications of Computer Vision (WACV). 2582–2591. doi:10.1109/WACV51458.2022.00264
- Meta AI (2024) Meta AI. 2024. Llama 4: Advancing Multimodal Intelligence. https://ai.meta.com/blog/llama-4-multimodal-intelligence/. Accessed: 2025-12-11.
- OpenAI (2025) OpenAI. 2025. Introducing GPT-5. https://openai.com/index/introducing-gpt-5/. Accessed: 2025-12-11.
- Pardawala et al. (2025) Huzaifa Pardawala, Siddhant Sukhani, Agam Shah, Veer Kejriwal, Abhishek Pillai, Rohan Bhasin, Andrew DiBiasio, Tarun Mandapati, Dhruv Adha, and Sudheer Chava. 2025. SubjECTive-QA: Measuring Subjectivity in Earnings Call Transcripts’ QA Through Six-Dimensional Feature Analysis. arXiv:2410.20651 [cs.CL] https://arxiv.org/abs/2410.20651
- Pramanick et al. (2025) Shraman Pramanick, Rama Chellappa, and Subhashini Venugopalan. 2025. SPIQA: A Dataset for Multimodal Question Answering on Scientific Papers. arXiv:2407.09413 [cs.CL] https://arxiv.org/abs/2407.09413
- Qin et al. (2025) Chuan Qin, Xin Chen, Chengrui Wang, Pengmin Wu, Xi Chen, Yihang Cheng, Jingyi Zhao, Meng Xiao, Xiangchao Dong, Qingqing Long, Boya Pan, Han Wu, Chengzan Li, Yuanchun Zhou, Hui Xiong, and Hengshu Zhu. 2025. SciHorizon: Benchmarking AI-for-Science Readiness from Scientific Data to Large Language Models. In Proceedings of the 31st ACM SIGKDD Conference on Knowledge Discovery and Data Mining V.2 (Toronto ON, Canada) (KDD ’25). Association for Computing Machinery, New York, NY, USA, 5754–5765. doi:10.1145/3711896.3737403
- Qwen Team (2025) Qwen Team. 2025. Qwen3 Technical Report. arXiv:2505.09388 [cs.CL] https://arxiv.org/abs/2505.09388
- Radford et al. (2021) Alec Radford, Jong Wook Kim, Chris Hallacy, Aditya Ramesh, Gabriel Goh, Sandhini Agarwal, Girish Sastry, Amanda Askell, Pamela Mishkin, Jack Clark, Gretchen Krueger, and Ilya Sutskever. 2021. Learning Transferable Visual Models From Natural Language Supervision. arXiv:2103.00020 [cs.CV] https://arxiv.org/abs/2103.00020
- Reimers and Gurevych (2019) Nils Reimers and Iryna Gurevych. 2019. Sentence-BERT: Sentence Embeddings using Siamese BERT-Networks. In Proceedings of the 2019 Conference on Empirical Methods in Natural Language Processing and the 9th International Joint Conference on Natural Language Processing (EMNLP-IJCNLP), Kentaro Inui, Jing Jiang, Vincent Ng, and Xiaojun Wan (Eds.). Association for Computational Linguistics, Hong Kong, China, 3982–3992. doi:10.18653/v1/D19-1410
- Sawhney et al. (2020) Ramit Sawhney, Piyush Khanna, Arshiya Aggarwal, Taru Jain, Puneet Mathur, and Rajiv Ratn Shah. 2020. VolTAGE: Volatility Forecasting via Text Audio Fusion with Graph Convolution Networks for Earnings Calls. In Proceedings of the 2020 Conference on Empirical Methods in Natural Language Processing (EMNLP), Bonnie Webber, Trevor Cohn, Yulan He, and Yang Liu (Eds.). Association for Computational Linguistics, Online, 8001–8013. doi:10.18653/v1/2020.emnlp-main.643
- Securities and Commission (2000) U.S. Securities and Exchange Commission. 2000. Adoption of Updated EDGAR Filing Requirements. https://www.sec.gov/rules/final/33-7684.txt. SEC Release No. 33-7684. Accessed: 2025-12-12.
- Securities and Commission (2025) U.S. Securities and Exchange Commission. 2025. EDGAR Filer Manual. https://www.sec.gov/edgar/filer-information. Accessed: 2025-12-12.
- Shah et al. (2025a) Agam Shah, Siddhant Sukhani, Huzaifa Pardawala, Saketh Budideti, Riya Bhadani, Rudra Gopal, Siddhartha Somani, Rutwik Routu, Michael Galarnyk, Soungmin Lee, Arnav Hiray, Akshar Ravichandran, Eric Kim, Pranav Aluru, Joshua Zhang, Sebastian Jaskowski, Veer Guda, Meghaj Tarte, Liqin Ye, Spencer Gosden, Rachel Yuh, Sloka Chava, Sahasra Chava, Dylan Patrick Kelly, Aiden Chiang, Harsit Mittal, and Sudheer Chava. 2025a. Words That Unite The World: A Unified Framework for Deciphering Central Bank Communications Globally. arXiv:2505.17048 [cs.CL] https://arxiv.org/abs/2505.17048
- Shah et al. (2025b) Agam Shah, Liqin Ye, Sebastian Jaskowski, Wei Xu, and Sudheer Chava. 2025b. Beyond the Reported Cutoff: Where Large Language Models Fall Short on Financial Knowledge. arXiv:2504.00042 [cs.CL] https://arxiv.org/abs/2504.00042
- Shah et al. (2022) Raj Sanjay Shah, Kunal Chawla, Dheeraj Eidnani, Agam Shah, Wendi Du, Sudheer Chava, Natraj Raman, Charese Smiley, Jiaao Chen, and Diyi Yang. 2022. WHEN FLUE MEETS FLANG: Benchmarks and Large Pre-trained Language Model for Financial Domain. arXiv:2211.00083 [cs.CL] https://arxiv.org/abs/2211.00083
- Shu et al. (2025) Dong Shu, Haoyang Yuan, Yuchen Wang, Yanguang Liu, Huopu Zhang, Haiyan Zhao, and Mengnan Du. 2025. FinChart-Bench: Benchmarking Financial Chart Comprehension in Vision-Language Models. arXiv:2507.14823 [cs.CV] https://arxiv.org/abs/2507.14823
- Snow (2019) Alex Snow. 2019. sec-edgar-downloader: A Python package for downloading SEC filings. https://github.com/jadchaar/sec-edgar-downloader.
- Sukhani et al. (2025) Siddhant Sukhani, Yash Bhardwaj, Riya Bhadani, Veer Kejriwal, Michael Galarnyk, and Sudheer Chava. 2025. FinCap: Topic-Aligned Captions for Short-Form Financial YouTube Videos. arXiv:2509.25745 [cs.CV] https://arxiv.org/abs/2509.25745
- Talaat and ZainEldin (2023) Fatma M Talaat and Hanaa ZainEldin. 2023. An improved fire detection approach based on YOLO-v8 for smart cities. Neural Computing and Applications 35, 28 (2023), 20939–20954.
- Thibault et al. (2025) Camille Thibault, Jacob-Junqi Tian, Gabrielle Péloquin-Skulski, Taylor Lynn Curtis, James Zhou, Florence Laflamme, Luke Yuxiang Guan, Reihaneh Rabbany, Jean-François Godbout, and Kellin Pelrine. 2025. A Guide to Misinformation Detection Data and Evaluation. In Proceedings of the 31st ACM SIGKDD Conference on Knowledge Discovery and Data Mining V.2 (Toronto ON, Canada) (KDD ’25). Association for Computing Machinery, New York, NY, USA, 5801–5809. doi:10.1145/3711896.3737437
- Tsai and Wang (2017) Ming-Feng Tsai and Chuan-Ju Wang. 2017. On the risk prediction and analysis of soft information in finance reports. European Journal of Operational Research 257, 1 (2017), 243–250. doi:10.1016/j.ejor.2016.06.069
- U.S. Congress (2011) U.S. Congress. 2011. 17 U.S.C. §105: Subject matter of copyright: United States Government works. https://www.govinfo.gov/content/pkg/USCODE-2011-title17/pdf/USCODE-2011-title17.pdf. U.S. Government works are not eligible for copyright protection.
- Wang et al. (2025) Yu-Hsiang Wang, Wei-Ning Chiu, Yi-Tai Hsiao, Yu-Shiang Huang, Yi-Shyuan Chiang, Shuo-En Wu, and Chuan-Ju Wang. 2025. SURF: A System to Unveil Explainable Risk Relations between Firms. In Proceedings of the 2025 Conference of the Nations of the Americas Chapter of the Association for Computational Linguistics: Human Language Technologies (System Demonstrations), Nouha Dziri, Sean (Xiang) Ren, and Shizhe Diao (Eds.). Association for Computational Linguistics, Albuquerque, New Mexico, 260–267. doi:10.18653/v1/2025.naacl-demo.22
- Wang et al. (2024) Zirui Wang, Mengzhou Xia, Luxi He, Howard Chen, Yitao Liu, Richard Zhu, Kaiqu Liang, Xindi Wu, Haotian Liu, Sadhika Malladi, Alexis Chevalier, Sanjeev Arora, and Danqi Chen. 2024. CharXiv: Charting Gaps in Realistic Chart Understanding in Multimodal LLMs. arXiv:2406.18521 [cs.CL] https://arxiv.org/abs/2406.18521
- Wei et al. (2023) Jason Wei, Xuezhi Wang, Dale Schuurmans, Maarten Bosma, Brian Ichter, Fei Xia, Ed Chi, Quoc Le, and Denny Zhou. 2023. Chain-of-Thought Prompting Elicits Reasoning in Large Language Models. arXiv:2201.11903 [cs.CL] https://arxiv.org/abs/2201.11903
- Wu et al. (2023) Shijie Wu, Ozan Irsoy, Steven Lu, Vadim Dabravolski, Mark Dredze, Sebastian Gehrmann, Prabhanjan Kambadur, David Rosenberg, and Gideon Mann. 2023. Bloomberggpt: A large language model for finance. arXiv preprint arXiv:2303.17564 (2023).
- Xiao et al. (2024) Bingjie Xiao, Minh Nguyen, and Wei Qi Yan. 2024. Fruit ripeness identification using YOLOv8 model. Multimedia Tools and Applications 83, 9 (2024), 28039–28056.
- Yang et al. (2023) Hongyang Yang, Xiao-Yang Liu, and Christina Dan Wang. 2023. Fingpt: Open-source financial large language models. arXiv preprint arXiv:2306.06031 (2023).
- Zhang et al. (2024) Xinrong Zhang, Yingfa Chen, Shengding Hu, Zihang Xu, Junhao Chen, Moo Hao, Xu Han, Zhen Thai, Shuo Wang, Zhiyuan Liu, and Maosong Sun. 2024. Bench: Extending Long Context Evaluation Beyond 100K Tokens. In Proceedings of the 62nd Annual Meeting of the Association for Computational Linguistics (Volume 1: Long Papers), Lun-Wei Ku, Andre Martins, and Vivek Srikumar (Eds.). Association for Computational Linguistics, Bangkok, Thailand, 15262–15277. doi:10.18653/v1/2024.acl-long.814
Appendix A Additional Background
We compare our work along two dimensions: SEC document processing infrastructure (Table 7) and vision-centric image benchmarks (Table 8). Existing tools primarily support text downloading and parsing for 10-K, 10-Q, and S-1/F-1 filings, but none integrate section extraction, image extraction, and LLM validation. IPO-Toolkit operates directly on IPO filings and combines these capabilities with open data and open code. Prior chart and financial image benchmarks rely on synthetic or scraped images and typically focus only on charts without document-level traceability. In contrast, IPO Images is constructed directly from SEC EDGAR filings (1994–2026), linking each image to its source filing and metadata, and spans charts, infographics, logos, and maps with human annotations at scale.
| Tool | Filing Type | Modalities | Open Data | Open Code | Section Extractor | Image Extractor | LLM Validation |
|---|---|---|---|---|---|---|---|
| sec-edgar-downloader (Snow, 2019) | 10K/10Q, S-1/F-1 | [T] | ✓ | ✓ | ✗ | ✗ | ✗ |
| sec-api.io (sec, [n. d.]) | 10K/10Q, S-1/F-1 | [T] | ✗ | ✗ | ✗ | ✗ | |
| EDGAR-Crawler (Loukas et al., 2025) | 10K/10Q | [T] | ✓ | ✓ | ✓ | ✗ | ✗ |
| edgar (R package) (Lonare et al., 2021) | 10K/10Q, S-1/F-1 | [T] | ✓ | ✓ | ✗ | ✗ | |
| IPO-Toolkit (Ours) | S-1/F-1 | [T, I] | ✓ | ✓ | ✓ | ✓ | ✓ |
| Dataset | Years | Source | # Images | # Charts | # Infographics | # Logos | # Maps | Traceable | Human |
|---|---|---|---|---|---|---|---|---|---|
| ChartQA (Masry et al., 2022) | 2018-2022 | Statista+ | 21.9k | 21.9k | 0 | 0 | 0 | ✗ | |
| ChartQAPro (Masry et al., 2025) | — | Scraping/Tableau+ | 1.3k | 1.1k | 190 | 0 | 0 | ✗ | ✓ |
| InfographicVQA (Mathew et al., 2022) | — | Scraping | 5.4k | 0 | 5.4k | 0 | 0 | ✗ | ✓ |
| CharXiv (Wang et al., 2024) | 2020-2023 | arXiv | 2.3k | 2.3k | 0 | 0 | 0 | ✓ | ✓ |
| MapQA (Chang et al., 2022) | — | KFF/Synthetic | 60k | 0 | 0 | 0 | 60k | ✗ | ✗ |
| MME-Finance (Gan et al., 2025) | — | Trading Platforms | 4.8k | 4.8k | 0 | 0 | 0 | ✗ | ✓ |
| FinChart-Bench (Shu et al., 2025) | 2015-2024 | Bloomberg News+ | 1.2k | 1.2k | 0 | 0 | 0 | ✗ | ✓ |
| FinMME (Luo et al., 2025) | — | Reports/Scraping | 4.4k | 4.4k | 0 | 0 | 0 | ✓ | |
| ChartCheck (Akhtar et al., 2024) | — | Wikipedia | 1.7k | 1.7k | 0 | 0 | 0 | ✓ | |
| IPO-Toolkit (Ours) | 1994 - 2026 | SEC EDGAR | 76k | 17k | 15k | 14k | 3k | ✓ | ✓ |
Appendix B Chart Class Distribution by Industry
Table 9 reports the distribution of chart classes within each industry. Percentages are computed within industry, with raw chart counts shown in parentheses.
| Chart Class Distribution | ||||||
|---|---|---|---|---|---|---|
| Industry | Abbreviation | Bar | Line | Pie | Combo | Other |
| Agriculture, Forestry & Fishing | AFF | \cellcolorImgBinF53.2% (33) | \cellcolorImgBinC19.4% (12) | \cellcolorImgBinC11.3% (7) | \cellcolorImgBinB9.7% (6) | \cellcolorImgBinB6.5% (4) |
| Construction | CON | \cellcolorImgBinF52.9% (480) | \cellcolorImgBinC17.3% (157) | \cellcolorImgBinA2.8% (25) | \cellcolorImgBinD26.7% (242) | \cellcolorImgBinA0.4% (4) |
| Finance, Insurance & Real Estate | FIRE | \cellcolorImgBinF45.2% (1,429) | \cellcolorImgBinD22.9% (726) | \cellcolorImgBinC15.5% (492) | \cellcolorImgBinC14.5% (459) | \cellcolorImgBinA1.8% (58) |
| Manufacturing | MAN | \cellcolorImgBinF44.0% (3,045) | \cellcolorImgBinE30.1% (2,081) | \cellcolorImgBinB7.6% (528) | \cellcolorImgBinC13.3% (920) | \cellcolorImgBinB5.1% (351) |
| Mining | MIN | \cellcolorImgBinF41.0% (281) | \cellcolorImgBinC19.4% (133) | \cellcolorImgBinB9.1% (62) | \cellcolorImgBinD22.9% (157) | \cellcolorImgBinB7.6% (52) |
| Retail Trade | RET | \cellcolorImgBinF62.1% (329) | \cellcolorImgBinB7.5% (40) | \cellcolorImgBinC10.8% (57) | \cellcolorImgBinC18.1% (96) | \cellcolorImgBinA1.5% (8) |
| Services | SER | \cellcolorImgBinF60.4% (1,439) | \cellcolorImgBinB9.4% (224) | \cellcolorImgBinB8.8% (209) | \cellcolorImgBinC16.7% (398) | \cellcolorImgBinA4.8% (114) |
| Transportation & Utilities | TRN | \cellcolorImgBinF45.8% (609) | \cellcolorImgBinD21.4% (285) | \cellcolorImgBinC11.8% (157) | \cellcolorImgBinC16.5% (219) | \cellcolorImgBinA4.6% (61) |
| Wholesale Trade | WHO | \cellcolorImgBinF58.5% (155) | \cellcolorImgBinB9.8% (26) | \cellcolorImgBinC18.1% (48) | \cellcolorImgBinC12.1% (32) | \cellcolorImgBinA1.5% (4) |
| Other/Unknown | OU | \cellcolorImgBinE38.0% (295) | \cellcolorImgBinD28.7% (223) | \cellcolorImgBinC17.9% (139) | \cellcolorImgBinC12.2% (95) | \cellcolorImgBinA3.1% (24) |
| Total | \cellcolorImgBinF47.5% (8,095) | \cellcolorImgBinD22.9% (3,907) | \cellcolorImgBinC10.1% (1,724) | \cellcolorImgBinC15.4% (2,624) | \cellcolorImgBinA4.0% (680) | |
Appendix C Model Error Analysis
We analyze failure modes across components of the image pipeline to better understand their limitations on IPO filings. We first examine classification errors from the fine-tuned YOLO model trained on human-labeled images. We then analyze errors made by MLLMs when interpreting chart content, focusing on cases where image type was correctly identified but semantic interpretation failed.
C.1. YOLO Classification Errors
We manually reviewed instances where MLLM verification disagreed with YOLO predictions and grouped recurring error patterns. Failures are primarily driven by reliance on surface-level visual cues rather than semantic intent.
Overweighting Secondary Elements.
A recurring failure occurs when YOLO assigns a label based on a prominent visual element, even when that element is decorative or secondary within the image (e.g., 1, 2, 3). In these examples, the images were classified as Map because the model focused on small globe or world-outline graphics, even though those elements did not determine the primary purpose of the image. The predicted label reflects attention to a recognizable subcomponent rather than the overall function of the visual.


Overweighting Layout Structure.
In a subset of errors, YOLO assigns labels based on layout patterns rather than the function of the image. Images containing rows, columns, panels, or segmented blocks are sometimes classified into structured visual categories even when they do not encode quantitative information. For example, tables (which should be labeled Other) were classified as Infographic because their grid layout resembles designed summaries (e.g., 1). Similarly, some image collages and multi-panel layouts were labeled as Infographic due to their structured composition (e.g., 2). Product screenshots with grid-like interfaces, which belong to the Other class, were also misclassified as Infographic (e.g., 3). Segmented brand imagery was occasionally mislabeled as Map or Infographic (e.g., 4). In these cases, the prediction reflects how the image is arranged rather than what it communicates.


Size-Based Logo Misclassification
YOLO sometimes classifies small, isolated images as Logo regardless of their actual content. Decorative graphics, icons, or cropped design elements are labeled as logos primarily due to their compact size and bounded framing (e.g., 1). In these cases, the prediction is driven by size and visual isolation rather than identifiable branding or textual markers.

C.2. Multimodal LLM Error Analysis
To validate the quality of our MLLM-based chart classification, we manually annotated 2,285 images predicted as charts by the MLLM ensemble. Human annotators confirmed 98.6% of these predictions as valid charts, indicating high precision. We qualitatively reviewed the remaining false positives to understand recurring failure modes.
Embedded Charts in Composite Images.
MLLMs occasionally labeled screenshots of web dashboards, mobile applications, or presentation slides as charts when small chart components were embedded within a larger interface (e.g., 1, 2). Although a chart element is present, the image functions primarily as a composite interface rather than a standalone data visualization. In these cases, the presence of any chart-like component appears sufficient to trigger a chart label.


Infographic Misclassification.
MLLMs also misclassified process-oriented or narrative infographics as charts when these visuals conveyed sequential steps, conceptual flows, or categorical information rather than quantitative relationships (e.g., 1, 2, 3, and 4). Despite structural similarities to charts, these graphics do not encode numerical axes or data-driven comparisons.

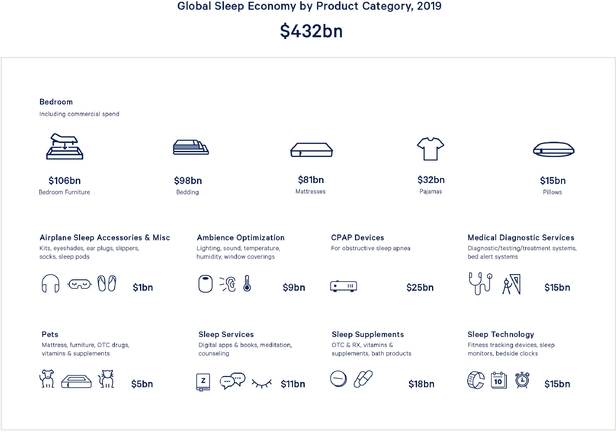

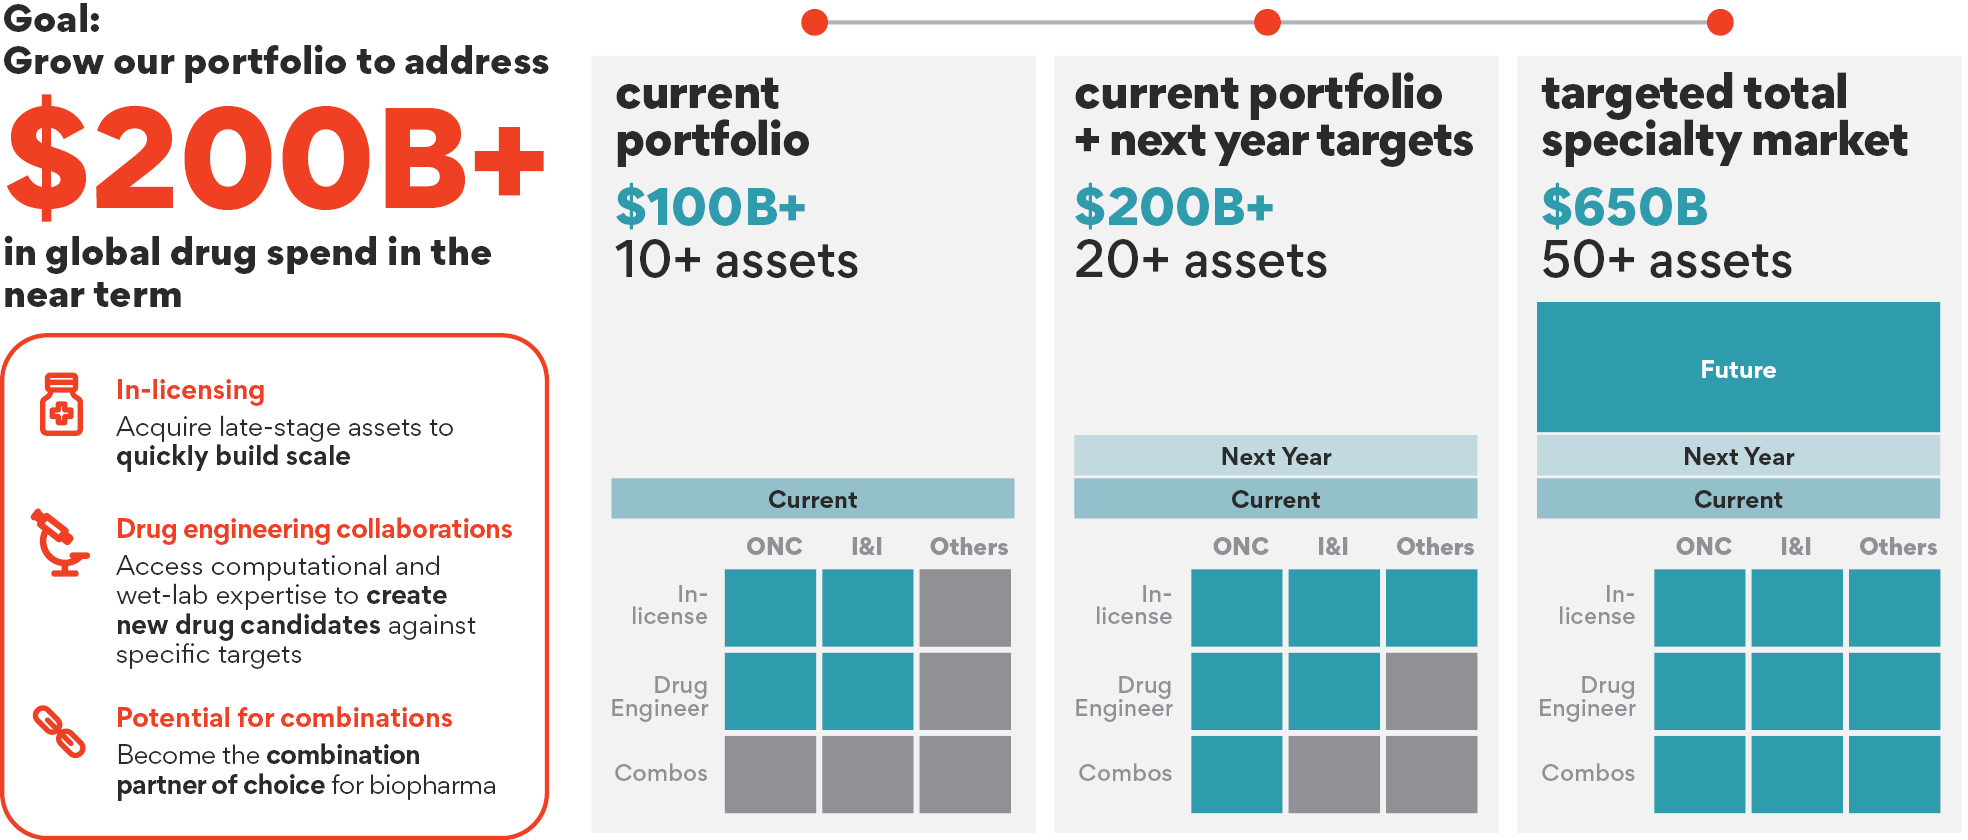
Additional Error Patterns.


C.3. Interactive Web Interface

Figure 9 presents the IPO-Data web interface.222https://demo.ipomine.siddharthlohani.dev In addition to the software package, we provide an open-source platform that enables interactive exploration of companies, filings, sections, and images. Users can filter results using standard metadata such as SIC industry, filing date, and form type, as well as structured attributes derived from the image classification and feature extraction pipeline, including image class, chart type, and prediction confidence thresholds.
The interface includes a built-in SQL console that allows custom queries against the dataset schema. This supports joins across filing metadata, text, and image-level attributes without local installation. The example shown retrieves images containing both bar and pie charts while excluding other visual types. Because filtering relies on structured attributes from the classification pipeline, users can target specific visual configurations and inspect results before export.
Appendix D Model Implementation Details
Model inference was conducted between January 5, 2026 and February 1, 2026. Anthropic models were accessed via the Anthropic333https://github.com/anthropics/anthropic-sdk-python and GPT models via the OpenAI API.444https://openai.com/index/openai-api/ Most open-source MLLMs were inferenced on an NVIDIA RTX PRO 6000 Blackwell GPU.