\ul
11email: julio.olivarescarvajal@inaf.it 22institutetext: Instituto de Astrofísica, Pontificia Universidad Católica de Chile, Av. Vicuña Mackenna 4860, 782-0436 Macul, Santiago, Chile 33institutetext: Departamento de Física, Universidad de Santiago de Chile, Av. Victor Jara 3659, Santiago, Chile 44institutetext: Center for Interdisciplinary Research in Astrophysics and Space Exploration (CIRAS), Universidad de Santiago de Chile, Santiago, Chile 55institutetext: Dipartimento di Fisica e Astronomia, Università degli Studi di Bologna, Via Piero Gobetti 93/2, Bologna, 40129, Italy 66institutetext: Osservatorio di Astrofisica e Scienza dello Spazio di Bologna, INAF, Via Piero Gobetti 93/3, Bologna, 40129, Italy 77institutetext: Max Planck Institute for Astronomy, D-69117 Heidelberg, Germany 88institutetext: Fakultät für Physik und Astronomie, Universität Heidelberg, Im Neuenheimer Feld 226, 69120 Heidelberg, Germany 99institutetext: IAC – Instituto de Astrofísica de Canarias, calle Via Láctea s/n, E-38205 La Laguna, Tenerife, Spain 1010institutetext: Departamento de Astrofísica, Universidad de La Laguna, E-38206 La Laguna, Tenerife, Spain 1111institutetext: European Southern Observatory, Karl Schwarzschild-Straße 2, 85748 Garching bei München, Germany 1212institutetext: Excellence Cluster ORIGINS, Boltzmann–Straße 2, D–85748 Garching bei München, Germany 1313institutetext: Department of Physics, Università di Roma Tor Vergata, via della Ricerca Scientifica 1, Roma, 00133, Italy 1414institutetext: INAF - Osservatorio Astronomico di Roma, via Frascati 33, Monte Porzio Catone, 00078, Italy 1515institutetext: AUI/NRAO - National Radio Astronomy Observatory, Associated Universities, Inc., Av. Nueva Costanera 4091, Santiago, Chile 1616institutetext: ESO – European Southern Observatory, Alonso de Cordova 3107, Vitacura, Santiago, Chile 1717institutetext: ASI - Space Science Data Center, Via del Politecnico s.n.c., I-00133 Roma, Italy
Spectroscopic metallicities and first -element abundances of RR Lyrae stars in Baade’s Window
Abstract
Context. The shape and kinematics of the metal-poor stellar component of the Galactic bulge are still poorly characterized, and therefore, the origin of this component is not yet strongly constrained. RR Lyrae stars in the bulge have been reported to be associated with the spheroidal, relatively metal-poor component. They offer a way to trace this component with precise distances and therefore the possibility to calculate orbits and minimize contaminations. While a few studies of RR Lyrae spectra with medium/high resolution are now available, none of them target stars in the Galactic bulge.
Aims. We present here a spectroscopic determination of Fe and -element abundances for RR Lyrae stars in the Galactic bulge, with the main goal of providing a benchmark to calibrate other metallicity indicators, appropriate for this specific stellar population.
Methods. We analyzed FLAMES/GIRAFEE spectra of 78 RR Lyrae stars (60 ab-type and 18 c-type). We applied a full-spectrum fitting technique to obtain the spectroscopic metallicity and overall -element abundance. Distances are derived by means of a period-luminosity-metallicity relation, and orbits are computed by combining the radial velocities derived here with the proper motions from Gaia DR3.
Results. The resulting metallicities peak at and dex for ab and c-types respectively. The majority of the bulge RR Lyrae are metal-poor stars with relatively high -element abundances around dex. We used our spectroscopic measurements to test different methods for deriving metallicities based on photometry, which utilize Fourier parameters in the light curves of the RR Lyrae. The data suggest a possible correlation between the metallicity difference and the [/Fe] ratio, which needs to be investigated further. There are some ab-type RR Lyrae that show metallicities higher than -1 dex and low values. We studied these stars kinematically and found a difference between three stars with similar [/Fe] values and the main group, indicating that they may be slightly younger and correspond to the disk population.
Key Words.:
stars: variables: RR Lyrae – Galaxy: bulge – Galaxy: abundances – Galaxy: kinematics and dynamics – Galaxy: formation1 Introduction
RR Lyrae (RRL) stars are pulsating variable stars extensively used to trace ancient stellar populations. These stars have ages exceeding 10 Gyr, as their progenitors are low-mass stars, roughly 0.6 to 0.8 in the helium-core burning phase. In the context of our Galaxy, they are frequently observed in halo globular clusters (Bhardwaj, 2022; Cruz Reyes et al., 2024), the bulge (Soszyński et al., 2019; Clementini et al., 2023; Zoccali et al., 2024), and, more recently, in the disk (Olivares Carvajal et al., 2024; D’Orazi et al., 2024). The Galactic bulge, in particular, is of significant interest for understanding the formation and evolution of the Milky Way, as it constitutes a predominantly old component, accounting for at least 25% of the total stellar mass within a highly dense region (e.g., Cao et al., 2013; Valenti et al., 2016; Portail et al., 2017; Simion et al., 2017).
RRL stars exhibit periods ranging from 0.2 to 1 day and display recognizable light curves, which are valuable for determining mean magnitudes. These stars adhere to a tight period-luminosity-metallicity (PLZ) relation in the -band (see e.g., Neeley et al., 2019; Bhardwaj et al., 2024; Zgirski et al., 2023; Prudil et al., 2024a, for recent calibrations). This PLZ relation is particularly useful for estimating precise distances within the Galactic context, achieving errors of around 5%. However, a notable concern regarding this relation is the dependence on metallicity, which is often derived from photometric data. Such metallicity estimates can introduce biases in the calculated distances. Consequently, it is crucial to understand how photometric metallicities and their associated uncertainties are determined to correctly propagate the errors in the resulting distance measurements.
Recent studies have demonstrated that photometric metallicities can be determined from the light curves of RRL variables (Mullen et al., 2021; Iorio and Belokurov, 2021; Dékány and Grebel, 2022; Clementini et al., 2023; Li et al., 2023; Jurcsik and Hajdu, 2023). These methods analyze the shape of the light curves and the associated Fourier parameters to evaluate how metallicity affects that shape. The method is advantageous since it is more efficient to obtain good-quality light curves than high-resolution spectra for a stellar sample. Consequently, it is possible to obtain metallicities for a massive number of stars, larger than any spectroscopic sample; however, with large individual errors. Nevertheless, it is essential to recognize that biases are linked to the calibration of the method. For instance, it is important to ensure that the data used to calibrate the method are exactly in the same passbands as the data to be analyzed.
On the other hand, several studies have derived metallicity using spectroscopy. One caveat is that their pulsating nature affects the absorption lines in the spectrum only around the steep rising branch of fundamental pulsators, while the rest of the time remains constant (Pancino et al., 2015; Magurno et al., 2018). Consequently, knowing the pulsation phase of the spectra is relevant. Additionally, RRLs are relatively hot and generally metal-poor stars, resulting in limited absorption lines available for determining metallicities and other abundances. The method utilizes the Balmer series of hydrogen lines in conjunction with the Ca II K line to estimate metallicities (Preston, 1959; Freeman and Rodgers, 1975; Walker and Terndrup, 1991; Suntzeff et al., 1991; Layden, 1994). Recent research applying this method has significantly improved the accuracy of the metallicity estimates and reduced associated errors (Chadid et al., 2017; Sneden et al., 2017; Crestani et al., 2021b, a). More recently, Kunder et al. (2024) demonstrated that even with intermediate to low-resolution spectra and using the calcium triplet (CaT), it is possible to obtain reliable spectroscopic metallicities that agree with findings from other studies.

The research presented in D’Orazi et al. (2024), which utilizes high-resolution spectra from the GALAH survey, establishes a novel method for accurately determining spectroscopic metallicities and abundances for both the halo and the disk through full spectral fitting of RRL stars in the solar vicinity. Additionally, the study provides measurements of -element abundances as well as Y and Ba abundances. These findings contribute to confirming the existence of a metal-rich tail of RR Lyrae stars, which is associated with the origins of the old disk.
The current studies indicate that new techniques have successfully achieved more precise spectroscopic measurements of metallicities and other abundances in RRL stars. Furthermore, we can test the relationship between photometric and spectroscopic metallicities with larger statistics, which will enhance the calibration of the more abundant photometric metallicity techniques. Despite these advancements, there remains a lack of research on the spectroscopic metallicities of bulge RRL stars. The study by Walker and Terndrup (1991) is currently the only spectroscopic analysis conducted in the bulge, and to date, no research in this region has provided -element abundances.
We present here measurements of spectroscopic metallicities and -element abundances of RRL stars in two fields observed with the FLAMES/GIRAFFE spectrograph in Baade’s Window, a field of the bulge well-known for its very low extinction. The paper structure is as follows: Section 2 describes the data: the spectra, light curves, distances, proper motions, and radial velocities. Section 3 presents the full spectral synthesis method employed to derive the fundamental parameters. Section 4 describes the comparison between photometric and spectroscopic metallicities. In Section 5, we explain the orbital integration employed. Section 6 shows the chemodynamical analysis of the stars. Finally,
In Section 7, we present the discussion and conclusions.

2 Data
2.1 GIRAFFE spectra
The spectra for this study were obtained through observations conducted with the GIRAFFE/FLAMES spectrograph (Pasquini et al., 2002) installed on the 8.2-meter UT2 VLT@ESO telescope (Program ID: 093.B-0473, PI: M. Catelan). Fig. 1 top panel illustrates the positions of the stars across Baade’s Window in the bulge region, located at coordinates . Baade’s Window is particularly well-suited for optical observations due to its relatively low extinction (both absolute and differential) compared to other regions of the bulge. The sample consists of two pointings using FLAMES. The RRL stars were selected from the OGLE-III survey (Soszyński et al., 2011). The observation plan involved five repeated measurements of the same field fiber configuration, with exposure times of 42 min. These observations were carried out using the High-Resolution Grating 10 (HR10) within the optical range of 5339 to 5619 Å, achieving a resolution of approximately .
We initially had spectra for 87 RRL stars; from those, 65 were fundamental-mode RRL (RRab) and 22 were first-overtone RRL (RRc). The reduced data were obtained from the ESO phase 3 stream data release111https://www.eso.org/sci/publications/announcements/sciann17187.html. The spectra were normalized using the astropy (Czesla et al., 2019) package from Python (Pérez and Granger, 2007).
The mean signal-to-noise ratio (SNR) of the individual spectra was . Out of the 65 RRab stars analyzed, only 4 did not meet the quality criterion of SNR ¿ 17, which was established to ensure a robust spectroscopic analysis. Below this value, the spectrum is completely dominated by the noise, and no absorption lines can be observed. In contrast, all RRc stars met this quality selection. Following the application of this criterion, we retained a total of 61 RRab stars and 22 RRc stars, each with five available spectra, except for one RRab star that had four visits, resulting in a total of 83 stars.
2.2 Light curves
Light curves were obtained from the OGLE-IV catalog (Udalski et al., 2015). We successfully recovered all the stars. For these, we have collected I and V-band light curves. Relevant parameters derived from the I-band light curve, such as the period and the amplitude in the I-band , are also available in the OGLE-IV catalog. The bottom panel of Fig. 1 presents the Bailey diagram of our RRL sample, clearly distinguishing between RRab and RRc stars based on the parameters from the OGLE-IV catalog.
Additionally, we obtained near-infrared (near-IR) light curves for our stars from the VVV survey (Minniti et al., 2010), which utilized the VISTA 4.1m telescope at the ESO Paranal Observatory. This survey, equipped with the VIRCAM near-IR camera, observed the Galactic bulge and disc over a span of more than nine years. We extracted the J and -band light curves for most of our targets using point spread function (PSF) photometry, as described in Contreras Ramos et al. (2018). The -band light curves have an average of 86 points, with those from the inner regions containing more data, approaching 120 observations. The J-band light curves typically have considerably fewer points, typically ranging from 3 to 5 points.

2.3 Distances
To determine the distances, we used the classic distance equation
| (1) |
where is the mean magnitude, is the absolute magnitude, and is the extinction coefficient. The absolute magnitude was calculated using the period-luminosity-metallicity (PLZ) relation by Prudil et al. (2024a) for the , and -band.
| (2) |
where is the period of the RRL star, and [Fe/H] is the metallicity, that we derive in Sec. 3. We also used the PLZ to calculate the color excess in the same manner as Prudil et al. (2025) in eq. (5) and (7). Then, the extinction coefficient can be calculated as
| (3) |
where is the extinction ratio, and we adopted the values of Table 3 from Prudil et al. (2025). We derived absolute magnitudes for each passband using the corresponding PLZ and, subsequently, this subtraction is the obtained reddening. The reddening values obtained and the extinction law from Prudil et al. (2025) are in good agreement with previous reddening maps and with the ratio previously reported in Baade’s Window (Nataf et al., 2013; Saha et al., 2019). The observations were designed to avoid large changes in the extinction with values closer to mag. Finally, using this reddening as well, we obtained the distance for the RRL stars.
In order to estimate errors, we used the following formula, derived from the distance modulus expression:
| (4) |
where this is the statistical error that we considered for our distance.

The study by Prudil et al. (2025) also demonstrated that in the Galactic bulge, the Period-Luminosity relation (PLZ) exhibits a significantly stronger correlation with extinction in regions that are more heavily obscured. Fortunately, Baade’s Window is characterized by low extinction levels, which allowed us to determine the distances using both the and bands, yielding very similar results. Based on the average distance distribution of our targets, we estimate the distance to the Galactic center to be kpc. This finding aligns well with the accepted measurements of the Galactic center distance (GRAVITY Collaboration et al., 2021; Leung et al., 2023). It is essential to note that our sample size is insufficient to constrain the Galactic center distance in a statistically robust manner. Nonetheless, our results indicate consistency with current values. The distance distributions for RRab and RRc stars are in Fig. 3 and the individual distance estimations are in Table 1.
2.4 Proper Motions
Proper motions (PMs) were obtained from the Gaia Data Release 3 (DR3) survey (Gaia Collaboration et al., 2023). The Gaia spacecraft features a mirror measuring 1.45 m by 0.45 m and has been observing the Galaxy in the optical regime since 2014, with its mission concluding in January 2025. Previous studies have demonstrated that the precision of Gaia’s PM measurements is well-established, with significant enhancements noted in the latest data releases. Additionally, the bulge region has been observed by Gaia, yielding promising results for areas such as Baade’s Window, which are less affected by extinction.
We initially utilized the Clementini et al. (2023) catalog of RRL variables to identify our stars through a cross-match with Topcat (Taylor, 2005). In the cross-match we also used the magnitude as a reference and then we checked if it is the correct star comparing the periods. Our search yielded 57 RRab and 15 RRc stars from the total. This indicates that some of the RRL confirmed by OGLE-IV were not validated as RRL in Gaia DR3. This finding is notable but not uncommon in regions such as the bulge, where crowding can significantly affect the accuracy of confirmations. For the remaining variables, we conducted another cross-match directly with the Gaia DR3 catalog, again using the magnitude as reference, which enabled us to identify the remaining stars. However, for two of the RRab stars, the catalog lacked proper motion (PM) measurements. The PMs we obtained for our sample are consistent with bulge stellar populations and are listed in Table 1.
2.5 Systemic radial velocities
Since RRL stars are pulsating variables, the observed RV must be corrected by the pulsation at the moment of the observation in order to obtain the real line of sight velocity. Systemic, or barycentric radial velocities () for each star can be derived from the available GIRAFFE spectra. The estimation and correction of the radial velocity for individual spectra at various phases for a given star were conducted using an in-house code. This code cross-correlates the stellar spectrum with a small grid of synthetic templates, selecting the one with the smallest value after applying a preliminary radial velocity correction. This chosen template is then used to obtain the final estimate of the radial velocity.
To calculate , we adopted the same methodology as outlined in Prudil et al. (2024b). They derived a radial velocity (RV) curve, and consequently, the observed RV per phase for both RRab and RRc stars using spectroscopic samples from APOGEE and Gaia. These RV curves are suitable for our research, given that our observations are in the optical range, and they enhance the accuracy of the estimation by 50%. With these RV curves, we achieved consistent results for both RRab and RRc types. The calculation of involves adjusting the RV value for the observation phase by the amplitude of the light curve. Thus, the five observation phases per star are utilized to select the observed RV and, in turn, estimate the final at , which indicates the moment when the star is in its mean brightness (Kunder et al., 2020; Prudil et al., 2025). The final values are listed in Table 1.

3 Iron and -element abundances
3.1 Full spectral fitting
We estimate atmospheric parameters through full-spectrum fitting of the observed spectra against a grid of synthetic spectra. We used the analysis code FERRE (Allende Prieto et al., 2006). FERRE matches models to data, identifying the model parameters that best reproduce observations. We used the Turbospectrum radiative transfer code (Plez, 2012), the MARCS stellar atmospheric models (Gustafsson et al., 2008), and the Gaia ESO survey line list (Heiter et al., 2021) to create the synthetic library. Furthermore, we calculate atmospheric models covering appropriate ranges for the atmospheric parameters: effective temperature (), surface gravity (), metallicity (), -element abundance (/M]), microturbulence velocity (). At the moment of compiling the grids for FERRE, one extra dimension was added for the macroturbulence velocity ().
A set of three main grids of models covering the regions around the HB of the HRD was produced. The models are in the same spectral region as the HR10 mode of GIRAFFE and have the exact resolution. Depending on the region covered, these grids were referred to as main, warm, and hot.
The main grid comprises the region of the H-R Diagram around and . It is the location where we can generally find Red Giant Branch (RGB) and Red Clump (RC) stars. The warm grid is extended between and . This region is where HB stars are generally found, and it is the location where the majority of RRLs reside, as they orbit around the Instability Strip, which is situated in this region. Finally, the hot grid is arranging from and . This region is made for hotter stars, such as RRc, and would be useful for those.
The analysis consisted of compiling the individual spectra, resampling the fluxes to be cast to the wavelength sampling of the grids, and running them against the three grids. FERRE interpolates in the grid in order to minimize the between the observed and synthetic fluxes, normalizing both with a fourth-grade polynomial. The parameters of the best-fit model are reported in one of the files, and we assume that they are the best estimation of the analyzed star. FERRE also creates another file that saves the best-fit model, and we selected the option to save the re-normalized version of the spectra. The best result between the different grids was chosen as the best model for that spectrum. Fig. 2 shows an example of one spectrum and the corresponding best-fit model for an RRab star. The warm grid was generally the best for RRab and RRc stars, while the hot grid was selected for some RRc stars.
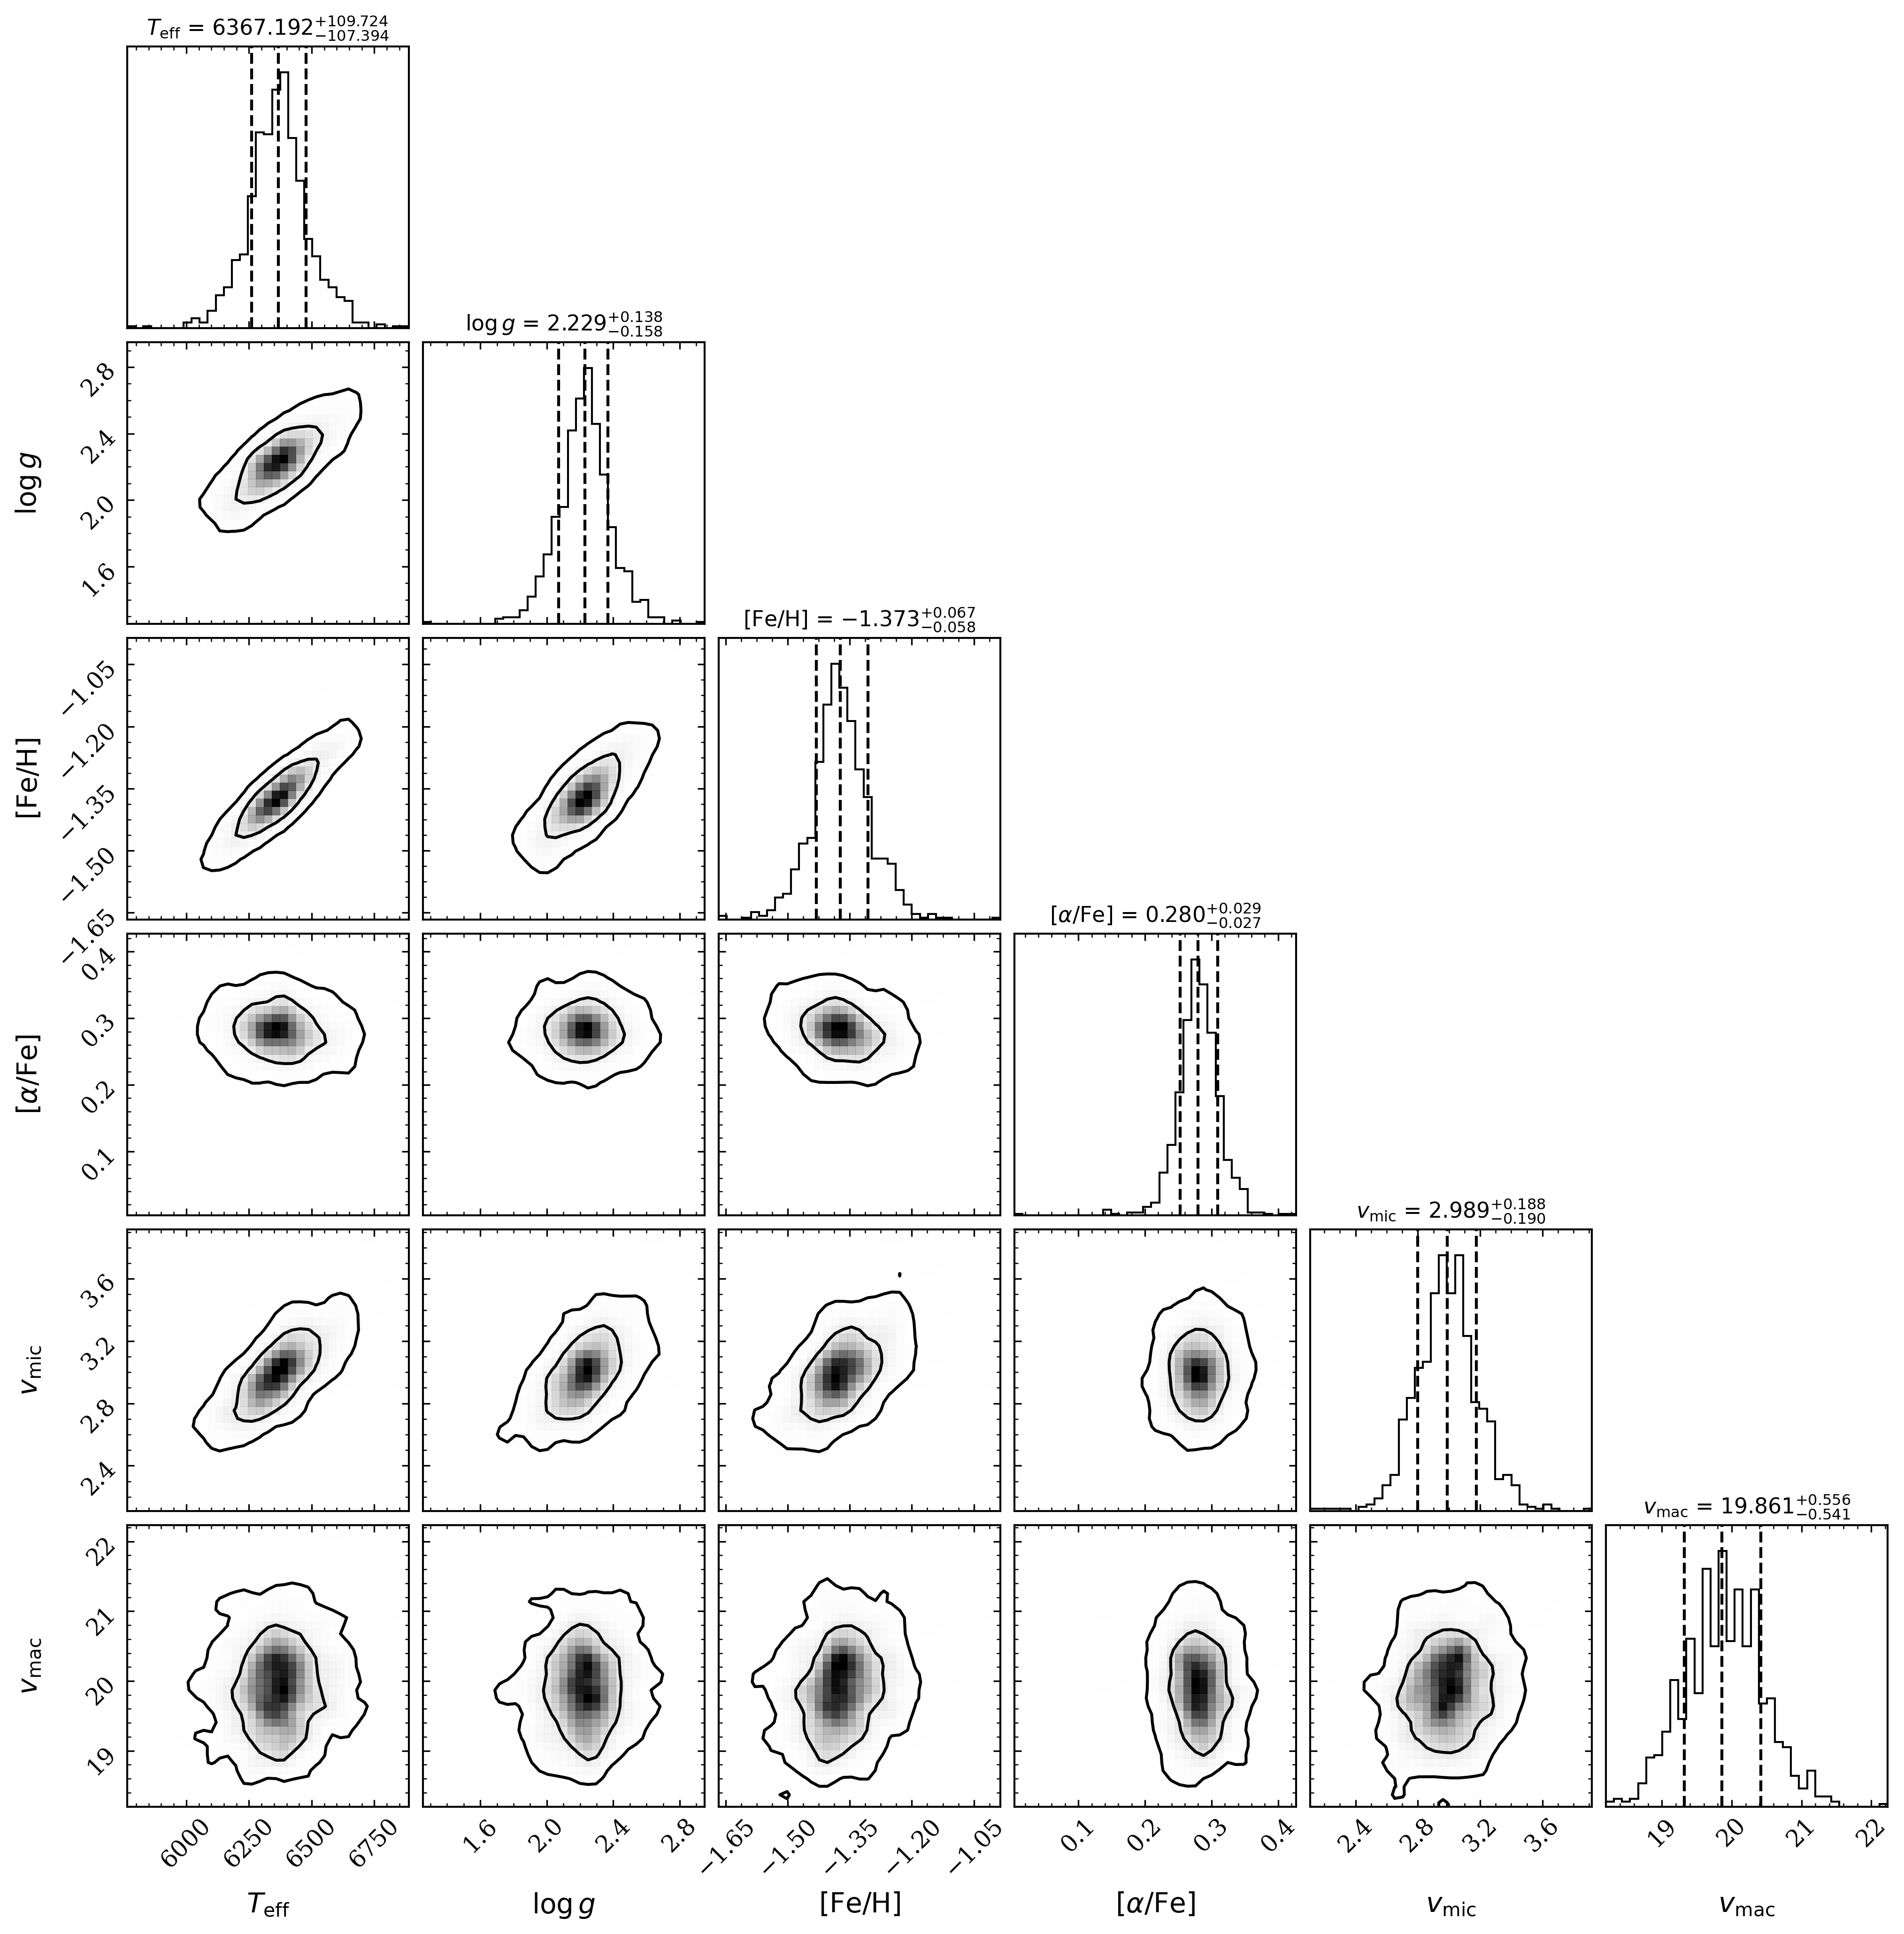
In order to estimate realistic errors for and /Fe], we took advantage of the fact that we have five spectra, at different pulsation phases, for each RRL star. Therefore, for each of those spectra, we performed 1000 flux Markov-Chain Monte Carlo (MCMC) flux resamples, assuming a Poisson of the flux error. Then, we re-derived the atmospheric parameters, including metallicity. We obtained variations with sigma of 0.08 dex for and 0.04 dex for /Fe]. Fig. 15 shows a corner plot with the results of the MCMC for the fundamental parameters of one RRL star as an example. In addition, Appendix B contains a description of the observed correlations.
In order to analyze the consistency of the measured atmospheric parameters, we created diagnostic plots to test the results for different parameters versus the observation phase for each spectrum, considering that we have five observations per star. The observation phases were obtained using the period and the time of the maximum of the light curve from the OGLE-IV catalog, combined with the MJD of the observation in the header of each spectrum. Fig. 4 shows the result for three RRab stars and their six atmospheric parameters. Fig. 14 shows the same for two RRc stars. The results are consistent with those of previous studies (Pancino et al., 2015). For instance, we observed that changes with the observation phase for each star, even for different SNR, while , , and (/Fe] do not change significantly with phase. This result is crucial in determining the mean value of each fundamental parameter. Consequently, and are naturally changing with phase. Since these two parameters indicate physical processes occurring in the star’s atmosphere, it is normal for them to change with the star’s pulsation. In summary, we conclude that the atmospheric parameters are well-constrained using the full spectral fitting method.
Fig. 4 also shows that stars with different SNR do not produce significant changes in the obtained fundamental parameters. Moreover, we do not observe a difference in the dispersion. We will call metal-poor (m-poor) RRab those with dex and metal-rich (m-rich) those with dex following the separation of previous studies (Du et al., 2020; Prudil et al., 2025). From the same figure we observe that m-rich RRL have consistently higher , and lower -element abundances than the m-poor ones.
3.2 Quality selection
In order to obtain the mean values of the fundamental parameters for each star, we decided to first look at the fitting adjustments. As previous studies have stated (Pancino et al., 2015) (hereafter, P15), there are certain regions during the observation phase where the absorption lines undergo drastic changes due to the pulsation of the stars. Sometimes, the change is significant, and the absorption lines are almost lost. By the time of the observations, these stars were observed at random observation phases, so this factor could be significant.
We define a quality factor (QF) to select the reliable synthetic fits to determine the fundamental parameter mean values. We focused on two regions of the spectra to determine this quality factor. The former, between 5430 and 5470Å where we can see five iron I (FeI) lines. From these lines, three are particularly strong and valuable in determining whether the fitting model is good. We examine this region to ensure that our estimation of the metallicity is reliable. The latter region is from 5500 to 5540 Å. This region contains FeI lines, too, but more importantly, it contains magnesium I (MgI) and calcium I (CaI) lines. We have one MgI line, but it is one of the strongest absorption lines in this spectral range. Additionally, there is a small CaI line, which is the most abundant -element in this spectral region. Thus, the second region is useful to test our /Fe] estimations.
Fig. 5 shows an example of both scenarios occurring in the same star. In the right panel, we display a spectrum with QF=1, meaning that the metallicity and /Fe] ratio are both reliable, and in the left panel, we display the other scenario, where the absorption lines are almost lost, and no information can be obtained from the spectrum, so QF=0. The observation phase is then crucial in defining these regions, but there are also some particular cases to consider.
Using the QF, we found a star with ID OGLE-RRLYR-BLG-12573, which shows no variability. This is because the five available spectra show the same RV at distinct observation phases and no change in the absorption line shape. It is also a considerably more m-rich star. After the FERRE run, the star shows parameters related to an RC star, so it was discarded for further analysis. We believe that, as the star was discovered by OGLE using a small telescope, when we observed it with the VLT, a considerably larger telescope, more stars were resolved, and the fiber was accidentally placed on a neighboring star in this crowded region.
We found two RRc stars that show similar patterns to the previous one, with names OGLE-BLG-RRLYR-11456 and OGLE-BLG-RRLYR-12432. These stars exhibit negligible changes in RV versus observation phase, but show some differences in the spectra. We observed both in Aladin (Bonnarel and others, 2000) using a VVV map and found that both stars are blended. This blending can explain the RV estimations, so these two are also discarded for further analysis.
After the quality selection, we have 60 RRab and 18 RRc stars with robust values for their atmospheric parameters. Considering the stability of iron and -element abundances, we calculate the mean values for both parameters for each star, which are very useful for studying the evolution of stellar populations.
3.3 Mean values for iron and -element abundances
We obtain median values for the RRab and RRc stars. The RRab stars have a median metallicity of dex, where the error is the standard deviation of the distribution divided by the square of the number of stars. For RRab -element abundance we obtained a median of dex. In the case of the RRc the values are dex and dex. The metallicities for RRab and RRc stars and their difference, where RRc stars are systematically more m-poor than RRab stars, agree well with previous spectroscopic estimations, where this difference is explained by differences in the evolutionary path (Fabrizio et al., 2019; Crestani et al., 2021b, a).


We found a difference with the only previous work focused on high-resolution spectroscopic metallicities of RRL stars in the bulge (Walker and Terndrup, 1991), where they found a mean metallicity of dex for 41 RRab stars. However, our result is in agreement with that of Savino et al. (2020), which used the Calcium triplet method to obtain spectroscopic metallicities and found a mean of -1.24 dex. We note that at least part of the offset can be explained by the different metallicity scale. Indeed, Crestani et al. (2021b), calculated a difference of 0.08 dex between the [Fe/H] they derive based on the scale of For et al. (2011), Chadid et al. (2017), Sneden et al. (2017) (hereafter FCS) and those of Carretta et al. (2009). Assuming the same applies to our measurements, the latter would be 0.08 dex higher on the scale by Carretta et al. (2009). Correcting by this factor, the mean metallicity for our RRL sample would be 1.26 dex, in agreement with Savino et al. (2020).
Figure 6 shows the [Fe/H] vs plane, which is crucial to analyze the evolutionary path of the RRLs. The errors shown are the standard error of the mean of the obtained values for each observed phase of a single star, which already include the individual error on the parameter. The time delay model explains that supernovae II enrich the interstellar medium (ISM) earlier, since massive stars collapse rapidly with time. They provide -elements and iron with a fixed proportion to the ISM. After some time, supernovae Ia enrich the ISM principally with iron peak elements, producing a decrease in the ratio, so new generations of stars have less and higher levels of [Fe/H]. The light red dots in Fig. 6 are abundances of bulge stars from the Gaia ESO Survey Data Release 4 (GES DR4), while light blue points are disk stars from the same survey. Our RRLs are primarily m-poor, with a peak near -1.35 dex, but there are some RRab that could be considered m-rich, with metallicities greater than -1 dex. Some of these stars also show lower abundances of . There are no m-rich stars in the RRc group.
The location of most RRL stars is at -element abundances around 0.25 dex. This value is in the range of the bulge, although it is slightly lower compared with other bulge m-poor stars. There are two possible explanations. Firstly, our -element abundances are based on Ca and Mg lines, where previous studies show that calcium abudance is generally lower than other -elements in RRL stars (Pancino et al., 2015; D’Orazi et al., 2024). This hypothesis could be tested by means of high resolution spectra covering a wider wavelength range, therefore allowing the direct measurement of different elements. The other possibility is that bulge RRLs have a different star-formation history, meaning they formed under different conditions in the interstellar medium at an early stage of the Galaxy.
We found that our m-rich RRL stars exhibit ratios that vary with metallicity, suggesting that this group may have mixed origins. As a test, Fig. 7 shows the period and amplitude of our sample colored by metallicity in the left and by -element abundance at the right. From these figures, the majority of the RRab stars are located around the black line, calculated using a spline fit to the stars in that region, and this is the typical tendency of the Oosterhoff I (OoI) group for RRL stars. The stars on the right side are likely RRab stars associated with the Oosterhoff II (OoII) group. A surprising point is that several of the m-rich RRab stars with lower levels of [/Fe] are located at the left side of the OoI group. Prudil et al. (2025) suggests that a possible cause for the different metallicities of RRL stars is a difference in age of about 2 Gyr, whereby the oldest RRL could have ages around 12 Gyr, while the ”younger” ones have ages around 10 Gyr. Our results suggest that this working hypothesis may be true; however, further data on m-rich RRL stars in the bulge are needed to draw a stronger conclusion. Further discussion about these m-rich RRL stars will be given in Section 6 below, when analyzing orbits.
|
-
•
All IDs start with the OGLE-BLG-RRLYR identifier. The coordinates, type, periods, mean magnitudes, amplitudes, velocities, metallicities, -element abundances, distances, and proper motions are presented. The complete version, which includes the Gaia IDs and the errors, is only available in electronic form at the CDS via anonymous ftp to cdsarc.u-strasbg.fr (130.79.128.5) or via http://cdsweb.u-strasbg.fr/cgi-bin/qcat?J/A+A/.
4 Comparison with previous studies


4.1 Comparison with previous spectroscopic abundances of RRL stars
In Fig. 8 we compare our results with previous spectroscopic works that derived [Fe/H] and either the global [/Fe] or a single element such as Mg or Ca. They all refer to RRLs in different galactic components than the bulge. The blue triangles in the top left panel came from P15, based on solar vicinity RRL stars, observed with SARG@TNG and UVES@VLT; they obtained iron, Mg and Ca abundances by the equivalent width method. Only the Calcium abundance is used in this figure since it is available for more stars. Our RRLs span the same region as those in P15, with the exception of the m-rich RRL variables that are not present in P15. This could be a real, evolutionary difference, but also simply low number statistics. Larger samples are needed to reach a solid conclusion.
The light green diamonds on the top right panel come from Crestani et al. (2021a) (hereafter, C21) and are RRL stars (both RRab and RRc) in the solar vicinity. Iron abundances were obtained by the method, on high-resolution spectra from the echelle spectrograph at the Du Pont Telescope (Las Campanas Observatory). The -element abundances, instead, were obtained by the equivalent width method. The bulk of our RRLs share the same abundance ratios as those in C21, however, our sample does not include RRLs as m-poor and -rich as those of C21 suggesting a real lack of those stars in the Galactic bulge, compared to the local disk.
The brown squares on the bottom left panel are solar vicinity RRL stars from D’Orazi et al. (2024) (hereafter, D24). They obtained abundances for several alpha elements by the full spectral fitting method on high-resolution spectra. We show only Calcium abundances here, because they are the most robust measurements in that study. Since our -element abundances were based mainly on Ca and Mg lines, this comparison is appropriate. The bulk of our RRLs overlap with the D24 sample. The m-rich RRLs from D24, however, have a lower [/Fe] ratio compared with ours. These lower values were not expected for the MW disk, which is why they propose a different origin (a primordial disk) for these stars.
Finally, the bottom right panel shows, as grey triangles, RRLs from Magurno et al. (2019) (hereafter, M19). These variables belong to the globular cluster Cen. M19 used high-resolution spectra to obtain abundances using the equivalent width method for about 80 RRL stars, but they provide -element values for only 18 RRL stars. As expected, our abundances differ from those of M19 in almost the entire distribution. Cen RRL stars are more m-poor and -enhanced than bulge RRL variables. A plausible reason for this difference could be that the population of Cen, located in the Galactic halo, has intrinsically less metal content due to a different chemical evolution. Furthermore, it is essential to note that the abundance analysis method employed in M19 differs significantly from the one used in this study; therefore, the abundance scales may have an offset.

In summary, the [/Fe] ratio for our RRL variables in the bulge are consistent with those of previous studies. The observed differences are compatible with those expected in different Galactic components.
4.2 Comparison of spectroscopic vs photometric metallicities for RRL stars
One of the primary goals of this study is to provide a sample of RRLs in the bulge to be used as calibrators, or at least a reference, to validate the different methods proposed to derive metallicity from photometry.
To this end, we provide here a comparison between our results and several photometric methods recently proposed. Specifically, we derived photometric metallicities for our RRLs by means of -band light curves, as proposed by Dékány and Grebel (2022) (hereafter DG22), by means of the -band light curves from the Gaia DR3 survey according to the prescriptions by Li et al. (2023) (hereafter Li23) or by Iorio and Belokurov (2021), by means of V-band lightcurves as proposed by Mullen et al. (2021) (hereafter M21), and, finally, by using the periods and as in Jurcsik and Hajdu (2023) (hereafter JH23) using their Eq. 2 or their Eq. 3.
The -band light curves for 60 of our variables were extracted from the VVV survey, corrected by the Heliocentric Julian Day (HJD), and then feed to the lcfit222https://github.com/idekany/lcfit code to be phased. Afterwards, we use the rrl_feh333https://github.com/idekany/rrl_feh_nn code to obtain the photometric metallicities. The method is based on a set of light curves from VVV, used as a training set. The differences between these metallicities and our spectroscopic measurements are shown in Fig. 9, panel-a.
There are 31 RRLs in common between our catalog and Li23. For these stars we retrieved their photometric metallicity directly from the catalog available in CDS. Their method is based on the -band light curves from Gaia DR3, together with the periods and the parameters. The differences are in Fig. 9, panel-b.
In order to compare with the method proposed by IB21, we performed a cross-match between our sample and the Gaia DR3 catalog of RRL stars (Clementini et al., 2023, hereafter C23). For the 32 common variables, we retrieved the periods and the values from Gaia, and obtained the photometric metallicity using Eq. 3 from IB21. It is worth noticing that the parameter provided in the Gaia catalog is in the form, and it must be transformed into the form in order to be feed into the equation. The differences are shown in panel-c of Fig. 9.
The method proposed by M21 is based on the -band light curve, specifically from the ASAS-SN survey (Shappee et al., 2014). All our stars were selected from the OGLE-IV catalog; therefore, they all have very well-sampled and -band light curves in the Johnson-Cousins system, the same used by the ASAS-SN survey. The parameter provided by OGLE-IV, however, is based on the -band light curves. It was transformed into the -band using the relation provided by (Skowron et al., 2016, their Eq. 6), and then fed to Eq. 6 by M21. The differences between the resulting metallicities and our spectroscopic values are shown in panel-d of Fig. 9.
The method proposed by JH23 is also based on the Gaia light curves and parameters, which were retrieved from C23. We fed the periods and values on both their Eq. 2, calibrated upon all the globular clusters with robust spectroscopic metallicities, and their Eq. 3, calibrated only upon the OoI type clusters, which should be more representative of our bulge RRLs. The differences are shown in Fig. 9, panel-e and panel-f, respectively.
The colorbar in Fig. 9 adds the dimension. The black line is a zero level reference line, while the red line is the mean difference. As expected, different methods show different mean residuals, however, with the only exception of D22, the photometric metallicities are always higher than the spectroscopic ones. This result has been observed already by Mullen et al. (2021) and by Kunder et al. (2024), who compared with the results from the high-resolution spectroscopic measurements by C21. Some of the methods also exhibit trends with metallicity, however those are strongly influenced by the very small number of variables in the highest and lowest metallicity regimes, therefore, with the present sample, they are not statistically robust.
Fig. 10 shows a set of 158 RRab stars from C21 in the same form as Fig. 9, compared with the IB21 (left) and with JH23 (right). The red-violet circles are our RRab stars. From both panels, we observe an offset in metallicities, indicating that the C21 spectroscopic metallicities are lower than the photometric ones. For the C21 RRab set, the offset is 0.16 dex when comparing with IB21 and 0.2 dex with JH23; these values are in agreement with our results (0.17 for IB21 and 0.22 for JH23 Eq. 3, respectively). Thus, using different spectroscopic datasets, we obtain similar offsets between spectroscopic and photometric metallicities.
There is no clear explanation for the offset observed. Nonetheless, a clue is the behavior of the offset for RRc stars. There are fewer photometric relations for RRc stars; however, the Mullen et al. (2022) relation is a robust and recent one. Fig. 10 right panel shows the metallicity difference with that study for our 18 RRc stars. The offset for RRc stars is lower compared with the one for RRab in Fig. 9 panel-d. Furthermore, if we change to the Carretta et al. (2009) scale and consider the dispersion, this result is in agreement with this relation. This means that the offset is more prominent in the case of RRab stars. Since photometric metallicity is based on empirical values of period and , these could be affected by different atmospheric factors present in RRab stars and not considered, as the Non-LTE effect or the -element abundances.
Fig. 11 shows the difference between our spectroscopic metallicities and the photometric ones as a function of the [/Fe] ratio. The color bar shows the spectroscopic metallicity. The two calibrations based on the light curves from Gaia show an increasing offset with respect to spectroscopic values, for high values of the [/Fe] ratios. This might suggest that the value of the abundance ratio of the calibrators might not be appropriate for bulge RRL. In addition, all the methods show a larger spread in the residual for higher -element abundances. This might be just a visual effect due to the lower statistics at low alphas, or a real trend. Larger samples are needed to clarify this point.
5 Orbital integration

In order to obtain the orbits of the RRL stars, we follow the same approach presented in Olivares Carvajal et al. (2024). Here, we present a brief summary of the orbital code implemented and the potentials.
We used the orbital code OrbIT (De Leo et al., 2026), which has the advantage of including the potentials in the inner part of the Galaxy and the possibility to change the relevance of each potential. The model of the MW gravitational potential used in our orbital integrator includes a Navarro-Frenk-White dark matter halo (Navarro et al., 1996), two stellar and two gaseous disks with the profile by Miyamoto and Nagai (1975), a rotating bar (Long and Murali, 1992), and a spherical bulge component modeled as a Hernquist profile (Hernquist, 1990). The details of the masses and all other parameters for each component of the potential can be found in De Leo et al. (2026).
In order to derive the orbital parameters, we converted the observed coordinates, the RVs, the PMs, and the distances into the Cartesian galactocentric frame with the Astropy modules (Astropy Collaboration et al., 2013, 2018). We used a distance of the Sun to the Galactic center of 8.27 kpc (GRAVITY Collaboration et al., 2021) and the solar velocity vector (Schönrich et al., 2010). The velocity of the Local Standard of Rest is assumed to be (McMillan, 2017). For each star, the orbits were evolved backward in time for 5 Gyr inside the MW potential. We obtain orbits for 57 RRab and 17 RRc stars, since 3 RRab and 1 RRc do not have PM values. The resulting orbital parameters are listed in Table 2.

| OGLE ID | Classification | [Fe/H] | [/Fe] | ETot | Lz | |||||||
|---|---|---|---|---|---|---|---|---|---|---|---|---|
| (dex) | (dex) | () | () | (kpc) | (kpc) | (kpc) | ||||||
| 12255 | m-poor | -1.36 | 0.21 | -1.830086 | -0.283062 | -0.625 | -0.164 | -0.526 | 2.631 | 0.730 | 2.0067 | 0.584 |
| 12280 | m-poor | -1.24 | 0.26 | -2.299907 | -0.0452344 | -0.324 | -0.645 | -0.205 | 1.254 | 0.272 | 1.1269 | 0.654 |
| 12285 | m-poor | -1.48 | 0.22 | -2.414311 | -0.0247815 | -0.163 | -0.105 | -0.139 | 1.122 | 0.216 | 0.9278 | 0.687 |
| 12298 | m-poor | -1.20 | 0.21 | -2.280899 | 0.0072986 | 0.0364 | 0.3085 | 0.0319 | 1.337 | 0.398 | 1.2265 | 0.554 |
| 12309 | m-poor | -1.28 | 0.07 | -2.207105 | -0.134229 | -0.514 | 0.0884 | -0.509 | 1.351 | 0.371 | 1.2110 | 0.577 |
| 12353 | m-poor | -1.25 | 0.21 | -2.393291 | -0.109288 | -0.585 | -0.158 | -0.591 | 1.114 | 0.215 | 0.9297 | 0.683 |
| 12376 | m-poor | -1.33 | 0.19 | -2.631931 | 0.0029722 | 0.0254 | 0.6556 | 0.0245 | 0.607 | 0.287 | 0.6248 | 0.361 |
| 12403 | m-poor | -1.27 | 0.23 | -2.222161 | -0.0937202 | 6-0.432 | -0.213 | -0.366 | 1.507 | 0.372 | 1.2337 | 0.622 |
| 12415 | m-poor | -1.34 | 0.25 | -2.643120 | 0.0088065 | 0.1049 | -0.486 | 0.0740 | 0.771 | 0.123 | 0.6849 | 0.732 |
| 12502 | m-poor | -1.50 | 0.24 | -6.37487 | -0.200613 | -0.054 | -0.698 | -0.039 | 35.93 | 0.536 | 23.258 | 0.970 |
-
•
All IDs start with the OGLE-BLG-RRLYR identifier. The classification, metallicity, -element abundance, total energy, angular momentum, parallel action, perpendicular action, circularity, apocenter radius, pericenter radius, maximum height, and eccentricity are presented. The complete version, which includes the errors, is only available in electronic form at the CDS via anonymous ftp to cdsarc.u-strasbg.fr (130.79.128.5) or via http://cdsweb.u-strasbg.fr/cgi-bin/qcat?J/A+A/.
6 Chemodynamical analysis
In order to analyze the properties of the RRLs in the dynamical spaces, we divided them into two groups according to their metallicities. Specifically, we define 48 m-poor ([Fe/H]1 dex) and 9 m-rich ([Fe/H]1 dex) stars. All the c-type RRLs fall in the m-poor group.
The left panel of Fig. 12 shows the vs [Fe/H] plane for the RRab stars, separated into m-poor (blue) and m-rich (red), RRc stars are also included in orange. We used different markers (square, cross, star) to identify three m-rich RRLs with . The right panel of Fig. 12, shows the vs plane for the RRL stars. The rosy-brown and green points in this panel are bulge and halo/disk stars selected from Queiroz et al. (2023) based on APOGEE and Gaia DR3 surveys, and incorporated in our orbital code for consistency. The sample consisted of stars in the bulge region with limits at ,, and . In this panel, we identify 3 regions for the m-rich RRL stars. First, at low energy, there are 4 RRab completely inside the bulge potential. The second group at intermediate energy harbors the 3 RRL with . The third region includes two stars with high energy, likely belonging to the halo. The black solid line marks to separate prograde () from retrograde () orbits. Interestingly, m-rich stars are all in the prograde side, while m-poor and RRc stars are more distributed in both prograde and retrograde orbits.
Fig. 13 left panel shows the actions and of the orbits. In this plane, stars with are on nearly circular prograde orbits. Conversely, represents circular retrograde orbits. Stars on radial orbits have while those on polar orbits have . The three m-rich stars with special symbols exhibit more circular prograde orbits compared to the rest of the stars, again indicating a probable relation with the disk. Fig. 13 middle panel shows the circularity vs the maximum height of the orbits. Two of the three m-rich stars with special symbols are located in regions associated with the disk, while the third is in a region of overlap between the disk and the bulge. In contrast, the vast majority of the stars are found in regions related to the bulge. Moreover, there are some stars related to the halo. Fig. 13 right panel shows the pericenter radius vs the eccentricity of the orbits. The three m-rich stars with special symbols show pericenter radius and eccentricity related to the disk. The majority of the stars have small values for the pericenter radius, indicating that they are very attached to the bulge component.
Overall, we observed that not all the RRL stars present the same orbital behavior. There are RRL variables associated with the bulge, disk, and halo, with a vast majority concentrated in the bulge. Furthermore, in the group of the m-rich RRL stars, there are three with orbits that suggest they belong to the disk that also have , indicating that this group, different in abundance and also in kinematics, can have a distinct origin. Hence, increasing the sample of bulge RRL with abundances and kinematics values is essential to confirm the presence of a disk population of RRL stars currently in the bulge region.
7 Discussion and conclusion
We present here the first spectroscopic determination of iron and -element abundances for RRL stars in the Galactic bulge. We analyzed GIRAFFE HR10 spectra for 60 RRab and 18 RRc stars and performed a comprehensive spectral fitting analysis using FERRE. We obtained [Fe/H] and as well as other atmospheric parameters; however, we performed a quality selection to discard values obtained with poor fitting when the absorption lines are almost lost.
The RRab stars have a median metallicity at dex and a dex. In the case of the RRc the values are dex and dex. These values are in agreement with previous results of spectroscopic abundances in RRL stars, with a slightly more m-rich value, as the bulge is more m-rich than the halo. It is important to note that our statistics are not large enough to draw strong conclusions about the mean abundances of iron and -elements in the bulge as a whole.
We compared our results with those of some photometric metallicity methods from the literature. We found that several photometric methods exhibit a significant offset compared to spectroscopic measurements for RRab stars, a phenomenon observed in several studies. The origin of this offset is not completely clear. Furthermore, our data suggest a possible correlation between the metallicity difference and the [/Fe] ratio, which needs to be investigated further.
We investigate the potential existence of multiple populations of RRL in the bulge, as several previous studies have identified m-rich RRL ([Fe/H] ¿ -1 dex) in our Galaxy (Crestani et al., 2021b; Olivares Carvajal et al., 2024; D’Orazi et al., 2024; Gozha et al., 2024; Prudil et al., 2025). According to the standard, single star stellar evolution, RRL variables are m-poor stars with progenitor masses , in the core helium-burning phase (Catelan and Smith, 2015). In order for such stars to have completed their main sequence and red giant phase, they must be as old as 10 Gyr at least. Their metallicity might reach up to solar values if they lose enough mass during the first ascent red giant phase, that is, if their value is higher than normal (see Fig. 4 in D’Cruz et al., 1996). Nonetheless, several recent studies discuss the possibility that some RRL are stars formed in a binary system, with a companion with a mass in the range , such that the companion strips away an important fraction of their envelope. Through this channel, the variable could be an intermediate-age star (Bobrick et al., 2024), which would explain why several RRLs are found in the MW disk (Zinn et al., 2020; Matsunaga et al., 2022).
In a novel approach, the study of Zhang et al. (2025) shows that by means of tagging with Mira stars, there is a statistically significant portion of RRL moving as intermediate-age stars in the Galaxy (the Mira sample). There are also other very new studies showing the possibility of the existence of these stars (Cabrera-Gadea et al., 2024; Cuevas-Otahola et al., 2024), while others are trying to find the binary system candidates to prove the binary channel theory (Abdollahi et al., 2025). One problem for this model is the very low probability of finding an RRL star in a binary system. For instance, Kervella et al. (2019) studied the anomalies in the PMs of almost 790 RRL and found that only 7 stars are probably bound in a binary system, and the fraction of those that are in interacting binaries is significantly lower. No RRL binary system has been discovered to date to confirm this model.
The study of Gozha et al. (2024) also found m-rich RRL in the disk, but they found anomalous levels of other elements, such as sodium, aluminum, and nickel, in comparison with disk stars. They proposed an extragalactic origin for some of the RRLs. In the same way, the study of D’Orazi et al. (2024) that found several m-rich stars, some of which are close to the solar metallicity, also shows that those stars are [/Fe] depleted. They found different abundances for other elements compared to typical disk stars, supporting the idea that disk RRL can be related to the ”primordial disk” as very old fossils of that epoch.
From the kinematics and abundances, we conclude that bulge RRLs can be described as a predominantly old population with a peak in the m-poor regime, but with a wide range of metallicities, which is expected for a complex structure like the bulge. However, there are some m-rich RRL that are distinct in the ratio and with disk kinematics, and could belong to a second ”younger” RRL population. This does not mean that this population is strictly young or intermediate-age. As the work of Prudil et al. (2025) suggests, there is a possibility that these two populations, both very old, may have differences of only 1 or 2 Gyr, which could account for the observed results. For instance, the oldest can be 12 Gyr, while the younger can be 10 Gyr. Therefore, RRL variables are still absolutely old populations.
Future work will focus on increasing the statistics of RRL stars observed spectroscopically in the bulge, with the aim of proving this m-rich, [/Fe] depleted population by observing several other bulge fields. The future near-IR and optical spectroscopic surveys around the bulge, for instance, the 4-meter Multi-Object Spectroscopic Telescope (4MOST, de Jong et al., 2019) and the Multi-Object Optical and Near-infrared Spectrograph (MOONS, Cirasuolo et al., 2020) surveys, will help to improve our conclusions about the chemical origin of these variable stars.
Acknowledgements.
J.O.C acknowledges Marcio Catelan for the very interesting discussions and comments. Also, thanks to Andrea Kunder for her very insightful comments. Moreover, thanks to Massimo Dall’Ora for his help, advices and patience during the first visit to INAF. J.O.C. also acknowledges support from the National Agency for Research and Development (ANID) Doctorado Nacional grant 2021-21210865, and by ESO grant SSDF21/24. This work is funded by ANID, Millennium Science Initiative, ICN12_009 awarded to the Millennium Institute of Astrophysics (M.A.S.), by the ANID BASAL Center for Astrophysics and Associated Technologies (CATA) through grant FB210003, and by FONDECYT Regular grant No. 1230731. A. R. A. acknowledges support from DICYT through grant 062319RA. B.A.T. acknowledges support from ANID Doctorado Nacional grant 2023-21231305. M.D.L. acknowledges financial support from the project “LEGO – Reconstructing the building blocks of the Galaxy by chemical tagging” (PI: Mucciarelli) granted by the Italian MUR through contract PRIN2022LLP8TK_001. We gratefully acknowledge the use of data from the OGLE-IV catalog. The OGLE project has received funding from the National Science Centre, Poland, grant MAESTRO 2014/14/A/ST9/00121 to AU. We also acknowledge the use of data from the VVV/VVVx ESO Public Survey program ID 179.B-2002/198.B-2004 taken with the VISTA telescope and data products from the Cambridge Astronomical Survey Unit (CASU). The VVV Survey data are made public at the ESO Archive. It also made use of NASA’s Astrophysics Data System and of the VizieR catalog access tool, CDS, Strasbourg, France (simbad). The original description of the VizieR service was published in (vizier). Finally, we acknowledge the use of the following publicly available softwares: FERRE (Allende Prieto et al., 2006), lcfit: A python package for the regression of periodic time series (Dekany2019), rr_feh (Dékány and Grebel, 2022), TOPCAT (Taylor, 2005), pandas (pandas), IPython (Pérez and Granger, 2007), numpy (numpy), matplotlib (matplotlib), Astropy, a community developed core Python package for Astronomy (Astropy Collaboration et al., 2013, 2018) and Aladin sky atlas (Bonnarel and others, 2000; aladin2).References
- Search for binary-channel metal-rich RR Lyrae candidates. A&A 695, pp. L14. External Links: Document, 2503.01018, ADS entry Cited by: §7.
- A Spectroscopic Study of the Ancient Milky Way: F- and G-Type Stars in the Third Data Release of the Sloan Digital Sky Survey. ApJ 636 (2), pp. 804–820. External Links: Document, astro-ph/0509812, ADS entry Cited by: §3.1.
- The Astropy Project: Building an Open-science Project and Status of the v2.0 Core Package. AJ 156 (3), pp. 123. External Links: Document, 1801.02634, ADS entry Cited by: §5.
- Astropy: A community Python package for astronomy. A&A 558, pp. A33. External Links: Document, 1307.6212, ADS entry Cited by: §5.
- Stellar Variability and Distance Indicators in the Near-infrared in Nearby Galaxies. I. RR Lyrae and Anomalous Cepheids in Draco Dwarf Spheroidal. AJ 167 (5), pp. 247. External Links: Document, 2404.01394, ADS entry Cited by: §1.
- RR Lyrae and Type II Cepheid Variables in Globular Clusters: Optical and Infrared Properties. Universe 8 (2), pp. 122. External Links: Document, 2202.06982, ADS entry Cited by: §1.
- RR Lyrae from binary evolution: abundant, young, and metal-rich. MNRAS 527 (4), pp. 12196–12218. External Links: Document, 2208.04332, ADS entry Cited by: §7.
- The ALADIN interactive sky atlas. A reference tool for identification of astronomical sources. A&AS 143, pp. 33–40. External Links: Document, ADS entry Cited by: §3.2.
- RR Lyrae stars trace the Milky Way warp. arXiv e-prints, pp. arXiv:2410.22427. External Links: Document, 2410.22427, ADS entry Cited by: §7.
- A new photometric model of the Galactic bar using red clump giants. MNRAS 434 (1), pp. 595–605. External Links: Document, 1303.6430, ADS entry Cited by: §1.
- Intrinsic iron spread and a new metallicity scale for globular clusters. A&A 508 (2), pp. 695–706. External Links: Document, 0910.0675, ADS entry Cited by: §3.3, §4.2.
- Pulsating Stars. External Links: ADS entry Cited by: §7.
- Spectroscopic Comparison of Metal-rich RRab Stars of the Galactic Field with their Metal-poor Counterparts. ApJ 835 (2), pp. 187. External Links: Document, 1611.02368, ADS entry Cited by: §1, §3.3.
- MOONS: The New Multi-Object Spectrograph for the VLT. The Messenger 180, pp. 10–17. External Links: Document, 2009.00628, ADS entry Cited by: §7.
- Gaia Data Release 3. Specific processing and validation of all-sky RR Lyrae and Cepheid stars: The RR Lyrae sample. A&A 674, pp. A18. External Links: Document, 2206.06278, ADS entry Cited by: §1, §2.4, §4.2.
- The VVV Survey RR Lyrae Population in the Galactic Center Region. ApJ 863 (1), pp. 79. External Links: Document, 1807.04303, ADS entry Cited by: §2.2.
- On the Use of Field RR Lyrae as Galactic Probes. III. The -element Abundances. ApJ 914 (1), pp. 10. External Links: Document, 2104.08113, ADS entry Cited by: §1, Figure 8, §3.3, Figure 10, §4.1.
- On the Use of Field RR Lyrae as Galactic Probes. II. A New S Calibration to Estimate Their Metallicity. ApJ 908 (1), pp. 20. External Links: Document, 2012.02284, ADS entry Cited by: §1, §3.3, §3.3, Figure 10, §7.
- Variable stars in galactic globular clusters. I. The population of RR Lyrae stars. A&A 684, pp. A173. External Links: Document, 2402.08843, ADS entry Cited by: §1.
- RR Lyrae Stars in Intermediate-age Magellanic Clusters: Membership Probabilities and Delay Time Distribution. arXiv e-prints, pp. arXiv:2411.12741. External Links: Document, 2411.12741, ADS entry Cited by: §7.
- PyA: Python astronomy-related packages. External Links: 1906.010, ADS entry Cited by: §2.1.
- The Origin of Extreme Horizontal Branch Stars. ApJ 466, pp. 359. External Links: Document, astro-ph/9511017, ADS entry Cited by: §7.
- The GALAH survey: tracing the Milky Way’s formation and evolution through RR Lyrae stars. MNRAS 531 (1), pp. 137–162. External Links: Document, 2405.04580, ADS entry Cited by: Appendix B, §1, §1, Figure 8, §3.3, §4.1, §7, §7.
- 4MOST: Project overview and information for the First Call for Proposals. The Messenger 175, pp. 3–11. External Links: Document, 1903.02464, ADS entry Cited by: §7.
- Globular clusters in ORBIT: Complete dynamical characterisation of the Milky Way globular cluster population through updated orbital reconstruction. A&A 706, pp. A130. External Links: Document, 2512.06079, ADS entry Cited by: Figure 12, Figure 13, §5.
- Photometric Metallicity Prediction of Fundamental-mode RR Lyrae Stars in the Gaia Optical and K s Infrared Wave Bands by Deep Learning. ApJS 261 (2), pp. 33. External Links: Document, ADS entry Cited by: §1, Figure 9, §4.2.
- Kinematics of RR Lyrae stars in the Galactic bulge with OGLE-IV and Gaia DR2. MNRAS 498 (4), pp. 5629–5642. External Links: Document, 2007.01102, ADS entry Cited by: §3.1.
- On the Use of Field RR Lyrae as Galactic Probes. I. The Oosterhoff Dichotomy Based on Fundamental Variables. ApJ 882 (2), pp. 169. External Links: Document, 1908.02064, ADS entry Cited by: §3.3.
- The Chemical Compositions of Variable Field Horizontal-branch Stars: RR Lyrae Stars. ApJS 197 (2), pp. 29. External Links: Document, 1110.0548, ADS entry Cited by: §3.3.
- The Chemical Inhomogeneity of Omega Centauri. ApJ 201, pp. L71. External Links: Document, ADS entry Cited by: §1.
- Gaia Data Release 3. Summary of the content and survey properties. A&A 674, pp. A1. External Links: Document, 2208.00211, ADS entry Cited by: §2.4.
- Galactic-Field Metal-Rich RR Lyrae Variables: Features of Kinematics and Abundances of Selected Chemical Elements. Astrophysical Bulletin 79 (3), pp. 481–493. External Links: Document, 2408.03107, ADS entry Cited by: §7, §7.
- Improved GRAVITY astrometric accuracy from modeling optical aberrations. A&A 647, pp. A59. External Links: Document, 2101.12098, ADS entry Cited by: §2.3, §5.
- A grid of MARCS model atmospheres for late-type stars. I. Methods and general properties. A&A 486 (3), pp. 951–970. External Links: Document, 0805.0554, ADS entry Cited by: §3.1.
- Atomic data for the Gaia-ESO Survey. A&A 645, pp. A106. External Links: Document, 2011.02049, ADS entry Cited by: §3.1.
- An Analytical Model for Spherical Galaxies and Bulges. ApJ 356, pp. 359. External Links: Document, ADS entry Cited by: §5.
- Chemo-kinematics of the Gaia RR Lyrae: the halo and the disc. MNRAS 502 (4), pp. 5686–5710. External Links: Document, 2008.02280, ADS entry Cited by: §1, Figure 10, Figure 9, §4.2.
- Photometric metallicities of fundamental-mode RR Lyr stars from Gaia G band photometry of globular-cluster variables. MNRAS 525 (3), pp. 3486–3498. External Links: Document, 2308.08929, ADS entry Cited by: §1, Figure 10, Figure 9, §4.2.
- Multiplicity of Galactic Cepheids and RR Lyrae stars from Gaia DR2. II. Resolved common proper motion pairs. A&A 623, pp. A117. External Links: Document, 1908.00545, ADS entry Cited by: §7.
- The Bulge Radial Velocity Assay for RR Lyrae Stars (BRAVA-RR) DR2: A Bimodal Bulge?. AJ 159 (6), pp. 270. External Links: Document, 2004.11382, ADS entry Cited by: §2.5.
- The Galactic Bulge Exploration. III. Calcium Triplet Metallicities for RR Lyrae Stars. AJ 168 (3), pp. 139. External Links: Document, 2407.01515, ADS entry Cited by: §1, §4.2.
- The Metallicities and Kinematics of RR Lyrae Variables. I. New Observations of Local Stars. AJ 108, pp. 1016. External Links: Document, ADS entry Cited by: §1.
- A measurement of the distance to the Galactic centre using the kinematics of bar stars. MNRAS 519 (1), pp. 948–960. External Links: Document, 2204.12551, ADS entry Cited by: §2.3.
- Photometric Metallicity and Distance Estimates for 136,000 RR Lyrae Stars from Gaia Data Release 3. ApJ 944 (1), pp. 88. External Links: Document, 2206.07668, ADS entry Cited by: §1, Figure 9, §4.2.
- Analytical Potentials for Barred Galaxies. ApJ 397, pp. 44. External Links: Document, ADS entry Cited by: §5.
- Chemical Compositions of Field and Globular Cluster RR Lyrae Stars. II. Centauri. ApJ 881 (2), pp. 104. External Links: Document, 1906.08550, ADS entry Cited by: Figure 8, §4.1.
- Chemical Compositions of Field and Globular Cluster RR Lyrae Stars. I. NGC 3201. ApJ 864 (1), pp. 57. External Links: Document, 1807.06681, ADS entry Cited by: §1.
- A Very Metal-poor RR Lyrae Star with a Disk Orbit Found in the Solar Neighborhood. ApJ 925 (1), pp. 10. External Links: Document, 2201.05402, ADS entry Cited by: §7.
- The mass distribution and gravitational potential of the Milky Way. MNRAS 465 (1), pp. 76–94. External Links: Document, 1608.00971, ADS entry Cited by: §5.
- VISTA Variables in the Via Lactea (VVV): The public ESO near-IR variability survey of the Milky Way. New A 15 (5), pp. 433–443. External Links: Document, 0912.1056, ADS entry Cited by: §2.2.
- Three-dimensional models for the distribution of mass in galaxies.. PASJ 27, pp. 533–543. External Links: ADS entry Cited by: §5.
- Metallicity of Galactic RR Lyrae from Optical and Infrared Light Curves. II. Period-Fourier-Metallicity Relations for First Overtone RR Lyrae. ApJ 931 (2), pp. 131. External Links: Document, 2204.07627, ADS entry Cited by: Figure 10, §4.2.
- Metallicity of Galactic RR Lyrae from Optical and Infrared Light Curves. I. Period-Fourier-Metallicity Relations for Fundamental-mode RR Lyrae. ApJ 912 (2), pp. 144. External Links: Document, 2103.09372, ADS entry Cited by: §1, Figure 9, §4.2, §4.2.
- Reddening and Extinction toward the Galactic Bulge from OGLE-III: The Inner Milky Way’s RV ~2.5 Extinction Curve. ApJ 769 (2), pp. 88. External Links: Document, 1208.1263, ADS entry Cited by: §2.3.
- The Structure of Cold Dark Matter Halos. ApJ 462, pp. 563. External Links: Document, astro-ph/9508025, ADS entry Cited by: §5.
- Standard Galactic field RR Lyrae II: a Gaia DR2 calibration of the period-Wesenheit-metallicity relation. MNRAS 490 (3), pp. 4254–4270. External Links: Document, 1910.01773, ADS entry Cited by: §1.
- Comparing bulge RR Lyrae stars with bulge giants: Insight from 3D kinematics. A&A 687, pp. A312. External Links: Document, 2405.08990, ADS entry Cited by: §1, §5, §7.
- Chemical abundances of solar neighbourhood RR Lyrae stars. MNRAS 447 (3), pp. 2404–2419. External Links: Document, 1412.4580, ADS entry Cited by: Appendix B, §1, Figure 8, §3.1, §3.2, §3.3.
- Installation and commissioning of FLAMES, the VLT Multifibre Facility. The Messenger 110, pp. 1–9. External Links: ADS entry Cited by: §2.1.
- IPython: a system for interactive scientific computing. Computing in Science and Engineering 9 (3), pp. 21–29. External Links: Link, ISSN 1521-9615, Document Cited by: §2.1.
- Turbospectrum: Code for spectral synthesis Note: Astrophysics Source Code Library, record ascl:1205.004 External Links: ADS entry Cited by: §3.1.
- Dynamical modelling of the galactic bulge and bar: the Milky Way’s pattern speed, stellar and dark matter mass distribution. MNRAS 465 (2), pp. 1621–1644. External Links: Document, 1608.07954, ADS entry Cited by: §1.
- A Spectroscopic Study of the RR Lyrae Stars.. ApJ 130, pp. 507. External Links: Document, ADS entry Cited by: §1.
- The Galactic bulge exploration: IV. RR Lyrae stars as tracers of the Galactic bar: 3D and 5D analysis and extinction variation. A&A 695, pp. A211. External Links: Document, 2501.03497, ADS entry Cited by: §2.3, §2.3, §2.3, §2.5, §3.1, §3.3, §7, §7.
- The Galactic bulge exploration. I. The period-absolute magnitude-metallicity relations for RR Lyrae stars for GBP, V, G, GRP, I, J, H, and Ks passbands using Gaia DR3 parallaxes. A&A 684, pp. A176. External Links: Document, 2310.19438, ADS entry Cited by: §1, §2.3.
- The Galactic bulge exploration. II. Line-of-sight velocity templates for single-mode RR Lyrae stars. A&A 685, pp. A153. External Links: Document, 2404.05279, ADS entry Cited by: §2.5.
- StarHorse results for spectroscopic surveys and Gaia DR3: Chrono-chemical populations in the solar vicinity, the genuine thick disk, and young alpha-rich stars. A&A 673, pp. A155. External Links: Document, 2303.09926, ADS entry Cited by: Figure 12, Figure 13, §6.
- Mapping the Interstellar Reddening and Extinction toward Baade’s Window Using Minimum Light Colors of ab-type RR Lyrae Stars: Revelations from the De-reddened Color-Magnitude Diagrams. ApJ 874 (1), pp. 30. External Links: Document, 1902.05637, ADS entry Cited by: §2.3.
- The age of the Milky Way inner stellar spheroid from RR Lyrae population synthesis. A&A 641, pp. A96. External Links: Document, 2006.12507, ADS entry Cited by: §3.3.
- Local kinematics and the local standard of rest. MNRAS 403 (4), pp. 1829–1833. External Links: Document, 0912.3693, ADS entry Cited by: §5.
- All Sky Automated Survey for SuperNovae (ASAS-SN or “Assassin”). In American Astronomical Society Meeting Abstracts #223, American Astronomical Society Meeting Abstracts, Vol. 223, pp. 236.03. External Links: ADS entry Cited by: §4.2.
- A parametric description of the 3D structure of the Galactic bar/bulge using the VVV survey. MNRAS 471 (4), pp. 4323–4344. External Links: Document, 1707.06660, ADS entry Cited by: §1.
- OGLE-ing the Magellanic System: Photometric Metallicity from Fundamental Mode RR Lyrae Stars. Acta Astron. 66 (3), pp. 269–292. External Links: Document, 1608.00013, ADS entry Cited by: §4.2.
- The RRc Stars: Chemical Abundances and Envelope Kinematics. ApJ 848 (1), pp. 68. External Links: Document, 1709.00494, ADS entry Cited by: §1, §3.3.
- The Optical Gravitational Lensing Experiment. The OGLE-III Catalog of Variable Stars. XI. RR Lyrae Stars in the Galactic Bulge. Acta Astron. 61 (1), pp. 1–23. External Links: 1105.6126, ADS entry Cited by: §2.1.
- Over 78 000 RR Lyrae Stars in the Galactic Bulge and Disk from the OGLE Survey. Acta Astron. 69 (4), pp. 321–337. External Links: Document, 2001.00025, ADS entry Cited by: §1.
- Metal Abundances of RR Lyrae Variables in Selected Galactic Star Fields. V. The Lick Astrographic Fields at Intermediate Galactic Latitudes. ApJ 367, pp. 528. External Links: Document, ADS entry Cited by: §1.
- TOPCAT & STIL: Starlink Table/VOTable Processing Software. In Astronomical Data Analysis Software and Systems XIV, P. Shopbell, M. Britton, and R. Ebert (Eds.), Astronomical Society of the Pacific Conference Series, Vol. 347, pp. 29. External Links: ADS entry Cited by: §2.4.
- OGLE-IV: Fourth Phase of the Optical Gravitational Lensing Experiment. Acta Astron. 65 (1), pp. 1–38. External Links: Document, 1504.05966, ADS entry Cited by: §2.2.
- Stellar density profile and mass of the Milky Way bulge from VVV data. A&A 587, pp. L6. External Links: Document, 1510.07425, ADS entry Cited by: §1.
- The Metallicity of RR Lyrae Stars in Baade’s Window. ApJ 378, pp. 119. External Links: Document, ADS entry Cited by: §1, §1, §3.3.
- New Near-infrared Period-Luminosity-Metallicity Relations for Galactic RR Lyrae Stars Based on Gaia EDR3 Parallaxes. ApJ 951 (2), pp. 114. External Links: Document, 2305.09414, ADS entry Cited by: §1.
- Revealing the ages of metal-rich RR Lyrae via kinematic label transfer. arXiv e-prints, pp. arXiv:2504.06720. External Links: Document, 2504.06720, ADS entry Cited by: §7.
- Local RR Lyrae stars: native and alien. MNRAS 492 (2), pp. 2161–2176. External Links: Document, 1912.07686, ADS entry Cited by: §7.
- VVV catalog of ab-type RR Lyrae in the inner Galactic bulge. A&A 689, pp. A240. External Links: Document, 2407.11226, ADS entry Cited by: §1.
Appendix A Atmospheric parameters for RRc stars
We show here the variation of the atmospheric parameters for two RRc variables, with different SNR (Fig. 14). The plot show, although the surface parameters show non negligible changes among different pulsation phases, as expected, the derived and /Fe] stay consistent, with relatively little spread. This makes us confident that the abundances discussed here are robust.

Appendix B Errors of the atmospheric parameters for an RRL star with FERRE
We provide the corner plot showing the correlation between each pair of surface parameters (Fig. 15). These were obtained by perturbing each spectrum, assuming a Poisson error on its flux.
Fig. 15 shows an example of a spectrum with good SNR () and in a good phase of observation (). All atmospheric parameters follow normal distributions, and there are also some correlations between pairs of parameters. For example, for vs , vs , and vs . All these relations have been previously observed in other studies (Pancino et al. 2015; D’Orazi et al. 2024). More importantly, the magnitude of the errors in each independent variable is sufficiently small to ensure the validity of our results. Furthermore, for , we did not observe any relation with other parameters, and the error is even smaller than for metallicity, confirming the reliability of our results.
The results for iron and -element abundances are also based on the correlations present in and the dispersion in . Adding these two extra parameters helped in reducing the uncertainties in the abundances of our interest in this work.
Another important observation is that the shapes of the correlations do not change with phase. Thus, in good conditions (good SNR and phase) the errors are small, hence the abundances are reliable.