Sub-picosecond inter-core skew characterization in multicore fibers via Hong–Ou–Mandel interference
††journal: opticajournal††articletype: Research ArticleInter-core skew (ICS), the differential group delay between cores of a multicore fiber (MCF), is a critical parameter for both classical space-division multiplexed communications and quantum photonic networks. We present a high-precision measurement of ICS in a commercially available four-core fiber using two-photon Hong–Ou–Mandel (HOM) interference in a fiber-integrated multiport beam splitter. By extracting the center position of HOM interference dips and peaks across all twelve core-pair combinations, we obtain individual ICS values with a demonstrated precision of ps, limited by the delay-stage positioning uncertainty. The root-mean-square ICS grows as with and ps, over fiber lengths from m to m. This first direct validation of the stochastic random-walk scaling across a length range spanning laboratory to field-deployed scales was made possible by HOM’s immunity to first-order path fluctuations, which renders classical interferometric methods impractical for long installed fibers. The demonstrated ps precision represents a -fold improvement over correlation optical time-domain reflectometry (C-OTDR), the standard method for long-fiber ICS characterization. Fisher information analysis establishes a fundamental Cramér–Rao precision limit in the femtosecond range, indicating further improvement is achievable with better delay control. These results establish a practical platform for characterising timing uniformity in MCF-based networks for both quantum and classical space-division multiplexed applications.
1 Introduction
Multicore fibers (MCFs) have emerged as a key enabling technology for next-generation optical communication and quantum networking, offering a scalable route to increased capacity through space-division multiplexing (SDM) while distributing quantum states across spatially distinct channels within a single cladding [1, 2]. In the classical domain, MCFs support petabit-class SDM transmission [3], joint-core coherent detection, and radio-over-fiber applications demanding precise timing synchronization across cores [1, 4, 5]. MCF deployment has progressed to practical submarine systems, including a 4-core submarine-cable prototype with integrated multicore amplification [6], a deployed 7-core link carrying 410.5 Tbit/s over 140 km [7], and recent work on key implementation building blocks [8]. In the quantum domain, the common cladding provides intrinsic phase stability for high-dimensional entanglement distribution [9, 10], parallel quantum channels [11, 12], and fiber-integrated multiport beam splitters [13, 14]. Core-to-core noise correlations have also been exploited to achieve sub-femtosecond path stabilization for quantum networking at 100% duty cycle [15].
A critical parameter limiting performance in all these applications is inter-core skew (ICS), the differential group delay between signals co-propagating in different cores, arising from core-to-core variations in effective refractive index, stress-induced birefringence, and environmental perturbations. In SDM transmission, ICS forces digital signal processing buffer sizes to scale with accumulated skew, degrading joint-core carrier-phase estimation [4] and causing cascaded penalties in multi-span links [5]. In quantum protocols relying on interference of broadband photons, including QKD and entanglement swapping, ICS can be a critical decoherence source. ICS does not accumulate deterministically: Lee et al. showed that azimuth-rotated splice attempts to cancel ICS are unsuccessful [16], confirming that ICS is dominated by stochastic, spatially-varying fluctuations and must be measured, not engineered away. Existing classical techniques such as C-OTDR [17, 18] and white-light interferometry [19, 16] achieve resolutions of only –ps—adequate for nanosecond-scale skew in long fibers but far short of the sub-picosecond precision required for quantum applications and short integrated-photonic segments.
Here we demonstrate that two-photon Hong-Ou-Mandel interference [20] in a fiber-integrated multiport beam splitter provides ICS measurement with a demonstrated precision of ps and a fundamental Cramér–Rao precision limit in the femtosecond range. We use photon pairs from spontaneous parametric down-conversion (SPDC) through a commercial four-core fiber (Fibercore SM-4C1500(8.0/125)/001) and a fiber-integrated MCF beam splitter [14]. The position of each HOM dip or peak directly encodes the differential group delay between a core pair; Gaussian fits across all twelve input combinations yield the complete ICS profile, and the root-mean-square skew over lengths from m to m provides the first direct multi-length validation of the expected scaling. HOM interferometry requires no phase stabilization—the coincidence dip depends only on the second-order temporal envelope, immune to first-order path fluctuations [21]—making it robust for measurements through long installed fibers where classical interferometric methods would require active stabilization [22, 23]. It is precisely this phase-insensitivity that enabled the multi-length scaling demonstration reported here: perturbation-sensitive classical methods are impractical for long installed fibers, and prior ICS measurements have not fitted the dependence across a range of fiber lengths [24].
2 Inter-core skew: physical origin, scaling, and statistical characterization
Inter-core skew (ICS), also referred to as differential group delay (DGD) between cores, quantifies the temporal delay difference between optical signals propagating through different cores of an MCF [24], as illustrated in Fig. 1. ICS originates from core-to-core variations in group velocity arising from small structural or refractive index differences between cores, stress-induced birefringence, and environmental perturbations such as bending or temperature fluctuations [25].

A signal propagating through core of an MCF of length accumulates an absolute group delay where is the group refractive index of core , and is the speed of light in vacuum. The ICS between cores and is the difference of these absolute delays,
| (1) |
Note that ; throughout this paper we report the magnitude .
A purely deterministic refractive-index mismatch would produce an ICS scaling linearly with . Experiments consistently show that this simple scaling is not observed [16]. Rather, ICS is dominated by stochastic, spatially-varying imperfections that produce local positive and negative contributions to the differential delay. Lee et al. [16] found that splicing rotations designed to cancel ICS were unsuccessful, providing direct evidence of the random character of ICS accumulation.
This behavior can be modeled by treating each absolute delay as a one-dimensional zero-mean random walk along the fiber. The pairwise difference is then itself a zero-mean random walk whose RMS grows as
| (2) |
with the intrinsic ICS coefficient of the fiber (units: ). This square-root scaling is formally analogous to the random-walk model of polarization mode dispersion (PMD) in single-mode fibers [26, 27, 25], and is consistent with ICS measurements reported in homogeneous MCFs [24], though a direct multi-length fit to the scaling law had not previously been demonstrated.
To go from pairwise delays to the RMS ICS, we use the fact that a four-core fiber there are unordered core pairs. For each pair we perform measurements with both input orderings, yielding two delay-stage positions and (12 ordered measurements in total). Taking the half-difference (Eq. 6) cancels the common arm imbalance (see below) and gives the 6 unsigned ICS magnitudes , one per unordered pair. Their RMS,
| (3) |
characterizes the spread of delays across the core ensemble at length . The measured RMS also includes a fixed, length-independent contribution from single-mode fiber pigtails and fan-in/fan-out connectors at the interferometer inputs. We therefore fit
| (4) |
where is a length-independent offset and provides an intrinsic, setup-independent measure of fiber-induced ICS.
To extract the ICS estimate, we must cancel out the offsets due to arm-length differences. Let the two SMF interferometer input arms have fixed delays and arising from different SMF pigtail lengths, and define the arm imbalance . Let the delay stage position be (in arm I). For input pair , the HOM dip appears at delay position satisfying
| (5) |
giving . Swapping inputs gives . Taking the half-difference eliminates :
| (6) |
This is the ICS extracted for each of the 6 unordered core pairs using both input orderings. The sum provides a consistency check on the arm imbalance.
3 Multiport HOM interference in a beam splitter
In the HOM experiment we use a multiport beam splitter, which implements a unitary transformation well-described by a normalized real Hadamard matrix [14]. The input photon creation operators transform to output operators , where the .
For two photons in input modes and with relative delay , the coincidence probability between output ports and is
| (7) |
where is the effective channel visibility and is the Gaussian envelope set by the photon coherence time . The sign of is determined by the relative signs of the Hadamard matrix elements for ports and : channels for which and share the same sign give destructive interference (bunching dip, ); opposite signs give constructive interference (anti-bunching peak, ). For a Fock-state input the ideal visibility magnitude is for both types.
In the presence of ICS, a differential group delay between the two input cores shifts the HOM feature center by exactly along the delay axis without altering its shape or width. ICS therefore extracted from the position of the dip or peak, making the method somewhat insensitive to loss imbalance, spectral distinguishability, or multi-photon noise, which affect visibility but not center position. Performing HOM measurements for all 12 input core-pair combinations yields the complete differential delay profile of the fiber.
4 Precision limits
In this experiment is unknown and can be much larger than the dip width , so the measurement is performed by scanning the delay stage and locating the dip center by Gaussian fitting. The precision limit of center estimation for a Gaussian profile is set by the Cramér–Rao bound (CRB) [28]. For binary coincidence trials, the Fisher information is
| (8) |
Since the delay is located by accumulating data over different delay positions, the total Fisher information is obtained through the integral , which holds since the scan range and the step size is much smaller than [28, 29]. Substituting the Gaussian dip model Eq. (7), the scan CRB for locating the dip center with total coincidence counts is [28]
| (9) |
where is the effective count density within one dip width and is a dimensionless shape factor. Narrower dips (broader photon spectrum) improve precision by reducing , and , so higher visibility monotonically improves precision. For the SPDC measurements reported here, the scan range is ps and coincidence counts per scan range from to , giving effective count densities to . Summing over all six output pairs with and ps, the per-channel Cramér–Rao bound ranges from to fs. The conservative precision estimate of ps reported below is thus about two orders of magnitude above the fundamental quantum limit, which could be approached with more precise delay control. We note that the demonstrated ps precision is more than adequate for the random-walk scaling measurement reported in Section 6; the Fisher information analysis motivates future experiments targeting the femtosecond regime.
5 Experimental implementation

5.1 Photon-pair source and interferometer
The experimental setup is shown in Fig. 2. Photon pairs were generated via type-II SPDC in a periodically poled KTiOPO4 (PPKTP) crystal pumped by a mode-locked laser at nm with repetition rate MHz and mW average power. Degenerate photon pairs centered at nm were separated by a polarizing beam splitter (PBS) and spectrally filtered by a nm interference filter (IF) before coupling into single-mode fibers (SMFs).
The photons were routed through a modified Mach–Zehnder interferometer (TPI) with a variable free-space delay line providing up to mm path difference (ps). Both photons were injected into the MCF of length via the MUX, and then sent to interfere in the MCF-BS. To study ICS as a function of length, the measurement was repeated for six separate fiber segments ( and m); each segment is an independently handled cut of Fibercore SM-4C1500(8.0/125)/001 four-core fiber [30] with a square core arrangement, nominal core spacing, cladding diameter, and mode field diameter of – at nm (single-mode operating window –nm). Inter-core crosstalk during propagation is negligible, so that mode mixing occurs only in the engineered beam-splitter coupling region.
The multiport beam splitter is a MCF-BS implementing the unitary Hadamard transformation via evanescent coupling between the four cores over a finite interaction length, as described and characterized in Refs. [14, 31]. Input and output cores are interfaced via fiber-optic MUX and DEMUX fan-in/fan-out devices, as shown in Fig. 2.
The four output modes were detected by superconducting nanowire single-photon detectors (SNSPDs). Coincidence events were registered by an FPGA counting system. For the pulsed SPDC source, accidental coincidences accumulate at the rate , where and are the single-channel detection rates. Accidentals have been subtracted from all SPDC data.
The ps delay range sets a practical upper bound on observable ICS: core pairs whose differential delays exceed this limit will not show an HOM feature within the scan. This explains the progressive reduction in visible dip/peak combinations at longer fiber lengths (Section 6). The delay line was extended to cm (ps) to enable measurements at the longer installed fiber lengths at the cost of increased losses; results are reported in Section 6.
5.2 Bimodal pulsed laser source for long installed fibers
For the field-installed m fiber segment, ICS is still measured via HOM two-photon interference, but using a pulsed laser source in place of SPDC. This substitution is necessary because the SPDC source becomes impractical at this length due to channel losses, which are large and dominated not by fiber propagation but by MCF-to-MCF connectors and splices. The bulk of the dB of channel loss arises from butt-coupled MCF connectors (individual insertion loss –dB, requiring manual rotational alignment of the square core pattern before each connection), fusion splices, and the DEMUX fan-out. For SPDC, both photons must survive their respective arms independently, so a per-arm loss of dB reduces coincidence rates by a factor of , making measurements impractical.
The setup is shown schematically in Fig. 2(b). A single ps telecom laser pulse is split at the SMF coupler into two arms; both arms traverse the MCF under test (one per core), accumulate the inter-core delay , and recombine at a second SMF coupler acting as the HOM beam splitter. The two outputs are detected by InGaAs SPADs triggered by the function generator driving the laser at MHz.
The laser has a multi-mode longitudinal mode structure visible as a sinusoidal beating of the fast single count oscillations along the delay axis. The beat period is ps, corresponding to a mode spacing GHz (nm at nm).
Two-photon decomposition and the 50% visibility ceiling. The physics of this measurement is most clearly understood by considering the two-photon component of the coherent pulse, which dominates the coincidence signal. When a two-photon pulse is split at the input coupler, two outcomes are equally likely: (i) one photon takes each arm (probability ), leading to standard HOM interference at the output coupler; (ii) both photons take the same arm (probability ), forming a or state that produces N00N-state interference at the output coupler with fringe period nm in path length. The coincidence probability is a combination of both contributions: The N00N fringes oscillate at period nm, sensitive to sub-wavelength optical path fluctuations. Ambient thermal and mechanical drifts during the s integration at each delay point cause path-length excursions of several micrometers, sweeping through multiple fringe cycles and averaging the N00N contribution to its mean: . The HOM envelope width m is four orders of magnitude larger than , so the same drift is entirely negligible for the HOM term. The measured coincidence rate therefore becomes
| (10) |
where is the HOM envelope (Gaussian modulated by the bimodal beats). The maximum visibility is therefore , and is unchanged by the bimodal spectrum. The bimodal beats enter through :
| (11) |
where ps for a transform-limited ps pulse. The ICS between a core pair shifts the entire pattern by . In practice, a coarse delay scan is first performed to identify the beat period at which fringe visibility is maximum, locating to within . A fine-step scan is then performed over a single beat period centered on this maximum, and a fit to the envelope of Eq. (11) extracts the fringe-center position, giving with an effective precision ps, far below the ps pulse width.
The laser power is adjusted so that link attenuation reduces the mean photon number to photons/pulse per arm at the detectors, the regime where the two-photon decomposition above applies. This corresponds to cps per detector and cps, regardless of which link is under test. We note that here the same connector losses that render SPDC impractical thus serve as a natural attenuator. Dark-count accidentals (cps) were negligible.
We therefore present two complementary measurement regimes: (A) short laboratory fibers (–m) using SPDC photon pairs and (B) long field-deployed fibers (m) using the pulsed laser.
6 Results and discussion
6.1 Multiport HOM interference, visibilities, and dip-center extraction
As an example of the extracted data using HOM interference of SPDC photon pairs, Fig. 3(a) shows coincidence rates for a m MCF segment and one input core-pair combination () as a function of relative delay . The coincidence curves display the characteristic multiport HOM landscape: four output pairs (AC, AD, BC, BD) show bunching dips and two pairs (AB, CD) show anti-bunching peaks, in quantitative agreement with the predictions for the Hadamard transformation described in Section 3. The dip-center positions are extracted by fitting each coincidence curve to a Gaussian,
| (12) |
where gives the dip-center delay, is the width, is the amplitude, and is the baseline. The visibility is , and the center position is insensitive to visibility degradation from loss or spectral effects.


| Channel | Type | Visibility | (ps) | (ps) |
|---|---|---|---|---|
| AB | peak | |||
| AC | dip | |||
| AD | dip | |||
| BC | dip | |||
| BD | dip | |||
| CD | peak | |||
| Mean |
The fit data is shown in Table 1. The visibilities range from to near , with a mean of after accidental subtraction, close to the ideal expected for a Fock-state input. Deviations from ideal arise from residual photon distinguishability, fan-in/fan-out asymmetries, and imperfect beam-splitter split ratios. The mean coherence time ps confirms the expected value from the nm spectral filter. Gaussian fits of all six output channels yield consistent dip-center positions (ps), as expected since the dip position depends only on the input core pair (Table 1).
We now quantify the uncertainty on these extracted values. The ps fit precision is the purely statistical uncertainty from averaging over six output channels. The dominant contribution to the dip-position uncertainty is the delay-stage positioning uncertainty ps, taken as a conservative upper bound from the manufacturer-specified delay stability of the General Photonics VDL-002 delay line. These two contributions combine as ps for each dip position, as listed in Table 2. Since the ICS is extracted via the half-difference of two independent readings (Eq. 6), the propagated uncertainty on each is ps. The demonstrated precision of ps is thus a consequence of the delay stage rather than photon statistics, and could be substantially improved toward the femtosecond CRB with interferometrically calibrated delay control.
| Input pair | (ps), m | (ps), m |
|---|---|---|
| 1–2 | ||
| 1–3 | ||
| 1–4 | ||
| 2–1 | ||
| 2–3 | ||
| 2–4 | ||
| 3–1 | ||
| 3–2 | ||
| 3–4 | ||
| 4–1 | ||
| 4–2 | ||
| 4–3 |
The extracted dip positions for all 12 input combinations for fibers with m and m are listed in Table 2. Each pair is measured in both input orderings; the half-difference (Eq. 6) yields the ICS , given in Table 3, along with propagated uncertainties and RMS values. The RMS ICS increases from ps at m to ps at m, reflecting the cumulative accumulation of inter-core skew with propagation length.
| Pair - | (ps), m | (ps), m |
|---|---|---|
| 1–2 | ||
| 1–3 | ||
| 1–4 | ||
| 2–3 | ||
| 2–4 | ||
| 3–4 | ||
| RMS |
6.2 Random-walk scaling of ICS with fiber length
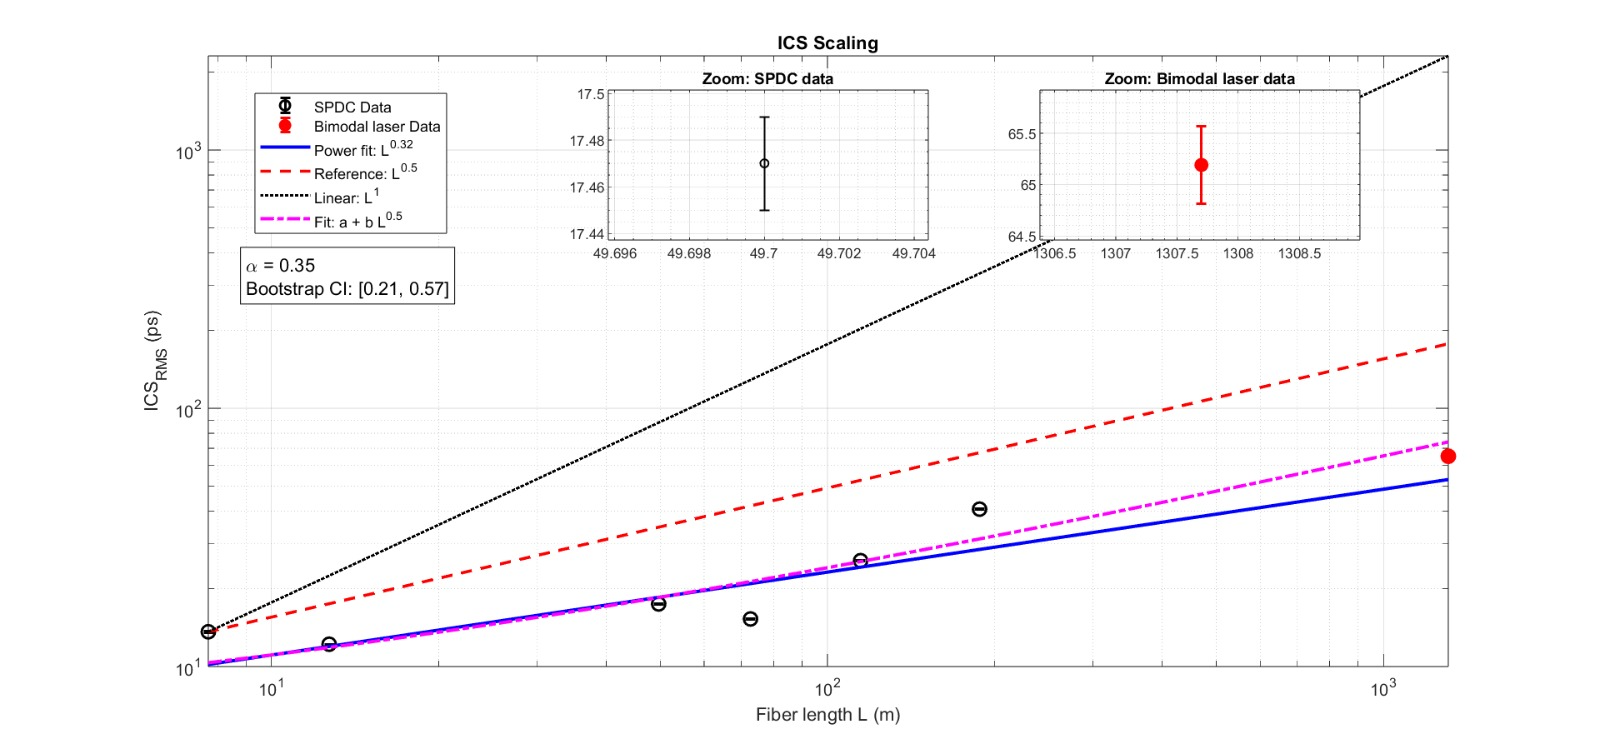
Figure 4 shows the RMS ICS as a function of for fiber lengths 7.7, 12.7, 49.7, 72.7, 114.7, 187.7 m measured with SPDC (regime A, Section 5.2). At longer lengths, some core-pair combinations no longer exhibit HOM features within the original delay scan range (ps): 10 of 12 input pairs were observable at m, 7 at m, and only 1 on an installed m fiber (not shown). This is a direct consequence of ICS exceeding the TPI delay-line range and is consistent with the scaling. To access these longer lengths it was necessary to extend the free-space delay line, adding approximately dB of coupling loss per photon and providing a further practical motivation for the pulsed-laser approach, which was used to test a field-deployed m fiber (red data point). The shortest point at m corresponds to the MCF fiber contained within the MUX fan-in and MCF-BS devices. The data follow the Eq. (4), confirming the stochastic random-walk model. A weighted linear fit gives
The value is larger than typical PMD coefficients for single-mode fiber (–), confirming that the measured effect is genuine inter-core differential group delay rather than a polarization-related artifact. Expressed as a skew per unit length, corresponds to at km, consistent with reported ICS values of – for other four-core and seven-core fiber designs [32, 17]. The length-independent intercept ps is attributed to step-function ICS offsets at each butt-coupled MCF connector junction, where independently manufactured fiber sections present a fixed, random differential group-index mismatch.
While scaling is expected for purely stochastic accumulation, finite sample size or correlated perturbations may cause deviations, so we also fit a general power-law model (Eq. 13), which reduces to the stochastic model for and to deterministic linear scaling for . A weighted log-log regression (Appendix A) yields a point estimate , which should be interpreted with care: the power-law model contains no intercept, so when the true behaviour includes a physical offset (as here), the exponent is biased below its true value. This is precisely why the constrained fit is visually superior despite having the same number of free parameters. The data are well described by both models, with the power-law fit yielding a higher goodness of fit () compared to the model (). A bootstrap resampling analysis () gives a 95% confidence interval that includes the theoretical . Thus, the null hypothesis of standard scaling cannot be rejected at the 95% level.
6.3 Comparison with classical ICS measurement methods
Table 4 contextualizes our results within the existing literature on ICS characterization. The key comparison is in precision: C-OTDR achieves ps resolution after Gaussian fitting of the correlation peak [17], while our HOM method achieves ps from dip-center fitting, a factor of improvement in demonstrated precision. The fundamental CRB for the measurements reported here (per-channel values of –fs; Section 4) is more than four orders of magnitude below the demonstrated precision, indicating that substantially greater precision is in principle achievable with an improved delay calibration.
| Method | Cores | Skew | Precision | Ref. | |
|---|---|---|---|---|---|
| C-OTDR | 7 | 10 km | 0.18 ns/km | ps | [17] |
| C-OTDR | 7 | 1 km | 1.2 ns/km | ps | [17] |
| C-OTDR | 19 | 5 km | 0.66 ns/km | ps | [17] |
| C-OTDR | 19 | 25 km | 1.2 ns/km | ps | [17] |
| MPSa | 19 | 5 km | ps (drift) | ns | [17] |
| WLI | 4 | short | —b | sub-ps | [19] |
| WLI+spliceb | 4 | — | —b | sub-ps | [16] |
| Cross-corr.c | 7 | 53.7 km | ns/km | sub-ps | [24] |
| Temp. OTDR | 19 | — | ps/40 K | ps | [33] |
| HOM/SPDC | 4 | 7.7–187.7 m | ps/ | ps; CRB fs | here |
| HOM/lasere | 4 | 1.3 km | 0.049 ns/km (mean) | 0.70 ps | here |
aMPS: modulation phase shift. Only one core can be measured at a
time, so consecutive measurements are separated by thermal drift of
several hundred ps, preventing reliable differential skew
characterisation.
bWLI references characterize skew at fixed lengths or demonstrate
stochastic accumulation qualitatively; neither nor absolute
skew magnitudes were reported.
cCross-correlation of 10 Gb/s OOK waveforms [24].
Skew entry is the maximum observed (between the most
disparate core pair); the mean over cores relative to the centre core
is ps/km for homogeneous MCFs. Precision applies to
dynamic skew tracking; static absolute delays are determined to
ns-level accuracy.
dRotated-splice compensation fails, confirming that ICS
accumulation is stochastic [16].
eHOM/laser skew is the mean averaged over all
six unordered core pairs at m, the metric most directly
comparable to literature average-skew figures.
Fiber: Fibercore SM-4C1500(8.0/125)/001 for this work.
7 Conclusion
We have demonstrated sub-picosecond measurement of inter-core skew (differential group delay) in a commercially available four-core multicore fiber (Fibercore SM-4C1500) using Hong–Ou–Mandel two-photon interference in a fiber-integrated multiport beam splitter. ICS is extracted from HOM dip and peak center positions across all twelve input core-pair combinations, with a demonstrated precision of ps per measurement, limited by the delay-stage positioning uncertainty, and a fundamental Cramér–Rao bound in the femtosecond range that could be approached with improved delay control.
The RMS ICS grows as ps over lengths from m to m, providing the first direct validation of the stochastic random-walk scaling of ICS in a four-core fiber across a length range inaccessible to classical methods. Extension of the scaling curve to m using the bimodal pulsed laser source is consistent with the model, though a generalised power-law fit cannot conclusively rule out sub-diffusive scaling with the current dataset.
For classical SDM transmission, the demonstrated precision far exceeds digital signal processing buffer requirements, enabling per-span ICS monitoring compatible with deployed telecom infrastructure at nm. For quantum networks, the ability to characterize ICS with sub-picosecond resolution enables compensation of timing mismatch before it degrades photon interference in MCF-based links, and the complementary pulsed-laser regime extends this capability to field-deployed fibers with high channel loss. The Fisher information framework established here provides a systematic basis for optimizing photon bandwidth, scan parameters, and delay calibration to approach the CRB in future experiments.
Appendix A Statistical Inference for the ICS Scaling Exponent
The RMS ICS data are fitted to the general power-law model
| (13) |
introduced in the results section. The exponent and its uncertainty are estimated by weighted least squares in log space, with weights where are the propagated log-space uncertainties; length points with fewer accessible core-pair combinations are additionally down-weighted. Robustness is assessed by non-parametric bootstrap resampling ( datasets with replacement); the 95% confidence interval is obtained by the percentile method. Full details follow standard practice [29].
Funding This research was funded by Fondo Nacional de Desarrollo Científico y Tecnológico (FONDECYT) Regular (Grant Nos. 1240746, 1231940, 1260111, 1240843), ANID – Millennium Science Initiative Program – ICN17–012, and ANID Anillo Project ATE250003. LLT was also suported by project UCO 1866. LMF was supported by Conselho Nacional de Desenvolvimento Científico e Tecnológico (CNPq - DOI 501100003593). MN was supported by ANID BECAS/Magister Nacional 2021-22211554, Government of Spain (Severo Ochoa CEX2019-000910-S, FUNQIP and NextGeneration EU PRTR-C17.I1) and European Union’s Horizon Europe research and innovation programme under the MSCA Grant Agreement No. 101081441. SG was supported by FONDECYT Grant No. 3210359.
Acknowledgments The authors thank P.H. Souto Ribeiro for useful conversations.
Disclosures The authors declare no conflicts of interest.
Data availability Data underlying the results presented in this paper are not publicly available at this time but may be obtained from the authors upon reasonable request.
References
- [1] D. J. Richardson, J. M. Fini, and L. E. Nelson, “Space-division multiplexing in optical fibres,” \JournalTitleNature Photonics 7, 354–362 (2013).
- [2] K. Saitoh and S. Matsuo, “Multicore fiber technology,” \JournalTitleJournal of Lightwave Technology 34, 55–66 (2016).
- [3] R. S. Luis, M. v. d. Hout, S. Gaiani, et al., “1 02 petabit/s transmission over 1,808.1 km in a 19-core randomly-coupled multicore fiber,” in Optical Fiber Communication Conference (OFC) Postdeadline Papers 2025, (Optica Publishing Group, 2025), p. Th4A.1.
- [4] A. F. Alfredsson, E. Agrell, M. Karlsson, and H. Wymeersch, “On the performance of joint-core carrier-phase estimation in the presence of intercore skew,” \JournalTitleJournal of Lightwave Technology 37, 5291–5298 (2019).
- [5] J. Cai, D. Hu, W. Wang, et al., “On the impact of inter-core skew on multiple-span coupled-core MCF transmissions,” in 2024 Asia Communications and Photonics Conference (ACP) and International Conference on Information Photonics and Optical Communications (IPOC), (IEEE, 2024), pp. 1–4.
- [6] H. Takeshita, K. Nakamura, Y. Matsuo, et al., “Demonstration of uncoupled 4-core multicore fiber in submarine cable prototype with integrated multicore edfa,” \JournalTitleJournal of Lightwave Technology 41, 980–988 (2023).
- [7] Y. Chen, J. Zhou, Y. Wu, et al., “High-capacity optical communication relayed by multi-core amplifier on deployed submarine seven-core fiber cable,” \JournalTitleCommunications Engineering (2026).
- [8] T. Nakanishi, T. Hayashi, S. Mouri, and T. Hasegawa, “Advancements in key technological building blocks for enabling mcf implementation,” in Optical Fiber Communication Conference (OFC) 2024, (Optica Publishing Group, 2024), p. W4J.1.
- [9] E. Gómez, S. Gómez, I. Machuca, et al., “Multidimensional entanglement generation with multicore optical fibers,” \JournalTitlePhys. Rev. Appl. 15, 034024 (2021).
- [10] E. A. Ortega, K. Dovzhik, J. Fuenzalida, et al., “Experimental space-division multiplexed polarization-entanglement distribution through 12 paths of a multicore fiber,” \JournalTitlePRX Quantum 2, 040356 (2021).
- [11] G. Cañas, N. Vera, J. Cariñe, et al., “High-dimensional decoy-state quantum key distribution over multicore telecommunication fibers,” \JournalTitlePhys. Rev. A 96, 022317 (2017).
- [12] J. F. Dynes, S. J. Kindness, S. W.-B. Tam, et al., “Quantum key distribution over multicore fiber,” \JournalTitleOpt. Express 24, 8081–8087 (2016).
- [13] G. B. Xavier and G. Lima, “Quantum information processing with space-division multiplexing optical fibres,” \JournalTitleCommunications Physics 3, 9 (2020).
- [14] J. Cariñe, G. Cañas, P. Skrzypczyk, et al., “Multi-core fiber integrated multi-port beam splitters for quantum information processing,” \JournalTitleOptica 7, 542–550 (2020).
- [15] T. Nakamura, N. Hoghooghi, N. Fontaine, et al., “Sub-femtosecond stabilization of multicore fiber for high-fidelity quantum networking at 100% duty cycle,” \JournalTitleAPL Photonics 11, 026113 (2026).
- [16] H. J. Lee, E. Lee, and H. S. Park, “Azimuth-rotated splicings of a four-core optical fiber for inter-core group delay compensation,” \JournalTitleIEEE Photonics Technology Letters 29, 2250–2253 (2017). Demonstrates that rotated-splice ICS compensation is incomplete, providing evidence for the stochastic random-walk character of ICS.
- [17] F. Azendorf, A. Dochhan, F. Spinty, et al., “Group delay measurements of multicore fibers with correlation optical time domain reflectometry,” in 2020 22nd International Conference on Transparent Optical Networks (ICTON), (IEEE, 2020), pp. 1–4.
- [18] L. Jin, Y. Wang, M. Zhang, et al., “Measurement of differential mode group delay in few-mode fiber with correlation optical time-domain reflectometer,” \JournalTitleApplied Optics 61, 3579–3582 (2022).
- [19] H. J. Lee, H. S. Moon, S.-K. Choi, and H. S. Park, “Multi-core fiber interferometer using spatial light modulators for measurement of the inter-core group index differences,” \JournalTitleOptics Express 23, 12555–12561 (2015).
- [20] C.-K. Hong, Z.-Y. Ou, and L. Mandel, “Measurement of subpicosecond time intervals between two photons by interference,” \JournalTitlePhysical Review Letters 59, 2044 (1987).
- [21] G. H. Aguilar, R. S. Piera, P. L. Saldanha, et al., “Robust interferometric sensing using two-photon interference,” \JournalTitlePhys. Rev. Appl. 14, 024028 (2020).
- [22] P. Aboussouan, O. Alibart, D. B. Ostrowsky, et al., “High-visibility two-photon interference at a telecom wavelength using picosecond-regime separated sources,” \JournalTitlePhysical Review A 81, 021801 (2010).
- [23] T. Gerrits, F. Marsili, V. B. Verma, et al., “Spectral correlation measurements at the Hong–Ou–Mandel interference dip,” \JournalTitlePhysical Review A 91, 013830 (2015).
- [24] B. J. Puttnam, R. S. Luís, G. Rademacher, et al., “Characteristics of homogeneous multi-core fibers for SDM transmission,” \JournalTitleAPL Photonics 4, 022804 (2019).
- [25] B. E. A. Saleh and M. C. Teich, Fundamentals of Photonics (Wiley, Hoboken, NJ, 2019), 3rd ed.
- [26] C. D. Poole and R. E. Wagner, “Phenomenological approach to polarisation dispersion in long single-mode fibres,” \JournalTitleElectronics Letters 22, 1029–1030 (1986).
- [27] C. D. Poole, “Statistical treatment of polarization dispersion in single-mode fiber,” \JournalTitleOptics Letters 13, 687–689 (1988).
- [28] K. M. Jordan, R. A. Abrahao, and J. S. Lundeen, “Quantum metrology timing limits of the Hong–Ou–Mandel interferometer and of general two-photon measurements,” \JournalTitlePhysical Review A 106, 063715 (2022).
- [29] S. M. Kay, Fundamentals of Statistical Signal Processing, Volume I: Estimation Theory (Prentice Hall, Englewood Cliffs, NJ, 1993).
- [30] Fibercore (Humanetics Group), “SM-4C1500(8.0/125)/001 four-core single-mode fiber datasheet,” https://fibercore.humaneticsgroup.com/products/multicore-fiber/multicore-fiber/sm-4c150080125001 (2024). Operating wavelength 1520–1650 nm; 4-core square arrangement; 50 m core spacing; 125 m cladding.
- [31] J. Cariñe, M. N. Asan-Srain, G. Lima, and S. P. Walborn, “Maximizing quantum discord from interference in multi-port fiber beamsplitters,” \JournalTitlenpj Quantum Information 7, 172 (2021).
- [32] B. J. Puttnam, G. Rademacher, R. S. Luis, et al., “Inter-core skew measurements in temperature controlled multi-core fiber,” in Optical Fiber Communication Conference, (Optica Publishing Group, 2018), pp. Tu3B–3.
- [33] B. J. Puttnam, G. Rademacher, R. S. Luís, et al., “Impact of temperature on propagation time and inter-core skew in a 19-core fiber,” in Asia Communications and Photonics Conference, (Optica Publishing Group, 2018), pp. S3K–4.