figurec
Constraints on the host galaxy and AGN properties of three JWST AGN from NOEMA observations
The James Webb Space Telescope revealed a large population of active galactic nuclei (AGN) at , showing peculiar physical properties that are challenging to reconcile with known lower redshift and higher luminosity AGN. A missing piece in the description of these sources is the physical characterisation of their host galaxies, and a reliable modeling of the emission coming from the AGN and from the host. We targeted with deep NOEMA observations the [C ii]emission of three JWST-discovered AGN at . Two of them have the typical features of Little Red Dots (LRDs), while the third one is a blue, extended, Type I AGN. We do not significantly detect [C ii] emission or dust continuum in any of the targets, even after stacking. The resulting [C ii] luminosity upper limits, L⊙, lie below the values expected from the [C ii] –SFR relation, and we explore different scenarios to explain the lack of [C ii] . We obtained upper limits on the gas masses of M⊙ corresponding to M⊙ assuming a metallicity dependent dust to gas ratio. Using the continuum non-detections () together with JWST/MIRI constraints, we performed a revised SED-fitting decomposition, resulting in stellar masses up to dex lower than previously reported, and implying . For the two LRDs, the SED is well reproduced by stellar emission in the rest-frame UV, while the rising rest-frame optical slope, flattening toward the near-infrared, is consistent with emission from a Type I AGN partially obscured along the polar direction with , in agreement with attenuation derived from the broad lines Balmer decrement. This decomposition demonstrates that a relatively standard AGN configuration can reproduce the SEDs of the two LRDs, without invoking more exotic scenarios. Finally, we investigate the positions of the three sources in the plane, finding that they lie in a parameter space where galaxies are typically characterized by patchy dust distributions. Our analysis highlights the importance of millimeter constraints to characterize the different physical properties of high-z AGN.
Key Words.:
galaxies: active, galaxies: high-redshift, galaxies: ISM, galaxies: nuclei, submillimeter: galaxies1 Introduction
One of the most exciting results of the first years of JWST operations is the discovery of a surprising abundance of broad-line (BL) active galactic nuclei (AGN) (also called Type I AGN) at , characterized by bolometric luminosities that are 1-3 dex fainter than the previously known QSO population (Matthee et al., 2024; Maiolino et al., 2024; Harikane et al., 2023; Greene et al., 2024; Juodžbalis et al., 2025a; Taylor et al., 2024; Hviding et al., 2025). This new population of faint Type I AGN is characterized by peculiar physical properties, rarely observed in the previously known AGN population. Specifically, they are characterized by a weakness in X-ray (with observed up to 2-3 dex lower than expected, see Maiolino et al., 2025; Yue et al., 2024; Ananna et al., 2024; Mazzolari et al., 2024; Comastri et al., 2025) and radio emission (Mazzolari et al., 2026a; Gloudemans et al., 2025) compared to what is expected from the usual scaling relations derived from lower redshift and higher luminosities AGN (Duras et al., 2020; Lusso et al., 2012; D’Amato et al., 2022; Wang et al., 2024; Bariuan et al., 2022). Additionally, the black holes (BHs) powering these sources appear to be over-massive compared to their host galaxies, when placed on local scaling relations (Übler et al., 2023; Kokorev et al., 2023; Furtak et al., 2024; Maiolino et al., 2024; Tripodi et al., 2025; Napolitano et al., 2025; Pacucci et al., 2023; Jones et al., 2025), such as those by Reines and Volonteri (2015); Kormendy and Ho (2013). While there are still uncertainties on both the BH and stellar mass measurements for these objects, this now appears to be a systematic trend, and some of these sources even reach (Juodžbalis et al., 2025b). Additionally, of these high-z AGN discovered by JWST are characterized by narrow absorptions in the broad hydrogen and helium emission lines (Matthee et al., 2024; Juodžbalis et al., 2024a; Wang et al., 2025; Juodžbalis et al., 2025a; D’Eugenio et al., 2026; Loiacono et al., 2025), a spectroscopic feature characterizing only of local AGN (Hutchings et al., 2002; Wang and Xu, 2015; Burke et al., 2021; Shi et al., 2016; Schulze et al., 2018).
Among these JWST-discovered Type I AGN, a subclass, consisting of of the population (Hviding et al., 2025; Hainline et al., 2024, the fraction significantly depend on the luminosity of these objects, see ), are the so-called Little Red Dots (LRDs Matthee et al., 2024). These sources are characterized by all the features reported above but specifically also by very compact morphologies, typically unresolved at the limit of JWST PSF (i.e. sizes ) and by a spectral energy distribution (SED) with a peculiar V-shaped profile (i.e., a red slope in the rest-frame optical and a blue slope in the rest-frame UV) presenting a turnover in correspondence of the Balmer break (Kocevski et al., 2024; Greene et al., 2024; Setton et al., 2025a; Ji et al., 2025). Different works have tried to explain the unexpected physiscal properties of JWST discovered AGN and LRDs, but many pieces are still missing. Several studies are now suggesting the existence of a dense cocoon of gas surrounding the central active BH (Inayoshi and Maiolino, 2024; Ji et al., 2025; Naidu et al., 2025; de Graaff et al., 2025b; Inayoshi and Ho, 2025), a scenario first proposed by Inayoshi and Maiolino (2024) to explain the origin of the V-shaped SED. If the rising SED redwards of the Balmer break arose from stars, then these sources would have stellar densities higher than those of the most dense stellar clusters (Baggen et al., 2024), and their number density would challenge the CDM model (Akins et al., 2025b). The same “V-shape” SED, however, could result from hydrogen absorption by a dense gas envelope surrounding the central BH. If the gas density is sufficiently high to keep the hydrogen level populated via collisional excitation, then the Balmer break emerges as a direct consequence of this AGN structure (through absorption in all Balmer lines), while the X-ray and radio weakness would instead be attributed to absorption by the large column densities surrounding the central emitting source (i.e. from photoelectric absorption and free-free absorption, respectively). This scenario has also been supported by the identification of LRDs with Balmer break strengths exceeding the expected limit for stellar populations (Naidu et al., 2025; de Graaff et al., 2025b). More recently, some works also proposed the so-called ”BH-star” model, where the dense gas envelope surrounding the central BH effectively acts as the convective envelope of a star, and where scattering processing can also be in place in an inner ionizied layer, producing exponential wings in the broad emission lines and falsifying the measure of BH masses based on local virial relations (Naidu et al., 2025; Torralba et al., 2025). In this scenario, the dense gas envelope would behave as the thermalized photosphere of a star, emitting a blackbody radiation at temperatures K, peaking at , and producing the optical rising continuum (Lin et al., 2026; Kido et al., 2025; de Graaff et al., 2025a; Barro et al., 2025).
A missing piece in the physical characterisation of JWST-discovered AGN and LRDs are the properties of their host galaxies. Their small sizes make it difficult to disentangle the host galaxy and AGN contributions in the optical bands, and a natural way to unambiguously observe the host galaxy would be to examine its millimeter emission. However, most previous attempts to detect the [C ii]or dust continuum in JWST-discovered AGN at z4 led to non-detections (Labbe et al., 2025a; Akins et al., 2025b; Setton et al., 2025b; Xiao et al., 2025). While a tentative [CI](2–1) detection was reported for one LRD (Akins et al., 2025a), the only [C ii]line detection in a JWST-discovered AGN reported so far is for A383-LRD1 (Golubchik et al., 2025), which also shows [O iii] 88m emission (Knudsen et al., 2025). However, the LRD nature of this source is just suggested by its NIRCam color, while the presence of BL emission and possibly other LRD spectroscopic signatures are not yet confirmed. Additionally, it also shows a close-by blue companion, and both the [C ii] and [O iii] 88m seem to peak on the companion or in between the two sources, suggesting that these lines might actually trace a bridge of common circumgalactic medium rather than the LRD host. This prevents a measure of the dynamical mass of this LRD, but the high [O iii] /[C ii] ratio suggests a strong UV radiation field coming from the sources.
FIR observations would also be crucial to constrain the dust mass budgets of JWST-discovered AGN. While quasars at do show similar dust properties to their lower redshift analogs (both from a millimeter and mid-infrared perspective, Salvestrini et al., 2025; Bosman et al., 2025), no dust continuum detection has been reported so far in the mm band for high-z AGN discovered by JWST, and stacking experiments put a median upper limit to the dust masses of their hosts of M⊙ at (Labbe et al., 2025b; Casey et al., 2025, 2024). At the same time, the hot dust contribution from the dusty torus is found to be minor, if not absent, in some single sources (Setton et al., 2025b; Wang et al., 2025; Williams et al., 2024), but detected in others (Brazzini et al., 2026) and detected also in some stacking experiments (Delvecchio et al., 2025). In general, these indications seem to favor the scenario in which both the warm and the cold dust content of these sources are small. Some works further proposed that the Balmer decrements observed in some of these objects (reaching up to H /H ) are not due to dust obscuration effects but rather to different physical conditions (deviating from Case B recombination), or due to scattering effects (Chang et al., 2025; de Graaff et al., 2025a).
Recently Greene et al. (2025) showed that the SED of two of the brightest LRDs is systematically different from the standard, nearby Type I AGN SED. While Greene et al. (2025) focused on only two LRDs, it still suggested the need for new bolometric corrections to derive their bolometric luminosity. Crucially, the current lack of detections in the FIR of these sources makes these new bolometric corrections quite uncertain, varying by a factor of depending on how the current FIR upper limits are taken into account in the LRD SED modelling. Therefore, obtaining FIR constraints (detections or deep upper limits) on the FIR emission of these sources is important for understanding their physical properties and correctly interpreting their nature (see also: Herrera-Camus et al., 2026).
In this work, we report and discuss the [C ii] and dust continuum upper limits of three JWST-discovered AGN, as inferred from deep NOEMA observations, and we investigate the implications of these non-detections on the AGN and host galaxy physical properties. The paper is organized as follows. In Section 2, we present and analyze the targets and the NOEMA observations. In Section 3 we present the main results from the analysis of the NOEMA non-detections. In Section 3.1 we derive the [C ii] and continuum upper limits, in Section 3.2 we present the possible scenarios leading to a [C ii] non-detection, and we derive gas and dust mass upper limits in Section 3.3. In Section 3.4 we perform a new SED-fitting decomposition of the three sources using CIGALE, taking into account the NOEMA continuum upper limits and also JWST/MIRI data, finding important constraints on their AGN emission and properties (Section 3.5). In Section 3.7, we place the three targets on the IRX- diagram to gain insights into their geometries and dust properties. Finally, in Section 4 we summarize the results and conclude.
2 Targets analysis and NOEMA observations

| Parameter | JADES_954 | JADES_1146115 | CEERS_397 |
|---|---|---|---|
| RA [deg] | 189.151958 | 189.091458 | 214.836208 |
| DEC [deg] | 62.2596 | 62.228111 | 52.882694 |
| 6.767 | 6.68 | 6.00 | |
| [km s-1] | 128 | 180 | 240 |
| 7.74 | 8.57 | 7.29 | |
| literature | |||
| 10.7 | 8.9 | 9.4 | |
| literature | |||
| 0.001 | 0.46 | 0.007 | |
| literature | |||
| 25 | 45 | 73 | |
| from H | |||
| 0 | 0.62 | 0.12 | |
| 0.12 | 0.04 | 0.15 | |
| literature | |||
| literature | |||
| 357 | ¡270 | 658 | |
| Reference | 1 | 2 | 3 |
2.1 JWST data and literature
Our sample consists of three Type I AGN: JADES_954 (Maiolino et al., 2024), JADES_1146115 (Juodžbalis et al., 2024b), and CEERS_397 (Harikane et al., 2023). These targets were chosen from spectroscopically confirmed Type I AGN discovered by JWST,and observable with NOEMA in the Northern hemisphere. The broad emission component in the Balmer lines (specifically in the H ) attributed to BLR emission of a Type I AGN was detected in the JWST/NIRSpec medium-resolution (MR, ) spectra for JADES_954 and CEERS_397, and in the JWST/NIRSpec PRISM spectrum for JADES_1146115. For all sources, we uniformly recomputed the BH masses and AGN bolometric luminosities using the locally calibrated relations from Reines and Volonteri (2015) and Stern and Laor (2012), respectively, given the lack of corresponding scaling relations. In addition to the available JWST/NIRSpec MR spectra, JADES_954 and CEERS_397 were observed as part of the NIRSpec-IFS Large Program BlackTHUNDER (PID: 5015; PIs: H. Übler, R. Maiolino), providing prism () and high-resolution (HR, ) integral-field unit (IFU) spectroscopy. The global physical properties of the three targets, as derived from previous literature works and from the additional analysis presented in this section, are summarized in Table 1. In Fig. 1 we show their JWST NIRSpec/PRISM spectra and NIRCam RGB cutouts.
Our targets were selected without requiring them to be LRDs, but we characterise them following the LRD criteria outlined by Hviding et al. (2025): broad Balmer lines, a V-shaped SED, and a compact morphology. Hviding et al. (2025) showed that once two of these criteria are present, of them also fulfill the third. All our targets already fulfill the first condition, as they all show broad H emission. We fitted the available JWST/PRISM spectra with a broken power-law model (with the turnover in correspondence to the Balmer limit) to compute the rest-frame optical and UV slopes. Then, we also checked the compactness criterion in the reference F444W NIRCam band (where the AGN emission is expected to dominate at these redshifts, see Hviding et al., 2025; de Graaff et al., 2025a). We first measured the radial surface brightness profiles using the photutils.profiles module (Bradley et al., 2025) with circular apertures that are half pixel wide, ranging from 0 to 15 pixels, and we compared it with the profile obtained from stpsf Perrin et al. (2014) for the same filter (with oversampling=4) and applying the jitter_sigma corrections reported in Morishita et al. (2024). Second, we utilized pysersic (Pasha and Miller, 2023) to model their emission in the F444W band as the sum of a central PSF-like component plus an extended stellar emission described by a Sersic profile. The results of the LRD analysis and the physical properties of the three sources are reported below.
2.1.1 An extended LRD: JADES_954
Our first target, JADES_954 at is the most luminous Type I AGN in the selection performed by Maiolino et al. (2024). Its host galaxy stellar mass was estimated to be based on a spectral fit performed with BEAGLE-AGN (Vidal-García et al., 2024) decomposing the emission coming from the stellar population and the one coming from a reddened AGN. From the literature results, this source has a , and it is only slightly above the relation as derived from locally calibrated, single-epoch scaling relations (Reines and Volonteri, 2015; Volonteri and Reines, 2016). Maiolino et al. (2024) also computed a narrow line using JWST MR spectra obtained with NIRSpec-MSA. Using the BlackTHUNDER HR spectrum extracted from NIRSpec-IFU observations, we found H /H , consistent with the nominal value of 2.86 for case B recombination, implying no attenuation in the narrow line in the rest-UV and optical. This can likely be attributed to the different spectral decomposition based on the MR and HR data. Both broad H and H are detected. From the broad Balmer decrement we found H broad/H , corresponding to to (or to ) assuming a Small Magellanic Cloud extinction law (SMC, Gordon et al., 2003).
Additionally, the high-S/N detection of the broad H emission and the high spectral resolution revealed a clear narrow absorption feature km s-1 blueshifted compared to the systemic redshift (Mazzolari et al. in prep.). This feature is observed in at least of the JWST-discovered AGN (Kocevski et al., 2024; Matthee et al., 2024; Lin et al., 2026) and was not detected in the NIRSpec MR spectrum, supporting that HR spectroscopy is needed to reveal these narrow absorptions (D’Eugenio et al., 2026).
From the UV and optical spectral slope fitting we obtained for JADES_954 and , fulfilling the ‘V-shape’ criterion for LRDs. Regarding compactness, the radial surface brightness profile of JADES_954 was slightly extended compared to the PSF profile in the F444W filter, while the pysersic fit returned a non-negligible PSF-like component, but not dominant compared to the total source flux (). This result is mostly due to the presence of a small blue extension of the source in the North-Est direction, as often observed also for other LRDs (Rinaldi et al., 2025a). From the pysersic fit, we derived an effective radius of pc. Given that two out of the three LRD criteria are satisfied (especially the V-shape SED), and the extension compared to the PSF is only marginal, we considered this source as a marginally extended LRD. Searching for counterparts in the available JWST/MIRI F1000W and F2100W images of GOODS-N (Program ID: 5407, PI: G. Leung), we found a detection in the F1000W image but not in F2100W. To define the MIRI upper limit, we followed the same approach as in Alberts et al. (2024), multiplying the local image rms by the empirically derived F2100W PSF area and then multiplying by 1.5 to account for correlated noise.
2.1.2 LRD: JADES_1146115
Our second target, JADES_1146115 is the ‘dormant’ BH at presented and discussed by Juodžbalis et al. (2024b) (also referred to as GN-1001830 or JADES-GN-38509 in Juodžbalis et al., 2025a) and observed with NIRSpec PRISM and medium resolution spectroscopy as part of the JADES survey (Bunker et al., 2020; Eisenstein et al., 2023). The stellar mass of was derived by performing first a 2D image decomposition that separated the unresolved nuclear source (AGN) from the compact host galaxy with a disk-like profile and then by fitting just the host galaxy emission with both BAGPIPES (Carnall et al., 2019) and Prospector (Johnson et al., 2021). This source is clearly offset from the local scaling relations, hosting an overmassive BH with . The narrow line attenuation taken from Juodžbalis et al. (2024b) is . While the broad H emission is clearly detected in the JADES PRISM spectrum, broad H is not detected in the JADES medium resolution spectrum.
The continuum of this source fulfils the V-shape criterion, having and . Additionally, it has an F444W brightness profile consistent with the PSF; it is therefore unresolved and fulfills all LRD criteria. Instead, at shorter wavelengths an extended component starts to dominate the emission (Juodžbalis et al., 2024b). From the F444W pysersic 2D fit in the F444W image we derived an upper limit to the effective radius 270 pc. This source is not detected in any of the MIRI F1000W and F2100W images covering the GOODS-N field (as expected, being dex fainter than JADES_954).
2.1.3 A blue, Type I AGN: CEERS_397
Finally, our third target CEERS_397 at was selected as a Type I AGN from the CEERS (Finkelstein et al., 2025) JWST/MR spectrum by Harikane et al. (2023). They derived a host galaxy stellar mass of by first performing a 2D decomposition by fitting the image with the AGN and host galaxy component and then using Prospector to fit the SED of the host galaxy. Similar to JADES_954, this source is only slightly above the local relation, with . From the BlackTHUNDER high-resolution spectrum, we derived , consistent with the value computed in Harikane et al. (2023). From the broken powerlaw fit to the PRISM spectrum, we got and , therefore this source appears as a blue Type I AGN, even if is bluer than the typical UV slope of SDSS Type I QSO (Vanden Berk et al., 2001), possibly suggesting that the rest-UV is instead dominated by star-formation (Saxena et al., 2024). It is also clearly extended morphologically, and the NIRCam RGB image revealed two close-by red and blue spots (not distinguishable in the JWST IFU cube due to the larger NIRSpec/IFU PSF). The effective radius of the Sersic-like component is estimated by pysersic to be pc. For this source, JWST/MIRI observations are also available in the F770W, F1000W, F1500W, and F2100W filters, and the source is detected in F770W and F1000W.
2.2 NOEMA data
The targets were observed with the IRAM interferometer NOEMA in intermediate B or BC configuration during the Winter 2024/25 semester (Project ID: W24EK, PI: H. Übler) using the PolyFiX correlator with 12 antennas in band 3. The [C ii]fluxes were estimated starting from the targets’ SFRs and assuming the [C ii] -SFR relation reported by (Schaerer et al., 2020), derived from sources of the ALPINE survey (Le Fèvre et al., 2020; Faisst et al., 2020). The SFR of each source was estimated by assuming that the narrow component of the H emission was due only to the host galaxy SF processes, by correcting it for dust attenuation and finally using the SFR relation derived from Kennicutt and Evans (2012). The exposure times of the observations are reported in Table 3. The excellent weather quality during the observations allowed us to achieve sensitivities even better than requested. JADES_954 was observed on 27/28 December 2024 using MWC349 as a flux calibrator. JADES_1146115 was observed on 3 January 2025 using LKHA101 as calibrator. CEERS_00397 was observed over three tracks on 2 January, 13 January and 16 March 2025 using as calibrator 2010+723 for the first track and MWC349 for the other two. All calibrations and the creation of uv table were performed using the CLIC package from the IRAM GILDAS software222https://www.iram.fr/IRAMFR/GILDAS/. The resulting data cubes have native velocity resolution of km s-1and synthesized beam sizes with the following majorminor axes: (JADES_954), (JADES_1146115), (CEERS_00397). All beam sizes are larger than the optical emission of these sources in the JWST images.
| JADES_954 | JADES_1146115 | CEERS_397 | Stack | |
| Time | 8.7 | 5.2 | 6.4 | 20.3 |
| [hrs] | ||||
| 0.017 | 0.019 | 0.044 | 0.013 | |
| [Jy km s-1] | ||||
| [L⊙] | ||||
| 16 | 17 | 25 | 0.13 | |
| [Jy] | ||||
| [erg ] | ||||
| M⊙) | ||||
| from [C ii] | ||||
| M⊙) | ||||
| from [C ii] | ||||
| M⊙) | ||||
| from cont. |
3 Results and discussion
3.1 [C ii] and continuum non-detection
The [C ii] emission is not detected at the 3 level in all three sources. In Appendix A, we report tentative [C ii] detections for JADES_954 and JADES_1146115, and we also discuss in detail why we did not consider them as reliable enough, or at least not as directly associated to the AGN.
To derive the [C ii] 3 luminosity upper limit we proceeded as follows. We extracted 1D spectra from 100 random positions in the native cube using beam apertures, summing the flux of the pixels within the beam and dividing by the number of pixels per beam. We measured a median noise of the 1D spectra in the native velocity channels (2.5 km s-1) of 1 mJy beam-1, 0.91 mJy beam-1, 1.93 mJy beam-1, for JADES_954 and JADES_1146115, and CEERS_00397, respectively. Then we rescaled the noise values to those measured re-binning the spectra at the velocity resolution corresponding to the expected FWHM of the [C ii] , assuming the same FWHM of the narrow optical emission lines. Then, we computed the [C ii] 3 flux upper limits assuming a box line shape (with a width equal to the narrow-line FWHM, following Walter et al., 2009) and we derived the luminosity upper limits using Eq. 1 in Decarli et al. (2023). The [C ii] flux and luminosity upper limits are reported in Table 3.
Given the [C ii] non-detections, we performed a median stack of the 1D spectra extracted with beam apertures at the expected position of the sources and centered at the zero velocity corresponding to [C ii] . From the stacked spectrum, we measured an rms of 0.65 mJy beam-1 for the 2.5 km s-1 binning. Taking the median FWHM of the three sources and the median redshift () we derived a L⊙. The stacked spectrum is shown in Fig. 2.


By collapsing both the upper side band (USB) and the lower side band (LSB) of the NOEMA observations, we also derived continuum maps, which did not reveal any detections down to a 3 level. To derive the 3 limits, we computed the rms from the median absolute deviation of the 2D map of each source. The continuum upper limits are reported in Table 3. We also performed a median stack of the three continuum maps, following the same procedure outlined in Mazzolari et al. (2026a). The stack did not reveal any detection, as shown in Fig. 2.
3.2 Implications of [C ii] non-detection
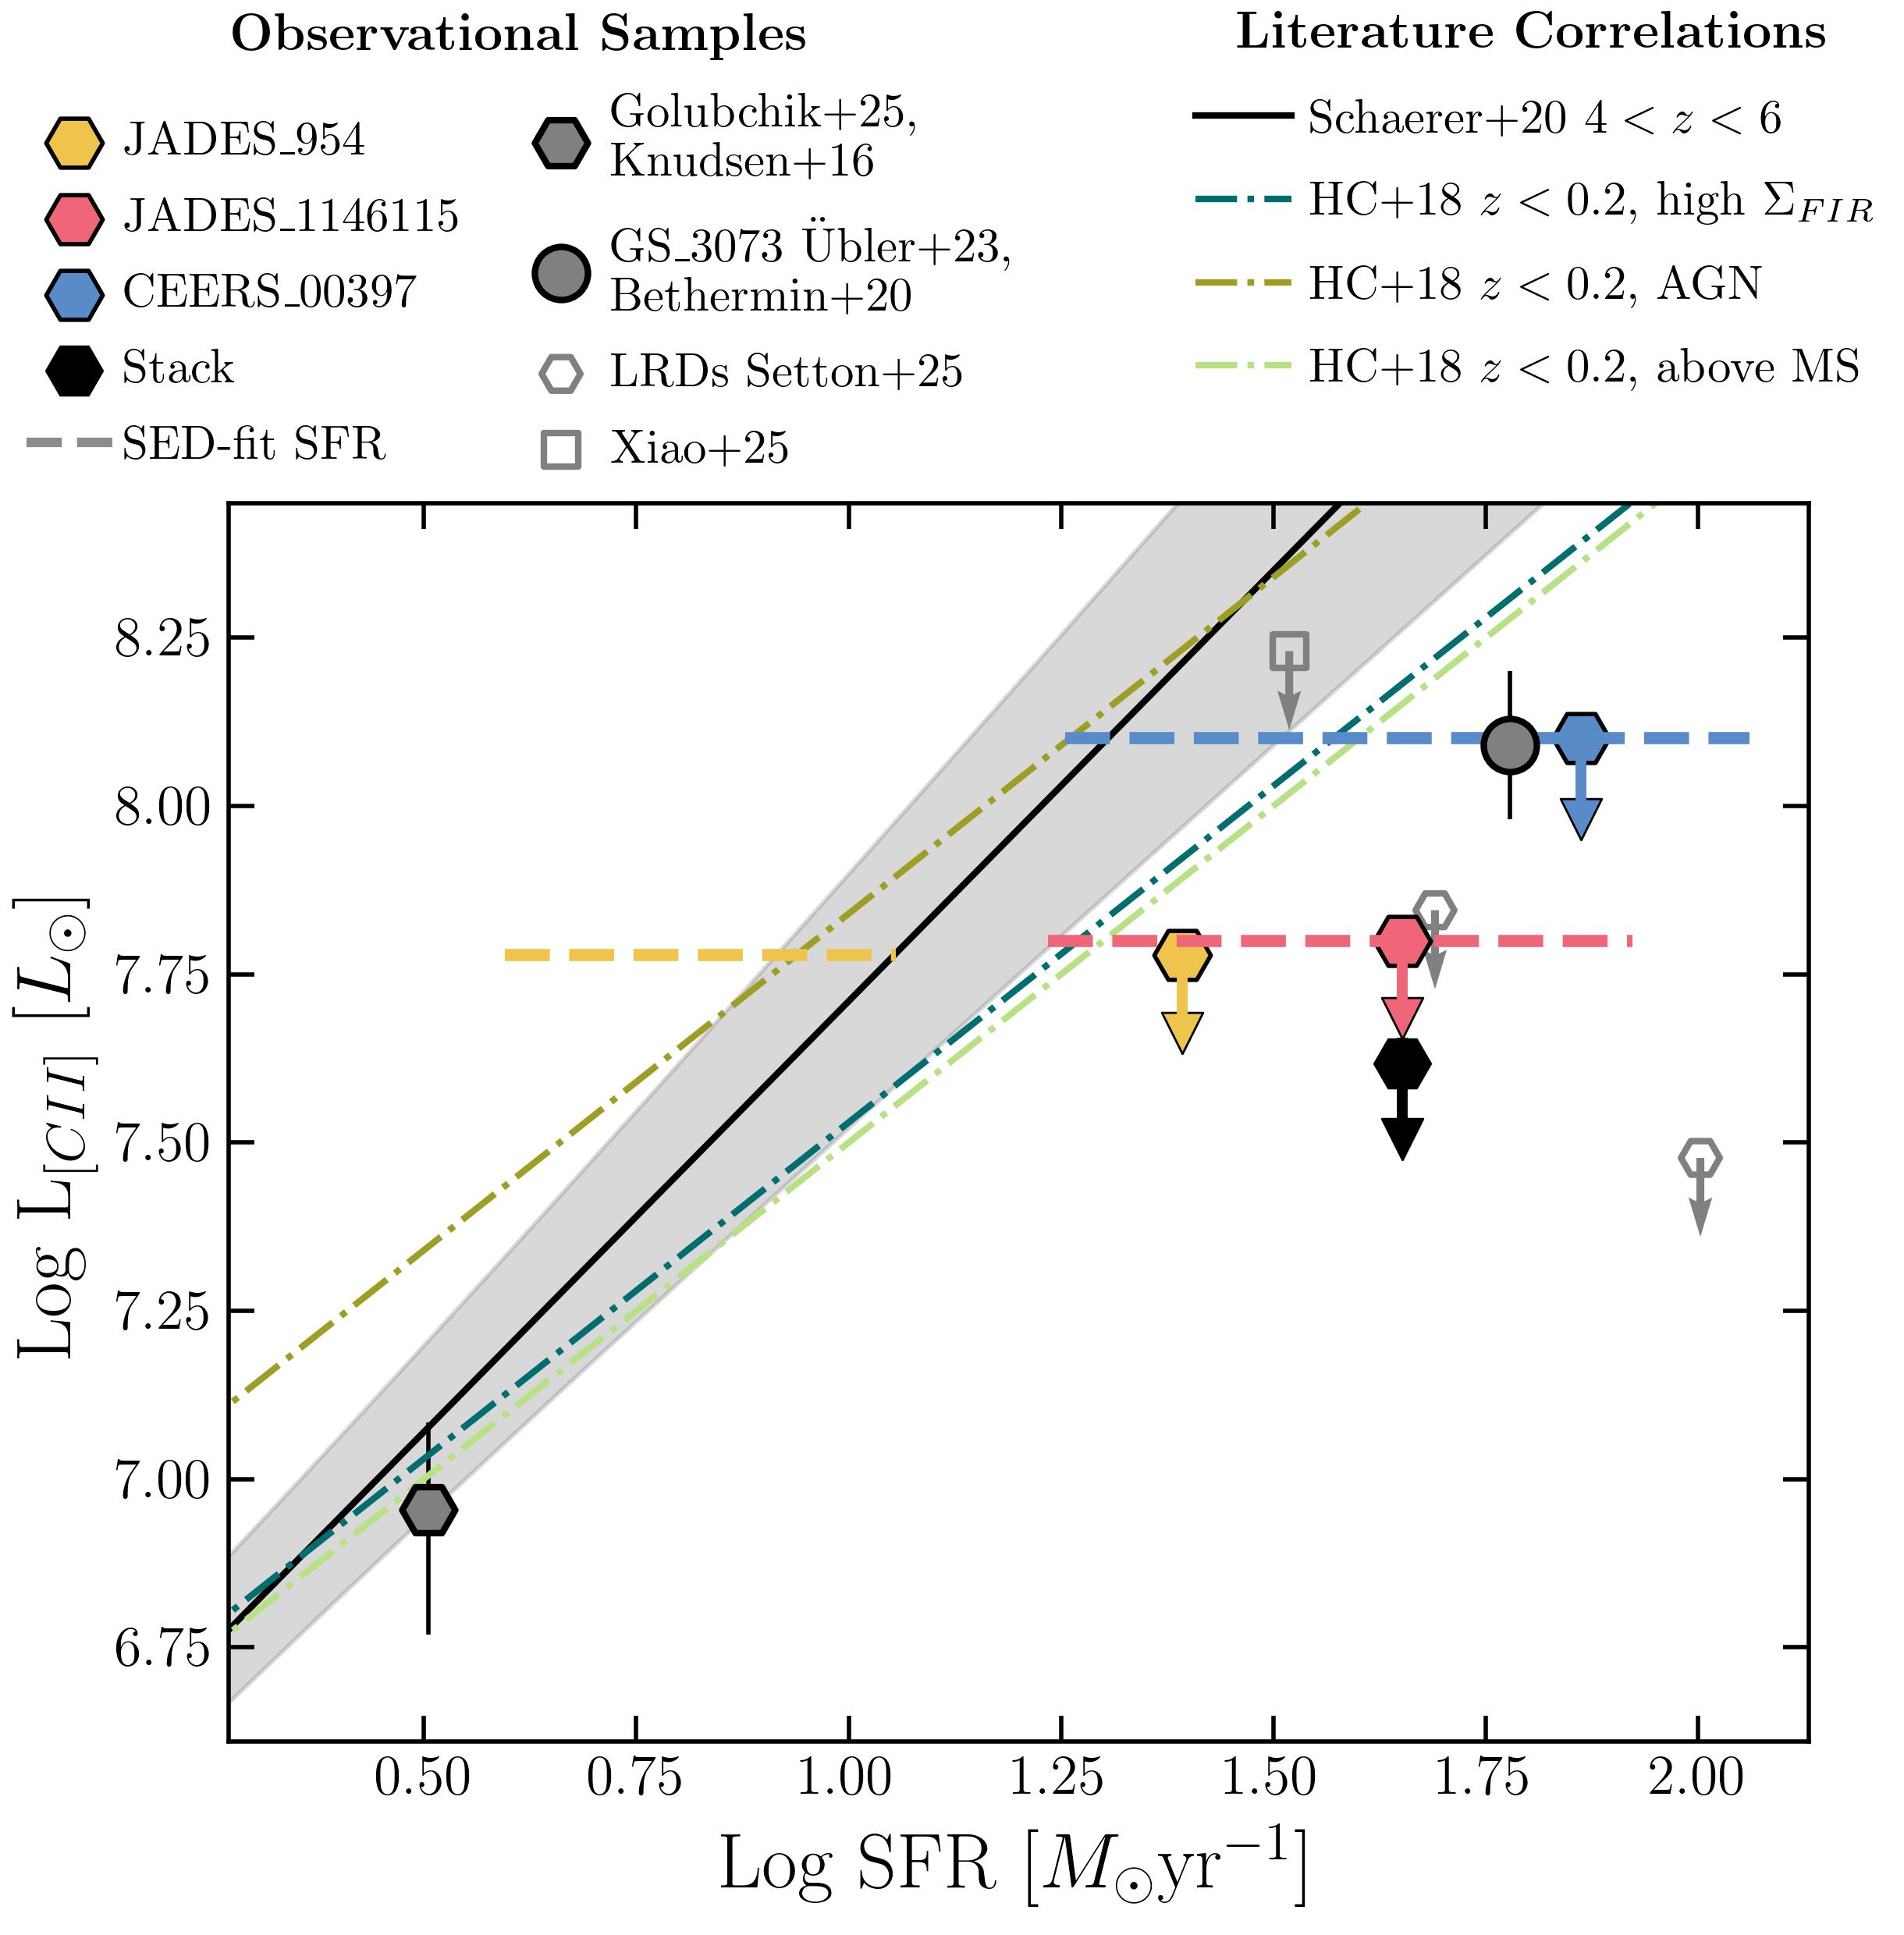
In Fig. 3 we show the upper limits derived from the [C ii] non-detections in the -SFR plane. The upper limits on the [C ii] luminosity lie below the -SFR relation obtained by Schaerer et al. (2020). In Fig. 3 we also show the other spectroscopically confirmed JWST AGN with ALMA or NOEMA follow-up targeting [C ii] . Apart from the LRD photometric candidate A383-LRD1, where it was possible to detect faint [C ii] emission thanks to the large magnification of the source (), the other targets are similarly undetected in [C ii] , with luminosity upper limits close to those obtained in this work. While the [C ii] non-detection of all these sources can still be attributed to a scatter of the relation, there might be other reasons why these sources remain undetected.
The SFRs of our targets were derived from the narrow H emission, using the conversion from Kennicutt and Evans (2012) and assuming the line luminosity is dominated by SF from the host galaxy. Given that we are dealing with sources hosting Type I AGN, this might not be fully appropriate, given that the narrow H component could also be powered by the AGN narrow-line region. However, the assumption appeared to be supported by the narrow FWHM of the sources , narrower than the typical narrow-line FWHM of Type I and Type II AGN (Mignoli et al., 2019). Additionally, the relation from Kennicutt and Evans (2012) does not account for the low metallicities of these sources. Assuming the more conservative relation by Theios et al. (2019), also used for high-z galaxies (Shapley et al., 2023; Pollock et al., 2025), would result in SFR estimates two times lower. The possibility that the SFRs derived from H are overestimated is also partially supported by the range of SFR predicted by the new SED-fitting decomposition (presented in Sect. 3.4), which returned SFRs that are closer to the -SFR relation of Schaerer et al. (2020). However, if this is the case, to reconcile the narrow H luminosity with the SFR predicted by the Schaerer et al. (2020) correlation at the given upper limits, the AGN contribution to the narrow H must be for JADES_954, JADES_1146115 and CEERS_397, respectively. While this might be reasonable for the blue Type I AGN (CEERS_397), the LRD scenarios invoking dense and large covering factor gas distribution around the central BH do not expect the hard AGN ionizing radiation to contribute significantly to the narrow-line region, because most of it is absorbed on scales lower than the narrow-line region.
Given that our targets host AGN, another possible explanation for the [C ii] non-detection is that the AGN ionizing radiation could have impacted the formation of [C ii] . This could have happened as a combination of the destruction of small dust grains, reducing the photoelectric efficiency of the gas, and by converting a fraction of the ions to higher ionization states (Herrera-Camus et al., 2018; Langer and Pineda, 2015). This scenario has been particularly investigated by Langer and Pineda (2015), where, however, the main source of [C ii] suppression was the strong X-ray ionizing radiation. All the AGN investigated in this work are found to be observationally X-ray weak (Maiolino et al., 2025; Mazzolari et al., 2024) and not detected in the deep X-ray images of the Chandra Deep Field North or EGS field (having flux limits of ). While it is still not clear whether this is due to an intrinsic weakness or to dense gas obscuration in the innermost part of the nuclear structure, in either case, it would be difficult for X-ray photons to interact strongly with the dust and gas of the host galaxies without producing any X-ray emission. Additionally, our three sources do not show strong high-ionization emission lines (such as [Ne iv] , [Ne v] , He ii , C iv ), usually indicative of a hard AGN ionizing continuum, and that are also usually undetected in the general population of LRDs (Inayoshi and Ho, 2025; D’Eugenio et al., 2025; Torralba et al., 2025) and JWST discovered AGN (Zucchi et al., 2026; Lambrides et al., 2024; Maiolino et al., 2024). The absence of these high-ionization emission lines has been interpreted as evidence for a screening gas structure covering the central engine and absorbing ionizing photons before they reach the narrow-line region or the host galaxy. It is worth noting that, to have ions (and therefore [C ii] emission), the required ionization potential is 11.26 eV (and therefore hydrogen ionizing photons are not needed), while an ionization potential of 24.38 eV is needed to convert into (and therefore to deplete [C ii] emission by overionizing carbon species). In this context, it is interesting to note that GS_3073, a compact, X-ray weak, and blue AGN at shows a compact but faint [C ii] detection (see Fig. 3) even if its restframe UV and optical spectrum clearly shows several strong high-ionization emission lines (Vanzella et al., 2010; Grazian et al., 2020; Barchiesi et al., 2022; Übler et al., 2023). This source has been recently presented as a prototypical ‘Little Blue Dot’ (LBD) in Brazzini et al. (2026), a population of high-z Type I AGN sharing with LRDs the X-ray weakness and compactness, but differing significantly in terms of continuum shape and presence of high-ionization emission lines. In conclusion, there is insufficient evidence in these sources to prove a general overionization, but this possibility cannot be fully ruled out.
We compared the sources’ upper limits with the relations derived from samples observed as part of the SHINING survey and showing different physical properties, as outlined in Herrera-Camus et al. (2018). Contrary to the relation of Schaerer et al. (2020) (that considered a broad and uniform sample of star-forming galaxies (SFG) at ), these relations offer the possibility to investigate the impact of different physical conditions on the [C ii] production. Herrera-Camus et al. (2018) showed that while an AGN can significantly suppress [C ii] emission in the central few hundred parsecs of a galaxy by altering the heating and cooling balance of the interstellar medium, this effect becomes diluted on a global scale, as can be seen from the AGN relation in Fig. 3 lying very close to the SFG one by Schaerer et al. (2020). Instead, they found the main driver of [C ii] deficit to be the intense radiation field traced by or by the intense SFR, in particular in compact systems. Assuming the SFR from the H line and using the SFR to far-infrared (FIR) luminosity conversion from Kennicutt and Evans (2012) we found L⊙ by using the effective radii reported in Table 1. These are already in the regime that allows thermal saturation of the [C ii] emission and therefore a deficit in the [C ii] vs SFR relation (Lutz et al., 2016; Herrera-Camus et al., 2018; Bisbas et al., 2022). However, our observational results still lie well below the two relations derived in Herrera-Camus et al. (2018) for high and above main sequence (MS) sources.
[C ii] suppression in very dense systems may occour also as a consequence of its low critical density ( cm-3 Carilli and Walter, 2013), that can go down to cm-3 if the emission occurs in ionized gas regions, where the collision partners are electrons. Furthermore, in dense and gas-rich systems, the ability of hydrogen to shield itself from dissociation is increased, and the [C ii] emission is depleted (Narayanan and Krumholz, 2017). As discussed in Sect. 1, it is possible that these sources host heavily gas-enshrouded BHs, where the dense cocoon of gas can potentially reach very high densities (), but large uncertainties remain on the density and properties of the gas in their host, given the millimeter non-detections. Other scenarios for the lack of [C ii] include low-metallicity effects (e.g. Vallini et al., 2025), or the possibility that [C ii] is distributed on scales larger than those of the optical emission and therefore is characterized by a low surface brightness hard to detect even with deep mm observations (a similar scenario was also proposed for the host galaxies of LRDs, see Rinaldi et al., 2025a, b).
The enhancement or depletion of [C ii] emission in AGN is a topic that has been widely debated in the literature (Carniani et al., 2020; Raouf et al., 2025; Herrera-Camus et al., 2018; Langer and Pineda, 2015). Indeed, there are also works reporting an excess of [C ii] emission in AGN host galaxies (Smirnova-Pinchukova et al., 2019) compared to what is expected for a standard SFG. In this case, the [C ii] enhancement was attributed to AGN outflows. However, the three sources analyzed in this work do not show the bright high velocity outflow signatures in ionized gas emission typical of luminous QSOs.
3.3 Gas and dust mass upper limits from [C ii] and continuum non-detection
Works studying the evolution of the molecular gas fraction () consistently found a significant increase of with redshift, with approaching unity already around cosmic noon (Tacconi et al., 2020; Genzel et al., 2015; Freundlich et al., 2019). From the [C ii] upper limits, we can derive an upper limit on the molecular gas mass using the correlation reported by Zanella et al. (2018), which provides a larger estimate of the gas mass compared to other relations accounting for a metallicity dependence of the (Vallini et al., 2025). In this way we provide conservative upper limits on . By taking from Zanella et al. (2018), we derived upper limits on the gas mass of , , for JADES_954, JADES_1146115 and CEERS_397, respectively. From the stack [C ii] upper limit, we derived a median gas mass upper limit of . With the metallicity-dependent conversion by Vallini et al. (2025), we got upper limits that are 0.3-0.5 dex lower. The molecular gas mass upper limit of JADES_1146115 and CEERS_397 are of the same order as the stellar mass estimated by Juodžbalis et al. (2024b) and Harikane et al. (2023), respectively. Instead, for JADES_954 the molecular gas mass upper limit is quite low compared to the stellar mass derived by Maiolino et al. (2024) from the BEAGLE decomposition, being dex lower than the stellar mass value reported there. Indeed, the stellar mass value reported by Maiolino et al. (2024) would imply , implausible for the general population of galaxies (see Genzel et al., 2015; Tacconi et al., 2020), but also not expected for sources investigated in this work (see McClymont et al., 2026). As we further discuss in Sec. 3.4, our new SED fitting decomposition returns a lower stellar mass for this object, reconciling this tension.
Assuming a dust-to-gas ratio (DGR) we can also derive an upper limit on the dust mass of the three sources. We assumed a linear evolution of DGR ratio with metallicty (Draine et al., 2007; Rémy-Ruyer et al., 2014; Sommovigo et al., 2022):
| (1) |
where DGR⊙ is the Galactic value of 1/162, and the solar metallicity. Taking the sources metallicities reported in Table 1, we derived 3 upper limits on the dust mass of M⊙) for JADES_954, JADES_1146115 and CEERS_397, respectively. From the gas mass upper limit obtained from the stack (and assuming the median metallicity of the sample) we derived M⊙). We find the lowest dust mass for JADES_1146115 which has also the lowest gas phase metallicity in our sample. This could potentially be related to recent accretion of low-metallicity gas. Instead, using the metallicity-dependent DGR function obtained for SFGs by Leroy et al. (2011), we found two times larger dust masses. These individual values, thanks to the depth of the NOEMA observations, are consistent with those derived in the literature from a stack of similar objects at (Casey et al., 2025).
We also derived the expected dust masses from the dust continuum upper limits. We fit the NOEMA non-detection by using a modified blackbody model. In particular, we used the following function:
| (2) |
where is the observed flux density at frequency , is the total dust mass, is the dust opacity, (for which we assumed the expression reported in Carniani et al., 2017; Costa et al., 2026) and is the luminosity distance at redshift . This equation gives the observed flux density measured against the CMB radiation field, represented by , where is the temperature of the CMB at redshift . To estimate the dust mass, we chose to fix the temperature at K444We caution that some works found lower dust temperatures (specifically K) in one normal SFG at (Algera et al., 2025; Villanueva et al., 2024). However, it has also been demonstrated that AGN or QSO typically have K (Beelen et al., 2006; Leipski et al., 2013, 2014; Walter et al., 2022), and we therefore preferred to assume K. and , taking the same cold dust temperature and of other studies of galaxies from the REBELS and ALPINE surveys (Bowler et al., 2024; Sommovigo et al., 2022, 2020). This returned upper limits of the dust masses of M⊙), for JADES_954, JADES_1146115 and CEERS_397, respectively. For the same parameters, we also inferred the upper limits on the far-infrared (FIR) luminosities of these sources to be: L⊙, L⊙, L⊙. The upper limits to the dust masses obtained from the continuum non-detection are only 0.1 dex and 0.4 dex larger than the upper limits estimated above from the [C ii] upper limits for CEERS_397 and JADES_954, respectively, while it is 0.8 dex larger for JADES_1146115. Using the contnuum stacked map, and considering the median redshift of the three sources, we derived an upper limit to the median dust mass of the sources M⊙), only 0.3 dex larger than what estimated from the stack [C ii] non detection.

| Parameter | JADES_954 | JADES_1146115 | CEERS-00397 |
|---|---|---|---|
| instantaneous SFR [] | |||
| SFR [10 Myr] [] | |||
| Age main stellar population [Myrs] | |||
| Torus opening angle [deg] | |||
| Viewing angle [deg] | |||
| AGN fraction () | |||
| AGN bolometric luminosity [erg s-1] | |||
| New | 0.28 | 0.72 | 0.03 |
3.4 Implications of the dust continuum non-detection
We performed an SED-fitting decomposition to combine the rest-frame optical and UV light from JWST data with the NOEMA continuum non-detection and MIRI data. We used the JWST/NIRSpec integrated PRISM spectra available from the BlackTHUNDER and JADES surveys (see Fig. 1) to extract the rest-frame optical and UV photometry by sampling the spectra extracted from apertures that include all the sources’ light. In particular, we sampled the JWST/NIRSPec PRISM spectra (covering the observed wavelength range ) in bins of 2500 Å, which provides a good representation of the continuum shape without being too sensitive to noise fluctuations. We checked that the extracted fluxes are consistent with the NIRCam measurements using available NIRCam photometry. The SED-fitting decomposition was performed using CIGALE, and a detailed description of the modules and of the parameters explored is reported in Appendix B. In Table 3 we also report the main output parameters, while the AGN and host galaxy emission decomposition are presented in Fig. 4.
For the two LRDs (JADES_954 and JADES_1146115) the macroscopic decomposition is similar: the rest-frame UV is dominated by stellar emission, while the AGN emission is suppressed in the rest-frame UV and starts to dominate at MIR wavelengths (). Instead for the blue AGN CEERS_397, the code predicts an SED dominated by stellar emission and with a non negligible ( in the ) contribution coming from a blue, almost unobscured AGN (as expected from the properties reported in Sect. 2.1). A more detailed analysis of the AGN emission of these sources is discussed in Sect. 3.5.
CIGALE assumes energy balance, and therefore the energy absorbed in the rest-frame optical and UV is then re-emitted in the FIR following the prescription of Draine et al. (2014, 2007). This module accounts for diffuse dust emission heated by the general stellar population (cold dust) and also for dust tightly linked to star-forming regions (hotter dust). In the fit, we fixed the extinction of the optical emission lines, to the values obtained from the narrow Balmer decrement in the JWST spectra of the sources and the stellar attenuation to be .
The instantaneous SFRs predicted by the code are compatible (within 1) with the values obtained from the narrow H emission line (except for JADES_954), and are mainly driven by SF burst predicted to occur in all the sources in the last 2-5 Myr. Instead, the SFRs averaged over the last 10 Myrs of star formation histories are dex lower, as shown by the dashed lines in Fig. 3 – a potential explanation for the [CII] non-detections, as discussed in Section 3.2.
The stellar masses estimated from the SED fitting are lower than previous estimates in the literature, particularly for JADES_954 and CEERS_397. For JADES_954, our new SED fitting predicts a stellar mass of , dex below the value previously reported by Maiolino et al. (2024), and just times larger than the BH mass reported in Tab. 1. Instead, for CEERS_397, the stellar mass is , a factor of five lower than the previous estimate. Contrarily, for JADES_1146115, the SED fitting predicts a stellar mass very similar to the one reported by Juodžbalis et al. (2024b), where a careful AGN and host galaxy 2D decomposition was performed. These new stellar mass estimates alleviate the tension reported in Sect. 3.3 on the gas-to-stellar mass ratio when the literature stellar masses were considered.
These results demonstrate the importance of combining multi-wavelength constraints for a reliable derivation of global physical properties (see also in Sect 3.6). At the same time, the SED-fitting decomposition we obtained including the MIRI data and the new NOEMA constraints, revealed (or confirmed for the case of JADES_1146115) the overmassive nature of these sources and even increases the ratios (estimated from locally-calibrated scaling relations), particularly for JADES_954 that now shows . The new are reported in Table 3. However, we emphasize the uncertainty of this ratio, given the stellar masses uncertainties derived by CIGALE are dex and the systematic uncertainties of the relation used to derive are dex (Reines et al., 2013; Reines and Volonteri, 2015).
The gas masses predicted by CIGALE are , 8.32, 8.28 (respectively for JADES_954, JADES_1146115, and CEERS_397), lower than the upper limits obtained in Sect. 3.3 from the [C ii] non-detection, and come with an uncertainty of 0.4-0.7 dex. The dust masses obtained from the code are usually more uncertain and are also slightly larger than the upper limits obtained in Sect. 3.3 from the dust continuum.
3.5 AGN emission
The deep, multi-wavelength constraints from the JWST/PRISM spectrum, MIRI images, and NOEMA upper limits allowed us to provide a more complete picture of the AGN emission in these objects. From SED fitting, the AGN emission is predicted to be face on (as for a Type I AGN, with inclination relative to the line of sight of ), consistent with the detection of broad emission lines. For the blue AGN (CEERS_397), the code predicts the AGN contribution to come from an unobscured Type I AGN component, which, however, is not dominant over the stellar contribution across the whole SED. This was already suggested by the UV slope, larger than typically observed in Type I AGN, and closer to the intrinsic of high-z SFG (see Sect. 2.1). For the two LRDs, instead, the Type I AGN emission is expected to be obscured in the polar direction, with . Perhaps surprisingly, this result is consistent with the broad Balmer decrement observed in JADES_954 and with the non-detection of the broad H in JADES_1146115. The light absorbed by the AGN polar dust (whose temperature was allowed to vary between K and 300 K) is then re-emitted in the FIR, where the polar dust AGN emission dominates (or is comparable to) the host galaxy dust emission. The two LRDs are in GOODS-N, and this part of their SED could, in principle, be tested using Herschel constraints. However, these data are not deep enough to put constraints in the range, but could in principle be explored by the future PRIMA facility (Moullet et al., 2025; McKinney et al., 2025). We highlight that polar dust obscuration in Type I AGN has already been reported not only for single objects but also for statistical samples at lower redshifts (Lusso et al., 2012; Elvis et al., 2012; Stalevski et al., 2016; Lyu and Rieke, 2018). For example, Bongiorno et al. (2012) suggested that the fraction of extincted sources (having E(B-V)) among Type I AGNs is . Therefore, the scenario we propose is not atypical and was also originally suggested to fit the continuum emission of other LRDs (Wang et al., 2025).
An additional element that strongly supports the SED-fitting decomposition presented in this work is that, for all three sources, the AGN bolometric luminosities predicted by the SED-fitting are consistent within 1 with the values obtained in the literature from the scaling relations using the broad H emission line. This is in contrast to the results by Greene et al. (2025) for similar objects, where the authors stressed the importance of new bolometric corrections for LRDs and JWST-discovered AGN.
It is worth noting that JADES_1146115 and JADES_954 (the two LRDs) show a particularly flat MIR SED. This property was already observed in other works and attributed to the lack of a significant warm dust component coming from the dusty torus (Setton et al., 2025b; Akins et al., 2025b; Casey et al., 2024). Also from our SED-fitting decomposition the dusty torus component is found to be subdominant at compared to the obscured accretion disk emission. In particular, the opening angle of the torus is expected to be small (i.e. ) and therefore only poorly illuminated by the central accretion disk.
Recently, different AGN-related SEDs have been proposed to explain the red optical emission observed in high-z AGN discovered by JWST, particularly in LRDs. For example, the gas-enshrouded AGN SED presented by Inayoshi and Maiolino (2024) and observationally tested in Ji et al. (2025); D’Eugenio et al. (2025), or the BH-star modelling presented by Naidu et al. (2025); de Graaff et al. (2025a); Kido et al. (2025). The main prediction of the first model is the presence of absorption features in the broad Balmer lines up to the Balmer break, whose strengths depend primarily on the hydrogen volume and column densities. The main predictions of the BH-star model are instead the presence of a cool (at K) partially ionized gas envelope that dominates the emission in the rest-optical and near-infrared, emitting similarly to a modified blackbody (Kido et al., 2025; Liu et al., 2025). While for CEERS_397 these models are not consistent with its SED, given the blue optical and UV slopes, for JADES_954 and JADES_1146115 they might provide a plausible fit solution. Although both sources exhibit a turnover in their spectra at the Balmer limit, neither shows a strong one. Additionally, JADES_954 shows a clear narrow H absorption in its high-resolution spectrum, while no absorption features have been detected in the medium resolution spectrum of JADES_1146115 (but it is still possible that absorptions are present but not resolved at ). As for the BH-star model, we noticed that the obscured Type I AGN disk emission predicted by CIGALE resembles that of a blackbody and peaks at , almost the same range where most of the LRDs presented in de Graaff et al. (2025a) are found to peak. However, for the two LRD investigated in this work, there is no reason to prefer such a scenario over the more ‘classic’ view presented and discussed in this section. The SED decomposition and the interpretation of the AGN emission presented in this work are instead consistent with what was found by Nikopoulos et al. (2025). There, analysing the Balmer decrements of multiple Balmer transitions in a sample of seven Type I AGN discovered by JWST, the authors found indications of a two-component scenario, where the broad lines (and possibly the optical/NIR emission) originate from a high column density AGN, while the narrow lines (and possibly the UV continuum) arise from a low-dust narrow line region or star-formation. A dust-driven interpretation of the properties of LRDs was also recently presented in Madau and Maiolino (2026).
In conclusion, the fit presented in this section provides a reliable and ‘classic’ decomposition of the AGN and host galaxy emission of the two LRDs, without the need to invoke exotic scenarios. In particular, the LRD V-shape SED (and flat in the rest-NIR) can be explained, at least for these sources, as dominated by stars in the rest-UV, and by an accretion disk obscured in the polar direction in the rest-optical and rest-NIR, without a significant contribution from a dusty torus. This does not mean that the dusty torus is absent, but simply that it is confined to low opening angles, is not significantly illuminated, and therefore does not dominate the NIR SED with its reprocessed light.
3.6 Importance of MIRI and NOEMA data
Adding the MIRI and NOEMA constraints to the SED fitting significantly improved the reliability of the results and the overall description of the sources compared to the sole rest-UV and optical information. We demonstrate this by performing a fit using the same parameter grid as for our fiducial fit, but without including the NOEMA upper limits or the MIRI data.
Excluding the MIRI constraints leads the code to add, in all three sources, a hot-dust component from the dusty torus, which dominates at . As we instead showed in Sect. 3.5, from the MIRI data and upper limits, the torus is not expected to dominate the emission at , because most of the light from the accretion disk does not intercept the torus opening angle. Additionally, without the MIRI data, the AGN component of the blue AGN CEERS_397 is not fit as a blue Type I AGN, but rather as an obscured Type I AGN, similar to the other two LRDs.
Performing the fit excluding the NOEMA upper limits, we found for all sources the predicted 1.2 mm emission exceeding the limit set by our observations by more than a factor of 10, and in the case of CEERS_397 even by a factor of . This excess is mainly driven by a larger predicted AGN and galaxy host dust contribution in the mm bands. For the AGN, this is a consequence of a larger optical obscuration and a much larger intrinsic AGN luminosity, not consistent with the values reported in Table 1. Instead, the dust masses computed without the NOEMA upper limits are a factor of 2, 7, and 3 larger for JADES_954, JADES_1146115, and CEERS_00397, respectively. Given that the dust luminosity is fixed by the known attenuation, without the NOEMA limits, the code predicts a larger host galaxy cold dust component in these sources, which is instead ruled out by our continuum non-detections.
These results highlight the importance of multi-wavelength coverage to constrain physical properties through SED fitting. This is particularly relevant for the ongoing debate about the nature of distant and faint AGN, and for our understanding of the physical properties of their host galaxies.

3.7 Indications of complex dust-UV geometry
In the analysis presented in Sect. 3.2 and in Sect. 3.4 we computed the FIR emission of our targets in two different ways: the FIR luminosity estimate provided by CIGALE and the upper limit provided by the modified blackbody fit at fixed K. Comparing these two FIR luminosities can provide valuable insight into the dust properties of these sources and, potentially, on how the dust is distributed relative to the optical light. The FIR luminosity computed by CIGALE assumes energy balance and considers both the contribution from attenuated starlight and from the attenuated nebular emission (nebular lines plus nebular continuum). This result can be considered as a lower limit to the total FIR luminosity of a source, given that the energy absorbed by dust in the rest-UV and optical has to be re-emitted in the FIR, and this amount is determined by the obscuration of the narrow lines measured from the narrow Balmer decrement. However, more complex geometries between the UV-emitting regions and dust might actually determine larger FIR emission than predicted by the energy balance scenario. On the other hand, the modified blackbody fit provides the maximum possible cold dust luminosity given the observed upper limit at the chosen dust temperature, and therefore it can be considered as an upper limit to the FIR luminosity. With these constraints, it is useful to place the three sources in the IRX versus plane (Meurer et al., 1999), where IRX=, while represents the rest-frame UV powerlaw slope. The location of the source in this plane provides an indication of the dust properties, the attenuation or extinction law characterizing the sources, and the geometry of the FIR-emitting regions. We measured from the available JWST PRISM spectra in the wavelength range by fitting the spectrum with a simple power-law model after masking regions of 100 Å around strong emission lines.
In Fig. 5 we show the position of the three sources in the IRX- plane. The lower and upper limits obtained for IRX with the two values of FIR luminosity identify a relatively large region for both JADES_954 and CEERS_397, whereas the two values are close to each other for JADES_1146115. The latter is also the source with the largest attenuation, as determined from the narrow Balmer decrement. In all three cases, the region spanned by the upper and lower limit of the IRX is above the track corresponding to the Calzetti et al. (2000) attenuation law, and is located in a region where usually sources show a displacement between the UV and FIR emitting regions (see Bowler et al., 2024; Villanueva et al., 2024). More precisely, according to the predictions by Popping et al. (2017), this is a region of the IRX- plane where the UV emission might be partially screened due to the presence of ”holes” in the dust screening medium. In particular, JADES_954 and CEERS_397 are compatible with dust-free emission fractions ranging from 20% to 100%. Instead, the position of JADES_1146115 is compatible with lower non-obscured fractions, i.e., ¡5%-10%. This result suggests that the upper limits derived from the NOEMA observations indicate a complex geometry or a patchy distribution of the dust relative to the rest-UV emission, which is rather unexpected given the small sizes of the sources (see Sect. 2.1). While the current non-detections do not allow any further investigation, we caution that deviations in the IRX- diagram towards the bluer, upper part of the parameter space have also been differently interpreted. In particular, Popping et al. (2017) showed that an increased level of turbulence in the screen of dust can lead to lower values for both and IRX, such that galaxies move towards locations in the IRX– plane above the relation for a uniform dust screen (so that for a fixed IRX, galaxies become bluer). A similar IRX parameter space can also be reproduced by stars mixed in between the screen of dust (rather than placed in front of it), even though in this case the slopes are expected to be redder (see Goldader et al., 2002; Nordon et al., 2013). In particular, the extreme position of JADES_1146115 is hard to interpret without accounting for a patchy dust distribution.
4 Conclusion
In this work, we performed an in-depth analysis of the implications of the mm non-detections of three JWST-discovered Type I AGN at observed for h with NOEMA targeting [C ii]. JADES_1146115 and JADES_954 are LRDs, while CEERS_00397 is a blue Type I AGN. In the analysis, we leveraged multi-wavelength information from: the JWST/PRISM spectra, which provide optimal characterization of the rest-frame UV and optical continuum; the MIRI images, which provide useful constraints in the rest-frame NIR and MIR; and the NOEMA data, which constrain the FIR SED and the gas properties. The main results are summarized as follows:
-
•
No [C ii] emission is detected in our targets, also after stacking their spectra. We estimated a 3 upper limit on the [C ii] emission, which locates them below the most conservative [C ii] -SFR relation derived from Schaerer et al. (2020). These non-detections might be due to an overestimation of the sources’ SFRs, to AGN ionizing radiation, or to density or metallicity effects. In the first scenario to reconcile the [C ii] upper limits with the scaling relations a contribution of the AGN to the narrow H line is needed, also for the two LRDs.
-
•
From the [C ii] non-detections, we derived conservative upper limits of the host galaxy gas masses of M⊙ and of their dust masses of M⊙, consistent with what was found by other works performing stacking analysis. Using a modified blackbody model to fit the continuum non-detections, we instead found slightly larger upper limits on the dust mass M⊙.
-
•
The three sources are also undetected in the 158m continuum, also after stacking their maps. We performed a detailed SED-fitting analysis using NOEMA, MIRI, and NIRSpec data and derived revised physical properties for the three sources. We find host galaxy stellar mass 2 dex lower than reported in the literature for JADES_954 and 0.7 dex lower for CEERS_00397, while consistent with previous results for JADES_1146115. Using our new stellar mass estimates together with BH mass estimates from locally calibrated scaling relations, we found for JADES_954, JADES_1146115, and CEERS_00397, respectively. Despite the large uncertainties affecting these estimates, these findings suggest that our targets host overmassive BHs.
-
•
The SED fitting decomposition predicts the AGN emission of CEERS_397 to be consistent with that of a blue Type I AGN, but subdominant compared to stellar emission. Instead, for the two LRDs, their peculiar SED shapes can be explained by star formation in the rest-UV and by a Type I AGN accretion disk obscured in the polar direction, in the rest-optical and NIR. This ‘classical’ AGN configuration can explain the flat optical-NIR slope (observed in many LRDs), and its expected emission is very similar to the one predicted by the dense gas envelope characterizing the BH-star model. Our SED decompositions returned AGN bolometric luminosities consistent with those predicted by scaling relations based on H luminosity. Our analysis suggests that the interpretation of the observed properties of high AGN discovered by JWST (including LRDs) is diverse, and different physical models may need to be considered to explain the data.
-
•
We placed our targets in the IRX- plane, finding that they occupy a region were sources might be characterized by complex and patchy geometries between the dust and the UV emitting region.
The upper limits on [C ii] obtained through our NOEMA observations provided important constraints on the physical properties of our targets, both on the gas and dust content of their host galaxies and on their AGN emission. Yet deeper observations, or larger stack experiments, may be required to detect such distant, compact AGN with observations to finally provide a clear and unbiased view of their host galaxies.
Acknowledgements.
We thank Gan Luo for the help in the reduction of the NOEMA data. We acknowledge useful conversations with Christina Eilers, Gene Leung, Roberto Gilli, Marcella Brusa and Marco Mignoli. GM and HÜ acknowledge funding by the European Union (ERC APEX, 101164796). HÜ thanks the Max Planck Society for support through the Lise Meitner Excellence Program. NMFS, GT, JC, CB, JME, CP, LL acknowledge funding by the European Union (ERC, GALPHYS, 101055023). AJB acknowledges funding from the “FirstGalaxies” Advanced Grant from the European Research Council (ERC) under the European Union’s Horizon 2020 research and innovation program (Grant agreement No. 789056).MP acknowledges support through the grants PID2021-127718NB-I00, PID2024-159902NA-I00, and RYC2023-044853-I, funded by the Spain Ministry of Science and Innovation/State Agency of Research MCIN/AEI/10.13039/501100011033 and El Fondo Social Europeo Plus FSE+. EB acknowledges funding from INAF “Ricerca Fondamentale 2024” (GO grant “A JWST/MIRI MIRACLE: Mid-IR Activity of Circumnuclear Line Emission” and mini-grant 1.05.24.07.01). TN acknowledges support from the Deutsche Forschungsgemeinschaft (DFG, German Research Foundation) under Germany’s Excellence Strategy - EXC-2094 - 390783311 from the DFG Cluster of Excellence ”ORIGINS”. Views and opinions expressed are those of the authors only and do not necessarily reflect those of the European Union or the European Research Council Executive Agency. Neither the European Union nor the granting authority can be held responsible for them.References
- Tentative detection of neutral gas in a Little Red Dot at . arXiv e-prints, pp. arXiv:2503.00998. External Links: Document, 2503.00998, ADS entry Cited by: §1, Figure 3.
- COSMOS-Web: The Overabundance and Physical Nature of “Little Red Dots”—Implications for Early Galaxy and SMBH Assembly. ApJ 991 (1), pp. 37. External Links: Document, 2406.10341, ADS entry Cited by: §1, §1, §3.5.
- SMILES Initial Data Release: Unveiling the Obscured Universe with MIRI Multiband Imaging. ApJ 976 (2), pp. 224. External Links: Document, 2405.15972, ADS entry Cited by: §2.1.1.
- How much gas and dust is in the Lyman Break Galaxy HZ10? An ALMA Band 10 to 4 and JWST/NIRSpec study of its interstellar medium. arXiv e-prints, pp. arXiv:2512.02320. External Links: Document, 2512.02320, ADS entry Cited by: footnote 4.
- X-Ray View of Little Red Dots: Do They Host Supermassive Black Holes?. ApJ 969 (1), pp. L18. External Links: Document, 2404.19010, ADS entry Cited by: §1.
- Connecting the Dots: UV-Bright Companions of Little Red Dots as Lyman-Werner Sources Enabling Direct Collapse Black Hole Formation. arXiv e-prints, pp. arXiv:2602.02702. External Links: Document, 2602.02702, ADS entry Cited by: Appendix A.
- The Small Sizes and High Implied Densities of “Little Red Dots” with Balmer Breaks Could Explain Their Broad Emission Lines without an Active Galactic Nucleus. ApJ 977 (1), pp. L13. External Links: Document, 2408.07745, ADS entry Cited by: §1.
- The ALPINE-ALMA [CII] survey: double stellar population and AGN activity in a galaxy at . arXiv e-prints, pp. arXiv:2212.00038. External Links: 2212.00038, ADS entry Cited by: Appendix A, §3.2.
- The Fundamental Planes of black hole activity for radio-loud and radio-quiet quasars. MNRAS 513 (4), pp. 4673–4681. External Links: Document, 2201.04666, ADS entry Cited by: §1.
- From “The Cliff” to “Virgil”: Mapping the Spectral Diversity of Little Red Dots with JWST/NIRSpec. arXiv e-prints, pp. arXiv:2512.15853. External Links: Document, 2512.15853, ADS entry Cited by: §1.
- 350 m Dust Emission from High-Redshift Quasars. ApJ 642 (2), pp. 694–701. External Links: Document, astro-ph/0603121, ADS entry Cited by: footnote 4.
- The ALPINE-ALMA [CII] survey: Data processing, catalogs, and statistical source properties. A&A 643, pp. A2. External Links: Document, 2002.00962, ADS entry Cited by: Figure 3.
- The ALPINE-ALMA [CII] survey: Data processing, catalogs, and statistical source properties. A&A 643, pp. A2. External Links: Document, 2002.00962, ADS entry Cited by: Appendix A.
- The Origin of the [C II] Deficit in a Simulated Dwarf Galaxy Merger-driven Starburst. ApJ 934 (2), pp. 115. External Links: Document, 2205.08905, ADS entry Cited by: §3.2.
- Accreting supermassive black holes in the COSMOS field and the connection to their host galaxies. MNRAS 427 (4), pp. 3103–3133. External Links: Document, 1209.1640, ADS entry Cited by: Appendix B, §3.5.
- A close look at the black hole masses and hot dusty toruses of the first quasars with MIRI-MRS. arXiv e-prints, pp. arXiv:2511.02902. External Links: Document, 2511.02902, ADS entry Cited by: §1.
- The ALMA REBELS survey: obscured star formation in massive Lyman-break galaxies at z= 4-8 revealed by the IRX- and M⋆ relations. MNRAS 527 (3), pp. 5808–5828. External Links: Document, 2309.17386, ADS entry Cited by: Figure 5, §3.3, §3.7.
- astropy/photutils: 2.3.0 External Links: Document, ADS entry Cited by: §2.1.
- The Little Blue and Red Dots Rosetta Stones: Non-Gaussian broad lines, hot dust, and X-ray weakness. arXiv e-prints, pp. arXiv:2601.22214. External Links: Document, 2601.22214, ADS entry Cited by: §1, §3.2.
- Stellar population synthesis at the resolution of 2003. MNRAS 344, pp. 1000–1028. External Links: ADS entry, Document, astro-ph/0309134 Cited by: Table 4, Appendix B.
- Spectroscopy with the JWST Advanced Deep Extragalactic Survey (JADES) - the NIRSpec/NIRCAM GTO galaxy evolution project. In Uncovering Early Galaxy Evolution in the ALMA and JWST Era, E. da Cunha, J. Hodge, J. Afonso, L. Pentericci, and D. Sobral (Eds.), IAU Symposium, Vol. 352, pp. 342–346. External Links: Document, 2112.15207, ADS entry Cited by: §2.1.2.
- On the agn nature of broad balmer emission in four low-redshift metal-poor galaxies. Monthly Notices of the Royal Astronomical Society 504 (1), pp. 543–550. External Links: Document Cited by: §1.
- The Dust Content and Opacity of Actively Star-forming Galaxies. ApJ 533, pp. 682–695. External Links: ADS entry, Document, astro-ph/9911459 Cited by: §3.7.
- Cool Gas in High-Redshift Galaxies. Annual Review of Astronomy and Astrophysics 51, pp. 105–161. External Links: ADS entry, Document, 1301.0371 Cited by: §3.2.
- How to measure galaxy star formation histories. ii. non-parametric models. The Astrophysical Journal 873 (1), pp. 44. External Links: Document Cited by: §2.1.2.
- Missing [C II] emission from early galaxies. MNRAS 499 (4), pp. 5136–5150. External Links: Document, 2006.09402, ADS entry Cited by: §3.2.
- AGN feedback on molecular gas reservoirs in quasars at z 2.4. A&A 605, pp. A105. External Links: Document, 1706.08987, ADS entry Cited by: §3.3.
- An Upper Limit of 106 M⊙ in Dust from ALMA Observations in 60 Little Red Dots. ApJ 990 (2), pp. L61. External Links: Document, 2505.18873, ADS entry Cited by: §1, §3.3.
- Dust in Little Red Dots. ApJ 975 (1), pp. L4. External Links: Document, 2407.05094, ADS entry Cited by: §1, §3.5.
- Galactic Stellar and Substellar Initial Mass Function. Publications of the Astronomical Society of the Pacific 115, pp. 763–795. External Links: ADS entry, Document, astro-ph/0304382 Cited by: Table 4, Appendix B.
- Impact of Resonance, Raman, and Thomson Scattering on Hydrogen Line Formation in Little Red Dots. MNRAS. External Links: Document, 2508.08768, ADS entry Cited by: §1.
- JWST-discovered AGN: evidence for heavy obscuration in the type-2 sample from the first stacked X-ray detection. arXiv e-prints, pp. arXiv:2510.00112. External Links: Document, 2510.00112, ADS entry Cited by: §1.
- Infrared emission from z 6.5 quasar host galaxies: a direct estimate of dust physical properties. A&A 706, pp. A285. External Links: Document, 2512.03143, ADS entry Cited by: §3.3.
- A deep 1.4 GHz survey of the J1030 equatorial field: A new window on radio source populations across cosmic time. A&A 668, pp. A133. External Links: Document, 2210.15595, ADS entry Cited by: §1.
- JADES and BlackTHUNDER: rest-frame Balmer-line absorption and the local environment in a Little Red Dot at z = 5. MNRAS 545 (3), pp. staf2117. External Links: Document, 2506.14870, ADS entry Cited by: §1, §2.1.1.
- Irony at z=6.68: a bright AGN with forbidden Fe emission and multi-component Balmer absorption. arXiv e-prints, pp. arXiv:2510.00101. External Links: Document, 2510.00101, ADS entry Cited by: §3.2, §3.5.
- Little Red Dots host Black Hole Stars: A unified family of gas-reddened AGN revealed by JWST/NIRSpec spectroscopy. arXiv e-prints, pp. arXiv:2511.21820. External Links: Document, 2511.21820, ADS entry Cited by: §1, §1, §2.1, §3.5.
- A remarkable ruby: Absorption in dense gas, rather than evolved stars, drives the extreme Balmer break of a little red dot at z = 3.5. A&A 701, pp. A168. External Links: Document, 2503.16600, ADS entry Cited by: §1.
- A comprehensive view of the interstellar medium in a quasar host galaxy at z 6.4. A&A 673, pp. A157. External Links: Document, 2302.04312, ADS entry Cited by: §3.1.
- Active galactic nuclei-heated dust revealed in “little red dots”. A&A 704, pp. A313. External Links: Document, 2509.07100, ADS entry Cited by: §1.
- Andromeda’s Dust. ApJ 780 (2), pp. 172. External Links: Document, 1306.2304, ADS entry Cited by: Table 4, Appendix B, §3.4.
- Dust Masses, PAH Abundances, and Starlight Intensities in the SINGS Galaxy Sample. ApJ 663 (2), pp. 866–894. External Links: Document, astro-ph/0703213, ADS entry Cited by: §3.3, §3.4.
- Universal bolometric corrections for active galactic nuclei over seven luminosity decades. A&A 636, pp. A73. External Links: Document, 2001.09984, ADS entry Cited by: §1.
- Overview of the JWST Advanced Deep Extragalactic Survey (JADES). arXiv e-prints, pp. arXiv:2306.02465, submitted to ApJ Supplement. External Links: Document, 2306.02465, ADS entry Cited by: §2.1.2.
- Spectral Energy Distributions of Type 1 Active Galactic Nuclei in the COSMOS Survey. I. The XMM-COSMOS Sample. ApJ 759 (1), pp. 6. External Links: Document, 1209.1478, ADS entry Cited by: §3.5.
- The ALPINE-ALMA [C II] Survey: Multiwavelength Ancillary Data and Basic Physical Measurements. ApJS 247 (2), pp. 61. External Links: Document, 1912.01621, ADS entry Cited by: §2.2.
- The 2013 Release of Cloudy. Rev. Mexicana Astron. Astrofis. 49, pp. 137–163. External Links: Document, 1302.4485, ADS entry Cited by: Appendix B.
- The Cosmic Evolution Early Release Science Survey (CEERS). ApJ 983 (1), pp. L4. External Links: Document, 2501.04085, ADS entry Cited by: §2.1.3.
- PHIBSS2: survey design and z = 0.5 - 0.8 results. Molecular gas reservoirs during the winding-down of star formation. A&A 622, pp. A105. External Links: Document, 1812.08180, ADS entry Cited by: Appendix A, §3.3.
- Revisiting the infrared spectra of active galactic nuclei with a new torus emission model. MNRAS 366 (3), pp. 767–786. External Links: Document, astro-ph/0511428, ADS entry Cited by: Appendix B.
- A high black-hole-to-host mass ratio in a lensed AGN in the early Universe. Nature 628 (8006), pp. 57–61. External Links: Document, 2308.05735, ADS entry Cited by: §1.
- Combined CO and Dust Scaling Relations of Depletion Time and Molecular Gas Fractions with Cosmic Time, Specific Star-formation Rate, and Stellar Mass. ApJ 800, pp. 20. External Links: ADS entry, Document, 1409.1171 Cited by: §3.3.
- Another Piece to the Puzzle: Radio Detection of a JWST-detected Active Galactic Nucleus Candidate. ApJ 986 (2), pp. 130. External Links: Document, 2501.04912, ADS entry Cited by: §1.
- Far-Infrared Galaxies in the Far-Ultraviolet. ApJ 568 (2), pp. 651–678. External Links: Document, astro-ph/0112352, ADS entry Cited by: §3.7.
- VENUS: When Red meets Blue – A multiply imaged Little Red Dot with an apparent blue companion behind the galaxy cluster Abell 383. arXiv e-prints, pp. arXiv:2512.02117. External Links: Document, 2512.02117, ADS entry Cited by: Appendix A, §1, Figure 3.
- A Quantitative Comparison of the Small Magellanic Cloud, Large Magellanic Cloud, and Milky Way Ultraviolet to Near-Infrared Extinction Curves. ApJ 594 (1), pp. 279–293. External Links: Document, astro-ph/0305257, ADS entry Cited by: §2.1.1.
- On the AGN Nature of Two UV-bright Sources at zspec 5.5 in the CANDELS Fields: An Update on the AGN Space Density at M1450 -22.5. ApJ 897 (1), pp. 94. External Links: Document, 2006.02451, ADS entry Cited by: §3.2.
- UNCOVER Spectroscopy Confirms the Surprising Ubiquity of Active Galactic Nuclei in Red Sources at z ¿ 5. ApJ 964 (1), pp. 39. External Links: Document, 2309.05714, ADS entry Cited by: §1, §1.
- What you see is what you get: empirically measured bolometric luminosities of Little Red Dots. arXiv e-prints, pp. arXiv:2509.05434. External Links: Document, 2509.05434, ADS entry Cited by: §1, §3.5.
- An Investigation Into The Selection and Colors of Little Red Dots and Active Galactic Nuclei. arXiv e-prints, pp. arXiv:2410.00100. External Links: Document, 2410.00100, ADS entry Cited by: §1.
- A JWST/NIRSpec First Census of Broad-line AGNs at z = 4-7: Detection of 10 Faint AGNs with M BH 106-108 M ⊙ and Their Host Galaxy Properties. ApJ 959 (1), pp. 39. External Links: Document, 2303.11946, ADS entry Cited by: §1, §2.1.3, §2.1, §3.3, footnote 1.
- SHINING, A Survey of Far-infrared Lines in Nearby Galaxies. II. Line-deficit Models, AGN Impact, [C II]-SFR Scaling Relations, and Mass-Metallicity Relation in (U)LIRGs. ApJ 861 (2), pp. 95. External Links: Document, 1803.04422, ADS entry Cited by: Figure 3, §3.2, §3.2, §3.2.
- The early Universe with JWST and ALMA. Nature Astronomy 10, pp. 34–41. External Links: Document, 2601.04314, ADS entry Cited by: §1.
- Intrinsic absorption lines in ngc 4151. The Astronomical Journal 124, pp. 2543–2553. External Links: Document Cited by: §1.
- RUBIES: A spectroscopic census of little red dots: All point sources with v-shaped continua have broad lines. A&A 702, pp. A57. External Links: Document, 2506.05459, ADS entry Cited by: §1, §1, §2.1.
- A Critical Evaluation of the Physical Nature of the Little Red Dots. arXiv e-prints, pp. arXiv:2512.03130. External Links: Document, 2512.03130, ADS entry Cited by: §1, §3.2.
- Extremely Dense Gas around Little Red Dots and High-redshift AGNs: A Non-stellar Origin of the Balmer Break and Absorption Features. arXiv e-prints, pp. arXiv:2409.07805. External Links: Document, 2409.07805, ADS entry Cited by: §1, §3.5.
- BlackTHUNDER ─ A non-stellar Balmer break in a black hole-dominated little red dot at z = 7.04. MNRAS 544 (4), pp. 3900–3935. External Links: Document, 2501.13082, ADS entry Cited by: §1, §3.5.
- GA-NIFS: an extremely nitrogen-loud and chemically stratified galaxy at z 5.55. MNRAS 535 (1), pp. 881–908. External Links: Document, 2404.04148, ADS entry Cited by: Appendix A.
- Stellar population inference with prospector. The Astrophysical Journal Supplement Series 254 (2), pp. 22. External Links: Document Cited by: §2.1.2.
- The Relationship at : Big Black Holes in Little Red Dots. arXiv e-prints, pp. arXiv:2510.07376. External Links: Document, 2510.07376, ADS entry Cited by: §1.
- JADES - the Rosetta stone of JWST-discovered AGN: deciphering the intriguing nature of early AGN. MNRAS 535 (1), pp. 853–873. External Links: Document, 2407.08643, ADS entry Cited by: §1.
- JADES: comprehensive census of broad-line AGN from Reionization to Cosmic Noon revealed by JWST. arXiv e-prints, pp. arXiv:2504.03551. External Links: Document, 2504.03551, ADS entry Cited by: §1, §2.1.2.
- A dormant, overmassive black hole in the early Universe. arXiv e-prints, pp. arXiv:2403.03872, accepted for publication on Nature. External Links: Document, 2403.03872, ADS entry Cited by: §2.1.2, §2.1.2, §2.1, §3.3, §3.4, footnote 1.
- A direct black hole mass measurement in a Little Red Dot at the Epoch of Reionization. arXiv e-prints, pp. arXiv:2508.21748. External Links: Document, 2508.21748, ADS entry Cited by: §1.
- Star Formation in the Milky Way and Nearby Galaxies. ARA&A 50, pp. 531–608. External Links: Document, 1204.3552, ADS entry Cited by: §2.2, §3.2, §3.2, footnote 1.
- Black hole envelopes in Little Red Dots. MNRAS 544 (4), pp. 3407–3416. External Links: Document, 2505.06965, ADS entry Cited by: §1, §3.5.
- Highly-ionized gas in lensed z = 6.027 Little Red Dot seen through [OIII] 88m with ALMA. arXiv e-prints, pp. arXiv:2512.05097. External Links: Document, 2512.05097, ADS entry Cited by: §1.
- [C II] emission in z 6 strongly lensed, star-forming galaxies. MNRAS 462 (1), pp. L6–L10. External Links: Document, 1603.02277, ADS entry Cited by: Appendix A, Figure 3.
- The Rise of Faint, Red AGN at : A Sample of Little Red Dots in the JWST Extragalactic Legacy Fields. arXiv e-prints, pp. arXiv:2404.03576. External Links: Document, 2404.03576, ADS entry Cited by: §1, §2.1.1.
- UNCOVER: A NIRSpec Identification of a Broad-line AGN at z = 8.50. ApJ 957 (1), pp. L7. External Links: Document, 2308.11610, ADS entry Cited by: §1.
- Coevolution (Or Not) of Supermassive Black Holes and Host Galaxies. ARA&A 51 (1), pp. 511–653. External Links: Document, 1304.7762, ADS entry Cited by: §1.
- UNCOVER: Candidate Red Active Galactic Nuclei at 3 ¡ z ¡ 7 with JWST and ALMA. ApJ 978 (1), pp. 92. External Links: Document, 2306.07320, ADS entry Cited by: §1.
- UNCOVER: Candidate Red Active Galactic Nuclei at 3 ¡ z ¡ 7 with JWST and ALMA. ApJ 978 (1), pp. 92. External Links: Document, 2306.07320, ADS entry Cited by: §1.
- The Case for Super-Eddington Accretion: Connecting Weak X-ray and UV Line Emission in JWST Broad-Line AGN During the First Gyr of Cosmic Time. arXiv e-prints, pp. arXiv:2409.13047. External Links: Document, 2409.13047, ADS entry Cited by: §3.2.
- [C ii] emission from galactic nuclei in the presence of X-rays. A&A 580, pp. A5. External Links: Document, 1505.02777, ADS entry Cited by: §3.2, §3.2.
- The ALPINE-ALMA [CII] survey. Survey strategy, observations, and sample properties of 118 star-forming galaxies at 4 ¡ z ¡ 6. A&A 643, pp. A1. External Links: Document, 1910.09517, ADS entry Cited by: §2.2.
- Complete Infrared Spectral Energy Distributions of Millimeter Detected Quasars at z ¿ 5. ApJ 772 (2), pp. 103. External Links: Document, 1305.3999, ADS entry Cited by: footnote 4.
- Spectral Energy Distributions of QSOs at z ¿ 5: Common Active Galactic Nucleus-heated Dust and Occasionally Strong Star-formation. ApJ 785 (2), pp. 154. External Links: Document, 1402.5976, ADS entry Cited by: footnote 4.
- The CO-to-H2 Conversion Factor from Infrared Dust Emission across the Local Group. ApJ 737 (1), pp. 12. External Links: Document, 1102.4618, ADS entry Cited by: §3.3.
- The Discovery of Little Red Dots in the Local Universe: Signatures of Cool Gas Envelopes. ApJ 997 (2), pp. 364. External Links: Document, 2507.10659, ADS entry Cited by: §1, §2.1.1.
- The Balmer Break and Optical Continuum of Little Red Dots from Super-Eddington Accretion. ApJ 994 (1), pp. 113. External Links: Document, 2507.07190, ADS entry Cited by: §3.5.
- A big red dot at cosmic noon. A&A 703, pp. A36. External Links: Document, 2506.12141, ADS entry Cited by: §1.
- The miniJPAS survey: AGN and host galaxy coevolution of X-ray-selected sources. A&A 672, pp. A137. External Links: Document, 2302.01358, ADS entry Cited by: Appendix B.
- Bolometric luminosities and Eddington ratios of X-ray selected active galactic nuclei in the XMM-COSMOS survey. MNRAS 425 (1), pp. 623–640. External Links: Document, 1206.2642, ADS entry Cited by: §1, §3.5.
- The far-infrared emitting region in local galaxies and QSOs: Size and scaling relations. A&A 591, pp. A136. External Links: Document, 1511.02075, ADS entry Cited by: §3.2.
- Polar Dust, Nuclear Obscuration, and IR SED Diversity in Type-1 AGNs. ApJ 866 (2), pp. 92. External Links: Document, 1809.03080, ADS entry Cited by: §3.5.
- Little Red Dots as Obscured Little Blue Dots: A Super-Eddington Unification Model. arXiv e-prints, pp. arXiv:2602.22386. External Links: Document, 2602.22386, ADS entry Cited by: §3.5.
- JWST meets Chandra: a large population of Compton thick, feedback-free, and intrinsically X-ray weak AGN, with a sprinkle of SNe. MNRAS 538 (3), pp. 1921–1943. External Links: Document, 2405.00504, ADS entry Cited by: §1, §3.2.
- JADES: The diverse population of infant black holes at 4 ¡ z ¡ 11: Merging, tiny, poor, but mighty. A&A 691, pp. A145. External Links: Document, 2308.01230, ADS entry Cited by: §1, §2.1.1, §2.1, §3.2, §3.3, §3.4, footnote 1.
- Little Red Dots: An Abundant Population of Faint Active Galactic Nuclei at z 5 Revealed by the EIGER and FRESCO JWST Surveys. ApJ 963 (2), pp. 129. External Links: Document, 2306.05448, ADS entry Cited by: Appendix A, §1, §1, §2.1.1.
- The radio properties of the JWST-discovered AGN. A&A 706, pp. A372. External Links: Document, 2412.04224, ADS entry Cited by: §1, §3.1.
- Radio selection of heavily obscured AGN in the J1030 field: unraveling a missing Compton-thick population. arXiv e-prints, pp. arXiv:2603.10176. External Links: Document, 2603.10176, ADS entry Cited by: Appendix B.
- Narrow line AGN selection in CEERS: spectroscopic selection, physical properties, X-ray and radio analysis. arXiv e-prints, pp. arXiv:2408.15615. External Links: Document, 2408.15615, ADS entry Cited by: Appendix B, §1, §3.2.
- Overmassive black holes in the early Universe can be explained by gas-rich, dark matter-dominated galaxies. MNRAS 545 (1), pp. staf2092. External Links: Document, 2506.13852, ADS entry Cited by: §3.3.
- Constraining the Total Infrared Luminosites of the Most Luminous Little Red Dots. In PRIMA General Observer Science Book Volume 2, A. Moullet, D. Burgarella, T. Kataria, H. Beuther, C. Battersby, M. Cheng, T. Essinger-Hileman, H. Inami, E. Mills, T. Nagao, and S. Unwin (Eds.), Vol. 2, pp. 196–199. External Links: ADS entry Cited by: §3.5.
- Dust Absorption and the Ultraviolet Luminosity Density at z ~3 as Calibrated by Local Starburst Galaxies. ApJ 521 (1), pp. 64–80. External Links: Document, astro-ph/9903054, ADS entry Cited by: Figure 5, §3.7.
- Obscured AGN at 1.5 ¡ z ¡ 3.0 from the zCOSMOS-deep Survey . I. Properties of the emitting gas in the narrow-line region. A&A 626, pp. A9. External Links: Document, 1903.11085, ADS entry Cited by: §3.2.
- Enhanced Subkiloparsec-scale Star Formation: Results from a JWST Size Analysis of 341 Galaxies at 5 ¡ z ¡ 14. ApJ 963 (1), pp. 9. External Links: Document, 2308.05018, ADS entry Cited by: §2.1.
- PRIMA General Observer Science Book Volume 2. Vol. 2. External Links: Document, ADS entry Cited by: §3.5.
- Comparison of the star formation in X-ray-selected AGN in eFEDS with that of star-forming galaxies. A&A 663, pp. A130. External Links: Document, 2205.01451, ADS entry Cited by: Appendix B.
- A “Black Hole Star” Reveals the Remarkable Gas-Enshrouded Hearts of the Little Red Dots. arXiv e-prints, pp. arXiv:2503.16596. External Links: Document, 2503.16596, ADS entry Cited by: §1, §3.5.
- The Dual Nature of GHZ9: Coexisting Active Galactic Nuclei and Star Formation Activity in a Remote X-Ray Source at z = 10.145. ApJ 989 (1), pp. 75. External Links: Document, 2410.18763, ADS entry Cited by: §1.
- A physical model for the [C II]-FIR deficit in luminous galaxies. MNRAS 467 (1), pp. 50–67. External Links: Document, 1601.05803, ADS entry Cited by: §3.2.
- Evidence of violation of Case B recombination in Little Red Dots. arXiv e-prints, pp. arXiv:2510.06362. External Links: Document, 2510.06362, ADS entry Cited by: §3.5.
- The Far-infrared, UV, and Molecular Gas Relation in Galaxies up to z = 2.5. ApJ 762 (2), pp. 125. External Links: Document, 1211.5770, ADS entry Cited by: §3.7.
- JWST CEERS and JADES Active Galaxies at z = 4-7 Violate the Local M •-M ⋆ Relation at ¿3: Implications for Low-mass Black Holes and Seeding Models. ApJ 957 (1), pp. L3. External Links: Document, 2308.12331, ADS entry Cited by: §1.
- pysersic: A Python package for determining galaxy structural properties via Bayesian inference, accelerated with jax. The Journal of Open Source Software 8 (89), pp. 5703. External Links: Document, 2306.05454, ADS entry Cited by: §2.1.
- The CO Luminosity Density at High-z (COLDz) Survey: A Sensitive, Large-area Blind Search for Low-J CO Emission from Cold Gas in the Early Universe with the Karl G. Jansky Very Large Array. ApJ 864 (1), pp. 49. External Links: Document, 1808.04372, ADS entry Cited by: Appendix A.
- Interstellar Dust from the Milky Way to the Magellanic Clouds. ApJ 395, pp. 130. External Links: Document, ADS entry Cited by: Table 4, Appendix B.
- Tracing the Reionization Epoch with ALMA: [C II] Emission in z 7 Galaxies. ApJ 829 (1), pp. L11. External Links: Document, 1608.08837, ADS entry Cited by: Appendix A.
- Updated point spread function simulations for JWST with WebbPSF. In Space Telescopes and Instrumentation 2014: Optical, Infrared, and Millimeter Wave, J. M. Oschmann, M. Clampin, G. G. Fazio, and H. A. MacEwen (Eds.), Society of Photo-Optical Instrumentation Engineers (SPIE) Conference Series, Vol. 9143, pp. 91433X. External Links: Document, ADS entry Cited by: §2.1.
- Novel auroral line measurements extend the gradual offset of the FMR deep into the first Gyr of cosmic time. arXiv e-prints, pp. arXiv:2506.15779. External Links: Document, 2506.15779, ADS entry Cited by: §3.2.
- Dissecting the IRX- dust attenuation relation: exploring the physical origin of observed variations in galaxies. MNRAS 472 (2), pp. 2315–2333. External Links: Document, 1706.06587, ADS entry Cited by: §3.7.
- Hydrodynamic simulations of the Disc of Gas Around Supermassive black holes (HDGAS) – II. The transition from neutral atomic to molecular gas phases. MNRAS 539 (2), pp. 1516–1527. External Links: Document, 2504.01776, ADS entry Cited by: §3.2.
- The HDUV Survey: A Revised Assessment of the Relationship between UV Slope and Dust Attenuation for High-redshift Galaxies. ApJ 853 (1), pp. 56. External Links: Document, 1705.09302, ADS entry Cited by: Figure 5.
- Dwarf Galaxies with Optical Signatures of Active Massive Black Holes. ApJ 775 (2), pp. 116. External Links: Document, 1308.0328, ADS entry Cited by: §3.4.
- Relations between Central Black Hole Mass and Total Galaxy Stellar Mass in the Local Universe. ApJ 813 (2), pp. 82. External Links: Document, 1508.06274, ADS entry Cited by: §1, §2.1.1, §2.1, §3.4.
- Gas-to-dust mass ratios in local galaxies over a 2 dex metallicity range. A&A 563, pp. A31. External Links: Document, 1312.3442, ADS entry Cited by: §3.3.
- Not Just a Dot: The Complex UV Morphology and Underlying Properties of Little Red Dots. ApJ 992 (1), pp. 71. External Links: Document, 2411.14383, ADS entry Cited by: Appendix A, §2.1.1, §3.2.
- Beyond the Dot: an LRD-like nucleus at the Heart of an IR-Bright Galaxy and its implications for high-redshift LRDs. arXiv e-prints, pp. arXiv:2507.17738. External Links: Document, 2507.17738, ADS entry Cited by: Appendix A, §3.2.
- Molecular gas and dust properties in z ¿ 7 quasar hosts. A&A 695, pp. A23. External Links: Document, 2412.02688, ADS entry Cited by: §1.
- Hitting the slopes: A spectroscopic view of UV continuum slopes of galaxies reveals a reddening at z ¿ 9.5. arXiv e-prints, pp. arXiv:2411.14532. External Links: Document, 2411.14532, ADS entry Cited by: §2.1.3, Figure 5.
- The ALPINE-ALMA [C II] survey. Little to no evolution in the [C II]-SFR relation over the last 13 Gyr. A&A 643, pp. A3. External Links: Document, 2002.00979, ADS entry Cited by: §2.2, Figure 3, §3.2, §3.2, §3.2, 1st item.
- Towards a physical model of dust tori in Active Galactic Nuclei. Radiative transfer calculations for a hydrostatic torus model. A&A 437 (3), pp. 861–881. External Links: Document, astro-ph/0504105, ADS entry Cited by: Appendix B.
- Discovery of Strong Balmer Line Absorption in Two Luminous LoBAL Quasars at z 1.5. ApJ 853 (2), pp. 167. External Links: Document, 1710.08563, ADS entry Cited by: §1.
- Little Red Dots at an Inflection Point: Ubiquitous V-shaped Turnover Consistently Occurs at the Balmer Limit. ApJ 995 (1), pp. 118. External Links: Document, 2411.03424, ADS entry Cited by: §1.
- A confirmed deficit of hot and cold dust emission in the most luminous Little Red Dots. arXiv e-prints, pp. arXiv:2503.02059. External Links: Document, 2503.02059, ADS entry Cited by: §1, §1, §3.5.
- JWST/NIRSpec Balmer-line Measurements of Star Formation and Dust Attenuation at z 3-6. ApJ 954 (2), pp. 157. External Links: Document, 2301.03241, ADS entry Cited by: §3.2.
- The Redshifted Hydrogen Balmer and Metastable He 1 Absorption Line System in Mini-FeLoBAL Quasar SDSS J112526.12+002901.3: A Parsec-scale Accretion Inflow?. ApJ 829 (2), pp. 96. External Links: Document, 1608.05487, ADS entry Cited by: §1.
- The Close AGN Reference Survey (CARS). Discovery of a global [C II] 158 m line excess in AGN HE 1353-1917. A&A 626, pp. L3. External Links: Document, ADS entry Cited by: §3.2.
- Warm dust in high-z galaxies: origin and implications. MNRAS 497 (1), pp. 956–968. External Links: Document, 2004.09528, ADS entry Cited by: §3.3.
- The ALMA REBELS Survey: cosmic dust temperature evolution out to z 7. MNRAS 513 (3), pp. 3122–3135. External Links: Document, 2202.01227, ADS entry Cited by: §3.3, §3.3.
- The dust covering factor in active galactic nuclei. MNRAS 458 (3), pp. 2288–2302. External Links: Document, 1602.06954, ADS entry Cited by: Table 4, Appendix B, §3.5.
- Type 1 AGN at low z- I. Emission properties. MNRAS 423 (1), pp. 600–631. External Links: Document, 1203.3158, ADS entry Cited by: §2.1.
- The Evolution of the Star-Forming Interstellar Medium Across Cosmic Time. ARA&A 58, pp. 157–203. External Links: Document, 2003.06245, ADS entry Cited by: §3.3.
- Broad-Line AGN at : The Black Hole Mass Function and a Connection with Little Red Dots. arXiv e-prints, pp. arXiv:2409.06772. External Links: Document, 2409.06772, ADS entry Cited by: §1.
- Dust Attenuation, Star Formation, and Metallicity in z 2-3 Galaxies from KBSS-MOSFIRE. ApJ 871 (1), pp. 128. External Links: Document, 1805.00016, ADS entry Cited by: §3.2.
- The warm outer layer of a Little Red Dot as the source of [Fe II] and collisional Balmer lines with scattering wings. arXiv e-prints, pp. arXiv:2510.00103. External Links: Document, 2510.00103, ADS entry Cited by: §1, §3.2.
- Extreme properties of a compact and massive accreting black hole host in the first 500 Myr. Nature Communications 16 (1), pp. 9830. External Links: Document, 2412.04983, ADS entry Cited by: §1.
- GA-NIFS: A massive black hole in a low-metallicity AGN at z 5.55 revealed by JWST/NIRSpec IFS. A&A 677, pp. A145. External Links: Document, 2302.06647, ADS entry Cited by: Appendix A, Appendix A, §1, Figure 3, §3.2.
- GA-NIFS: JWST discovers an offset AGN 740 million years after the big bang. MNRAS 531 (1), pp. 355–365. External Links: Document, 2312.03589, ADS entry Cited by: Appendix A.
- Spatially resolved [CII]–gas conversion factor in early galaxies. A&A 700, pp. A117. External Links: Document, 2504.14001, ADS entry Cited by: §3.2, §3.3.
- Composite Quasar Spectra from the Sloan Digital Sky Survey. AJ 122 (2), pp. 549–564. External Links: Document, astro-ph/0105231, ADS entry Cited by: §2.1.3.
- The great observatories origins deep survey. VLT/FORS2 spectroscopy in the GOODS-South Field: Part II. A&A 454 (2), pp. 423–435. External Links: Document, astro-ph/0601367, ADS entry Cited by: Figure 3.
- The unusual N IV] -emitter galaxy GDS J033218.92-275302.7: star formation or AGN-driven winds from a massive galaxy at z = 5.56. A&A 513, pp. A20. External Links: Document, 0912.3007, ADS entry Cited by: §3.2.
- BEAGLE-AGN I: simultaneous constraints on the properties of gas in star-forming and AGN narrow-line regions in galaxies. MNRAS 527 (3), pp. 7217–7241. External Links: Document, 2211.13648, ADS entry Cited by: §2.1.1.
- The ALMA-CRISTAL survey: Dust temperature and physical conditions of the interstellar medium in a typical galaxy at z = 5.66. A&A 691, pp. A133. External Links: Document, 2407.09681, ADS entry Cited by: §3.7, footnote 4.
- Inferences on the Relations Between Central Black Hole Mass and Total Galaxy Stellar Mass in the High-redshift Universe. ApJ 820 (1), pp. L6. External Links: Document, 1602.05711, ADS entry Cited by: §2.1.1.
- ALMA Spectroscopic Survey in the Hubble Ultra Deep Field: Survey Description. ApJ 833 (1), pp. 67. External Links: Document, 1607.06768, ADS entry Cited by: Appendix A.
- ALMA 200 pc Imaging of a z 7 Quasar Reveals a Compact, Disk-like Host Galaxy. ApJ 927 (1), pp. 21. External Links: Document, 2201.06396, ADS entry Cited by: footnote 4.
- A Sensitive Search for [N II]205μm Emission in a z = 6.4 Quasar Host Galaxy. ApJ 691 (1), pp. L1–L4. External Links: Document, 0812.3956, ADS entry Cited by: §3.1.
- RUBIES: JWST/NIRSpec Confirmation of an Infrared-luminous, Broad-line Little Red Dot with an Ionized Outflow. ApJ 984 (2), pp. 121. External Links: Document, 2403.02304, ADS entry Cited by: §1, §1, §3.5.
- Identifying agn balmer absorptions and stratified narrow emission-line region kinematics in sdss j112611.63+425246.4. Astronomy & Astrophysics 573, pp. A76. External Links: Document Cited by: §1.
- The fundamental plane of black hole activity for low-luminosity radio active galactic nuclei across 1 ¡ z ¡ 4. arXiv e-prints, pp. arXiv:2402.17991. External Links: Document, 2402.17991, ADS entry Cited by: §1.
- The Galaxies Missed by Hubble and ALMA: The Contribution of Extremely Red Galaxies to the Cosmic Census at 3 ¡ z ¡ 8. ApJ 968 (1), pp. 34. External Links: Document, 2311.07483, ADS entry Cited by: §1.
- No [CII] or dust detection in two Little Red Dots at zspec ¿ 7. arXiv e-prints, pp. arXiv:2503.01945. External Links: Document, 2503.01945, ADS entry Cited by: §1, Figure 3.
- X-CIGALE: Fitting AGN/galaxy SEDs from X-ray to infrared. MNRAS 491 (1), pp. 740–757. External Links: Document, 2001.08263, ADS entry Cited by: Table 4, Appendix B.
- CEERS Key Paper. VI. JWST/MIRI Uncovers a Large Population of Obscured AGN at High Redshifts. ApJ 950 (1), pp. L5. External Links: Document, 2303.11736, ADS entry Cited by: Appendix B.
- Stacking X-Ray Observations of “Little Red Dots”: Implications for Their Active Galactic Nucleus Properties. ApJ 974 (2), pp. L26. External Links: Document, 2404.13290, ADS entry Cited by: §1.
- The [C II] emission as a molecular gas mass tracer in galaxies at low and high redshifts. MNRAS 481 (2), pp. 1976–1999. External Links: Document, 1808.10331, ADS entry Cited by: §3.3.
- Black holes in the shadows: The missing high-ionization lines in the earliest JWST active galactic nuclei. A&A 707, pp. A52. External Links: Document, 2510.10772, ADS entry Cited by: §3.2.
Appendix A Tentative line detections in JADES_954 and JADES_1146115
As discussed in Sect. 3.2, we could only derive upper limits on the [C ii]emission at the location and redshift of our targets. However, we found tentative [C ii] detections near the systemic redshift in two sources: JADES_954 and JADES_1146115. The two tentative detections are shown in Fig. 6.
None of these two tentative line detections appears to be significant enough when compared with the distribution of positive and negative peak flux densities obtained from the moment-zero maps, even though with integrated , and falling in the low-probability tail of the histogram of noise fluctuations. This result was confirmed by tests using the line-detection codes interferopy (Walter et al. 2016) and MF3D (Pavesi et al. 2018) with cubes at the native velocity resolution (2.5 km s-1) and with a 10 times rebinning. Furthermore, even though the tentative lines are exactly at the position of the two sources, there are two additional indications suggesting that the lines may be spurious. First, they are both shifted in velocity compared to the nominal redshift of the source, -43 km s-1 for JADES_954 and -693 km s-1 for JADES_1146115. While for JADES_954 this shift would still be consistent with the redshift of the source derived from high-resolution JWST spectroscopy within a couple of sigmas, for JADES_1146115 the redshift uncertainty is not large enough to justify the velocity shift of [C ii] without invoking an actual shift of the cold gas emission relative to the ionized emission. Second, the FWHM of both lines are extremely narrow: 8 km s-1 for JADES_954 and 12 km s-1 for JADES_1146115. While a narrow FWHM might be expected given the low stellar masses of the two sources, these [C ii] FWHM are more than 1 dex lower than the FWHM of the ionized gas, which are 128 km s-1 for JADES_954, and 180 km s-1 for JADES_1146115.
Assuming for a moment that these are real line detections, given the unresolved NOEMA observations (but still with a sub-arcsecond beam size), it is possible to obtain an upper limit on the dynamical mass of the host galaxies (using the same approach as in Übler et al. (2023) and taking as a mean between the half-major and half-minor axes of the beam). This computation gives for JADES_954, and for JADES_1146115, both lower than the stellar mass derived in Sect. 3.4, and two (three) times lower than the BH estimated from the H line and reported in Table 1 for JADES_954 (JADES_1146115). This further indicates that these tentative line detections are in fact spurious, or at least not directly associated with the AGN.
However, for the case of JADES_954 we note the small, blue-ish source extension to the North-East which is apparent in the NIRCam imaging (Fig. 1) and in our size analysis (Sect. 2.1). It is possible that the tentative [C ii] emission shown in the top panel of Fig. 6 and close to the systemic velocity of JADES_954 is indeed real and associated to this bluer emitter, which could correspond to a low-mass satellite. Such faint, blue emission has been observed around several JWST-AGN (e.g. Matthee et al. 2024; Ji et al. 2024; Golubchik et al. 2025; Rinaldi et al. 2025a; Baggen et al. 2026) and indeed in some cases could be associated to [C ii] detections (for instance in the cases of GS_3073: Béthermin et al. 2020b; Barchiesi et al. 2022; Übler et al. 2023; Ji et al. 2024; ZS7: Pentericci et al. 2016; Übler et al. 2024; A383-LRD1: Knudsen et al. 2016; Golubchik et al. 2025; or the source ‘Saguaro’: Freundlich et al. 2019; Rinaldi et al. 2025b; Mazzolari et al. in prep.).


Appendix B CIGALE SED fitting
The SED fitting was performed using a large parameter grid and accounting for AGN emission. The parameters used for the SED fitting are reported in Table 4. We used delayed star-formation history (SFH) models, which can reproduce both early- and late-type galaxies, with an additional term that allows for a recent burst of star formation. We provide a range of ages of the main stellar population varying between the age of the universe at the redshift of the source and 10 Myr, and we allow the burst to happen within the last 10 Myr and to contribute up to 20% of the total mass budget. We adopted stellar templates from Bruzual and Charlot (2003), and a Chabrier (2003) initial mass function. We consider two different metallicities for the stellar populations (solar and 0.2 solar) and a separation between the young and old stellar populations between 10 and 500 Myr. We also include the nebular emission module with gas-phase metallicities of solar and 0.2 solar. This module is computed by CIGALE in a self-consistent manner using a grid of Cloudy photoionization calculations (Ferland et al. 2013). For the attenuation of the stellar continuum emission, we use the dustatt_modified_starburst module with a Small Magellanic Cloud extinction law (Pei 1992). We select a narrow range of , the attenuation of the nebular emission lines, to match the result obtained from the spectral analysis (see Table 1) and then set two possible ratios between and . We also include dust emission in the infrared following the model by Draine et al. (2014), as reported in Sect. 3.4.
For the AGN contribution, we employed the skirtor2016 (Stalevski et al. 2016) module updated by Yang et al. (2020), which has been demonstrated to be reliable in studying various aspects of AGN (e.g. Mountrichas et al. 2022; López et al. 2023; Yang et al. 2023; Mazzolari et al. 2024, 2026b) and include the possibility of Type I AGN obscuration via polar extinction, contrary to the Fritz et al. (2006) model. The SED produced by the AGN combines emission from the accretion disk, torus, and polar dust. The accretion disk, responsible for the UV-optical emission in the central region, is parametrized according to Schartmann et al. (2005), allowing for a deviation of the intrinsic slope in the according to the parameter (). We allowed . Photons from the accretion disk can be obscured and scattered by dust in the vicinity, within the torus and/or in the polar direction. For the torus, the skirtor2016 module employs a clumpy two-phase model (Stalevski et al. 2016), based on the 3D radiative-transfer code SKIRT. For the polar dust component, we used the Small Magellanic Cloud (SMC) extinction curve, recommended for AGN observations (e.g. Bongiorno et al. 2012). For the polar extinction amplitude, we chose a range . The code also assumes energy conservation for the polar dust that absorbs the AGN emission, and we allowed the polar dust temperature to vary between and K. We allowed the opening angle of the AGN torus to vary between 10°40° and the AGN line of sight inclination 0°90° (where values 0°90°- correspond to Type I AGN, while 90°- 90° to Type II AGN). Finally, we let the AGN fraction (defined as the ratio between the AGN luminosity and the total galaxy luminosity between 0.13 and 5m) range from 0.1 (weak AGN contribution) to 0.9 (dominant AGN emission).
| Module | Parameter | Symbol | Values |
|---|---|---|---|
| Stellar -folding time | [ yr] | 10, 50, 100, 200, 500 | |
| Star formation history | Stellar age | [ yr] | 10, 50, 100, 200, 300, 500, 700 |
| Age of the burst | [ yr] | 1, 5 | |
| Mass fraction of the burst population | 0.0, 0.01, 0.1, 0.2 | ||
| Single stellar population | Initial mass function | – | Chabrier (2003) |
| Bruzual and Charlot (2003) | Metallicity | 0.004, 0.02 | |
| separation between the young and the old star | sep_age [ yr] | 10, 200, 500 | |
| Nebular emission | Gas metallicity | Zgas | 0.004, 0.02 |
| Dust attenuation | colour excess of the nebular lines | set to the values reported in Table 1 | |
| Pei (1992) | Fractional ISM attenuation | 0.44, 1 | |
| Mass fraction of PAH | qpah | 0.47, 2.5, 3.9 | |
| Galactic dust emission | Minimum radiation field | Umin | 0.1, 1.0, 5, 10, 25, 40 |
| Draine et al. (2014) | Slope in | 2.0 | |
| Illuminated fraction [Umin–Umax] | 0.02, 0.1, 0.5 | ||
| Edge-on optical depth at 9.7m | 7 | ||
| Slope of radial dust density profile | – | 1.0 | |
| Slope of polar dust density profile | – | 1.0 | |
| Torus opening angle (from equator) | 0, 40 | ||
| AGN disk+torus+polar dust: | Ratio outer/inner torus radius | – | 20 |
| Viewing angle (from vertical axis) | 0, 50, 90 | ||
| Stalevski et al. (2016), | |||
| Yang et al. (2020) | AGN fraction | 0.2, 0.3, 0.4, 0.5, 0.6, 0.7, 0.8, 0.9 | |
| Extinction law for polar dust | – | SMC | |
| in the polar direction | – | 0.03, 0.1, 0.2, 0.5, 1, 1.5 | |
| Temperature of polar dust | [K] | 100, 300 | |
| Emissivity of polar dust | – | 1.6 |