Decay-Resolved Charge Changes from Radioactive Decays in Levitated Microparticles
Abstract
We measure event-by-event discrete changes in the net electric charge of an optically levitated silica microsphere arising from individual radioactive decays within the sphere, in coincidence with energy depositions in a nearby scintillation detector. The net charge of the levitated sphere is continuously monitored by measuring its driven response to an oscillating electric field, allowing individual charge-change events to be resolved on millisecond timescales with precision below an elementary charge. Simultaneously, and particles emitted during decays of implanted 212Pb and its daughters are detected using a scintillator read out with an array of silicon photomultipliers. By correlating reconstructed charge-change times with the scintillator response, we can directly attribute abrupt changes in the sphere’s net charge to individual nuclear decays, and identify differences in the distribution of charges ejected for and decays. These results establish a new approach for studying low energy charged particles emitted by radioactive decays at the single-decay level, and identify showers of radiogenically produced low-energy electrons emitted by -decaying radon daughters implanted near solid surfaces.
I Introduction
Levitated optomechanical systems offer a sensitive platform for detecting small forces [29]. A micro- or nano-particle levitated in vacuum can exhibit exceptionally low mechanical dissipation and high isolation from environmental noise [26, 40, 62]. Due to the isolation from thermal noise and small masses possible with levitated systems, force sensitivities can reach the zeptonewton to yoctonewton scale [42, 54, 32, 41].
Due to this sensitivity, levitated optomechanical sensors can provide a uniquely powerful platform for the detection of weak forces in a number of areas of fundamental physics. They have been proposed as probes for Casimir and non-contact frictional forces [44, 73] and high-frequency gravitational waves [5]. They have also been applied to search for weak, long-range interactions beyond the Standard Model between masses [68] or from dark matter [51, 49, 3, 67, 30], and to search for millicharged particles [4]. With further improvements in motional control [42, 65, 53, 52, 21, 66], optimizing measurement imprecision and back-action [47, 64, 59], and quantum state manipulation [48, 35], such systems are poised to detect even smaller forces [62, 38, 45], including potentially providing a platform for studying the behavior of gravitational interactions between quantum systems [46, 57, 56, 12]. Extending these systems to large arrays of particles can enable searches for even rarer interactions [3, 51] or enhanced sensing through collective effects in coupled arrays [13, 61, 55, 72].
Future applications of levitated sensors include reconstructing the full kinematics of the decay products of nuclear or electron capture decays, allowing the properties of the emitted neutrinos to be inferred [17, 63]. Recent work has demonstrated such kinematic reconstruction is possible for single nuclear decays occurring in a micron-sized sphere, in which radon daughters have been implanted [70]. During the decay process, the emission of electrically charged decay products also induces discrete changes in the net electric charge of the microparticle through the emission both of the high-energy charged particles emitted by the decay, as well as any secondary emission of lower energy electrons or ions. These charge changes provide an additional signature of a single nuclear decay occurring in an electrically isolated particle, allowing individual decays to be identified with background levels 1 Bq [70]. A quantitative understanding of the net electric charge changes of such particles following nuclear decays, and their dependence on the type and energy of the emitted particles, is essential for understanding background levels that may be achievable in applications of levitated particles to neutrino physics. These techniques may also enable new radioassay methods for single dust-sized particles containing trace amounts of radioactivity, with potential applications in metrology [22], nuclear material characterization and analysis [43], and environmental monitoring of airborne radioactive particles [34, 36].
Previous studies have investigated secondary charge production by energetic particles incident on a variety of solid targets. For ions, electron yields, energy spectra, and angular distributions have been studied for He2+ and heavy ions, which are the relevant energy scales for the particles and nuclear recoils from radon progeny considered in this work (see, e.g. [37, 31, 9]). Secondary electron emission from incident electrons at the energies relevant for the decays in the radon decay chain has also been studied [60]. For both ion and electron impacts, the total secondary electron yield is approximately proportional to the electronic stopping power of the incident particle, and depends on the transport and transmission through the surface [31, 9]. Related measurements studying secondary electron emission from radioactive sources embedded in metal surfaces have also been performed [6], by measuring the total current generated from multiple decays. Most experiments have been performed on metallic targets, whereas dielectric materials present experimental challenges due to charge accumulation.
Radioactive decay–induced production of charged particles arising from the implantation of radon progeny into surfaces [19] have also been extensively studied in the context of background mitigation in rare event searches and neutrino physics. For example, in the KATRIN experiment implantation of radon daughters in detector surfaces leads to the production of secondary electrons and Rydberg atoms [23, 24], which are relevant for backgrounds in the neutrino-mass measurement [20]. In gas and liquid phase time projection chambers (TPCs), low-energy backgrounds can be generated by decays of radon progeny embedded in detector surfaces, and characterizing low energy electrons and recoiling daughter nuclei produced by such backgrounds is important for searching for low-mass dark matter [7, 2, 39]. Implanted radon progeny can also be subsequently ejected from surfaces after further decays, and the techniques described here may be relevant for characterizing the escape of such daughter nuclei from surfaces at the single decay level.
In this work, we study the emission of primary and secondary charged particles in nuclear and decays of 212Pb and its daughters shallowly implanted in a silica microparticle. The measured net changes in the microparticle charge are correlated with the detection of the high-energy decay products incident on an external detector, composed of a scintillator read out by silicon photomultipliers (SiPMs). By measuring these coincident signals, the distributions of charge changes for and decays are individually identified.
II Methods
II.1 Experimental description
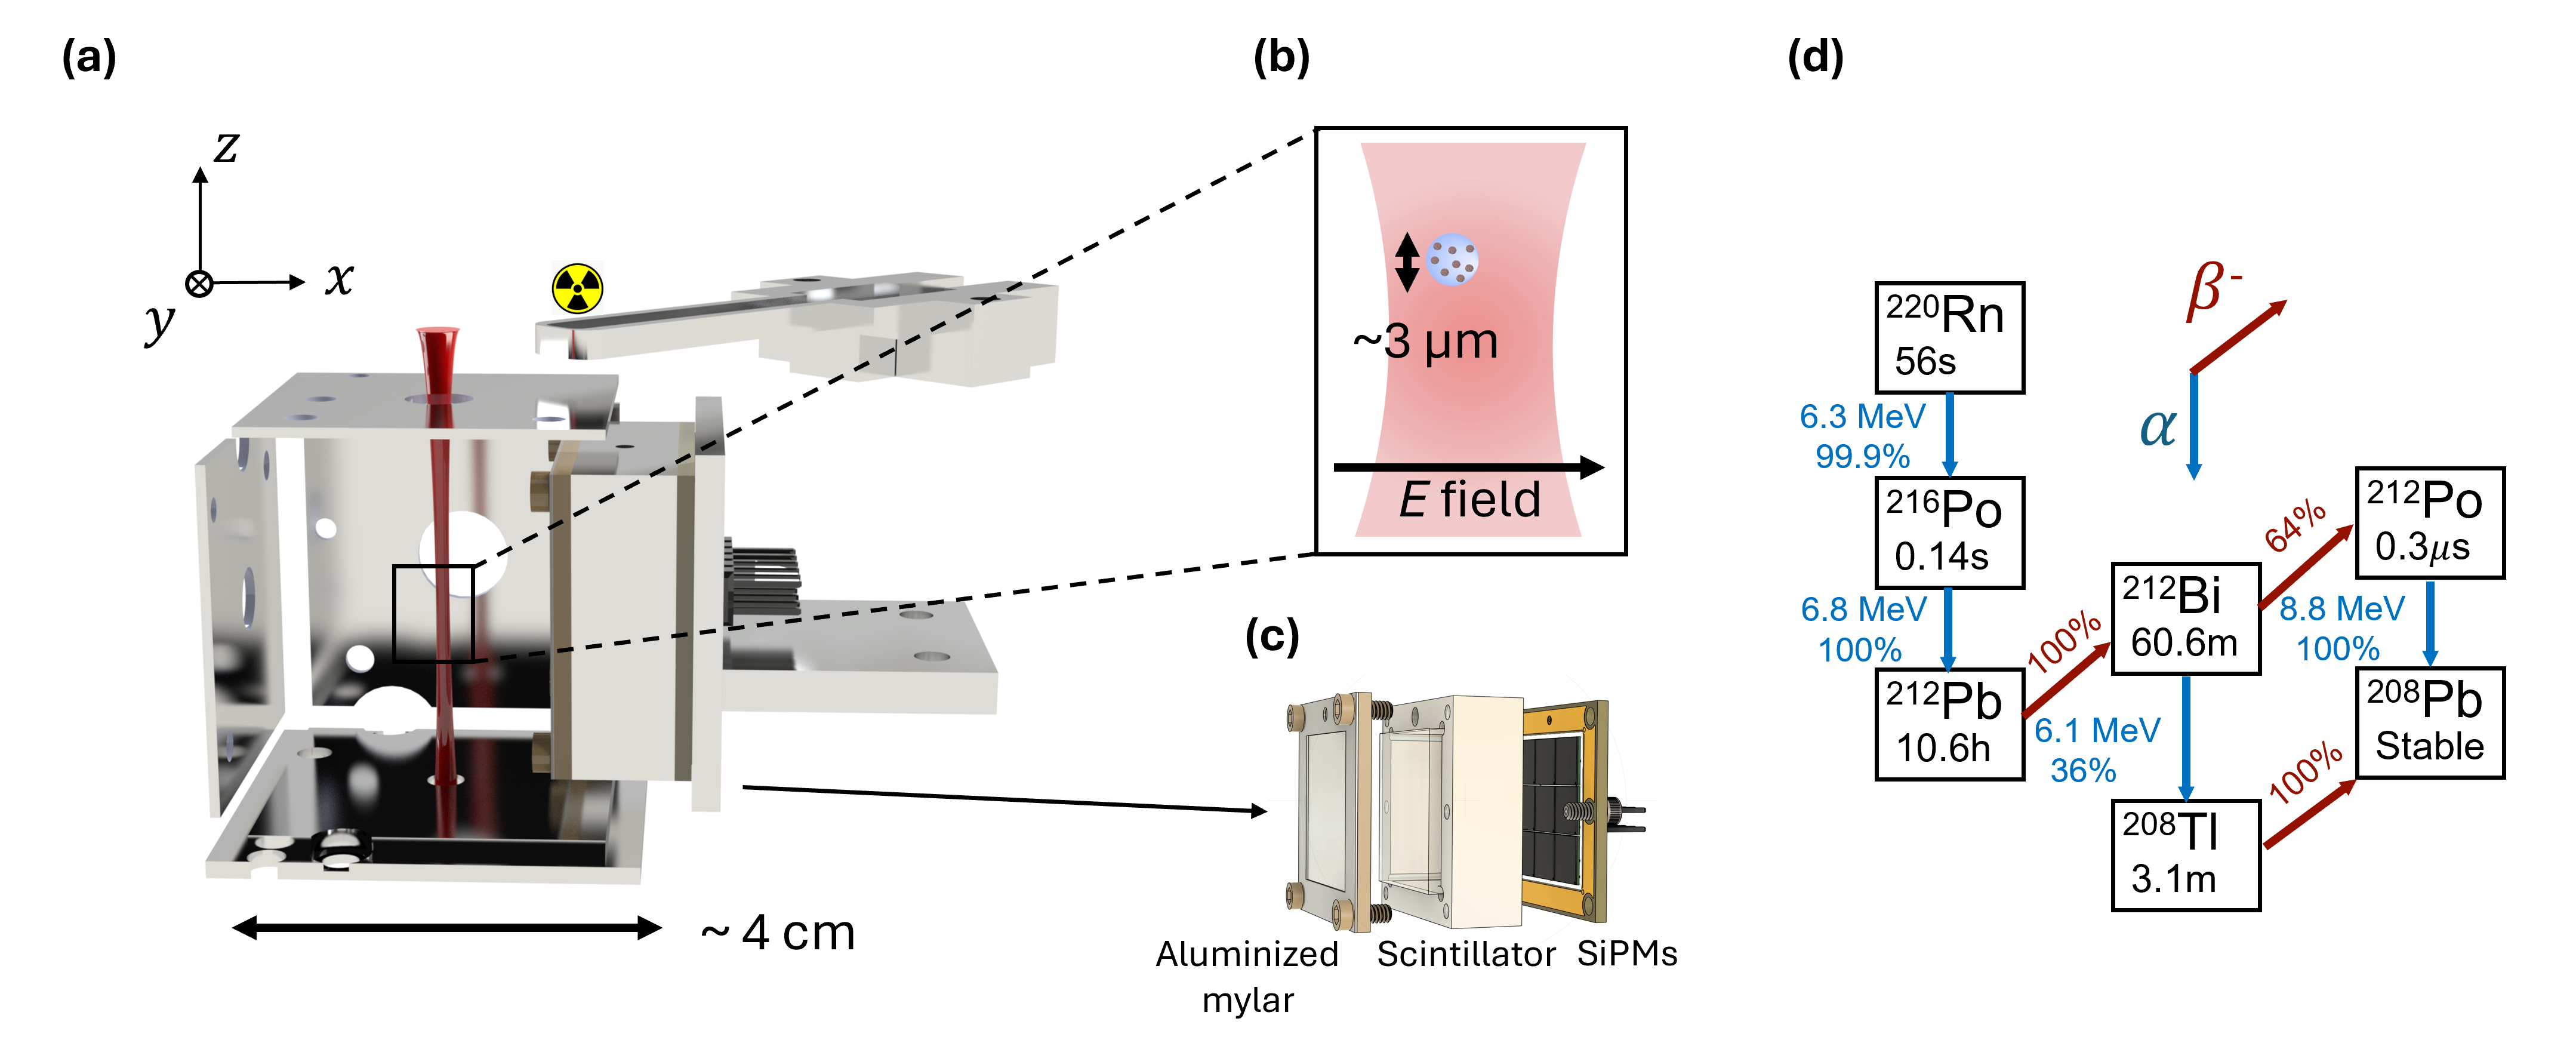
Changes in the net electric charge of a microparticle associated with nuclear decays are measured with accuracy better than a single elementary charge using optically levitated silica spheres (diameter ) held in high vacuum at pressures between to mbar. The spheres are implanted with 212Pb, which is an unstable daughter of 220Rn with a half-life of 10.6 hours [1]. Implantation is carried out in a dedicated vacuum chamber following the procedure described in [70] by introducing 220Rn gas from an emanation source (Pylon TH-1025, 105 kBq in May 2024), which undergoes decay to 216Po (see Fig. 1(d)), producing an ionized daughter a substantial fraction of the time when stopped in dilute gas [70]. These ions are then drifted onto the surface of the sphere by a static electric field. Subsequent decays of 216Po implant the recoiling 212Pb daughters in the surface of the silica sphere with a typical depth 60 nm [70].
Following implantation, the spheres are transferred into a high-vacuum chamber on a glass slide where they are loaded into an optical trap, consisting of a vertically oriented 1064 nm laser, which is weakly focused at the center of the vacuum chamber [70]. Spheres are detached from the slide using a piezoelectric actuator to vibrate the slide while it is positioned above the trap focus. Many spheres are released from the surface and fall through the trapping region, from which a single sphere is captured.
The slide, which usually has around 5-10 kBq activity directly after loading, is then retracted by 1 cm from its loading position above the optical trap using a vacuum translation stage, but remains within the vacuum system. When retracted, the intervening material between the slide and the scintillator detector (see Fig. 1(c)) consists of a 2 mm thick aluminum housing around the slide, a -thick stainless-steel electrode, and a 4 mm thick aluminum housing surrounding the detector. This material is expected to fully absorb all particles, while providing some degree of attenuation of particles. The low-energy spectrum of 212Pb is largely absorbed in the electrode or aluminum housings, whereas the higher-energy emissions from 212Bi and 208Tl can penetrate the material at certain angles. In addition bremsstrahlung can be generated from particles interacting with the intervening material. Therefore, residual radioactivity on the slide produces a background signal in the scintillator detector, as discussed in Sec. II.3. The measured background rate in the detector is 25 Bq approximately 5 hours after loading. In comparison, a typical trapped sphere exhibits an initial activity between mBq and yields 80–400 detected decay events before the activity has fully decayed away.
The optical trap is surrounded by five planar electrodes and a particle detector with a grounded housing, shown in Fig. 1(a). For charge measurements (see Sec. II.2), only the electrode facing the detector is biased, while all other electrodes, including the detector entrance surface, are held at ground. The electrodes incorporate apertures for the trapping and imaging beams, as well as ports for charge–control hardware, including an optical fiber coupled to a xenon flashlamp that produces ultra-violet (UV) light, and a heated filament. The sphere position is monitored using two orthogonal 532 nm imaging beams. The forward scattered light from the sphere is collected using lenses within the vacuum system focused on the trap location and imaged onto D–shaped mirrors that split the light onto balanced photodetectors (with one detector for each of the three axes). The differential signal on the balanced photodetector can be used to determine the sphere’s displacement from the trap center in each direction. The displacement signal is sent to a Field-Programmable Gate Array (FPGA) based feedback system, which can output a real time signal to a piezo controlled deflection mirror that steers the trapping beam to provide feedback in the horizontal degrees of freedom, and an acousto-optic modulator (AOM) that modulates the trapping beam power to provide feedback to the vertical degree of freedom. In high vacuum, the center–of–mass motion of the sphere is stabilized using this active feedback [50]. For data collection, the sphere’s displacement signals and other experimental parameters are recorded by a data acquisition system (DAQ) while the triggered scintillator detector signal is recorded by a separate high-speed digitizer, as described in Sec. II.3.
II.2 Charge Detection

After pumping to high vacuum, the net charge of the levitated sphere is determined from its driven response to an oscillating electric field. To neutralize the sphere, electrons can be added to the sphere via thermionic emission from a tungsten filament and removed using UV illumination [70]. The response is calibrated in units of using the observed discrete steps in the response amplitude from induced charge changes [70]. The phase of the response relative to the driving electric field is used to determine the charge polarity. Each sphere is continuously monitored for to days after loading into the optical trap and reaching high vacuum, during which time the rate of charge change events decreases following the half-life of 212Pb (10.6 h). The monitoring field is driven at a fixed frequency of , which is well above the resonance frequency Hz.
A null test performed with non-radioactive spheres shows zero spontaneous charge-change events, placing an upper limit on the rate of backgrounds arising from random charging unrelated to radioactive decays in the particle of 12 at 95% confidence [70], presenting a negligible background compared to the mBq rate of decays of implanted 212Pb and its daughters following the loading process described above. The observed charge changes for radioactive spheres are dominated by a net loss of electrons from the sphere, consistent with previous work [70]. The scintillator detector is used to identify the high-energy charged particles emitted during these decay events when a time coincident signal is observed (see Sec. II.3).
This work reaches sphere activities up to an order of magnitude higher than those previously reported in Ref. [70], leading to a substantially improved measurement of the distribution of charge changes associated with decays within the particle. An example measurement of the observed charge changes over time for a single microsphere following loading with 212Pb is shown in Fig. 2. To ensure the charge sensitivity is well below a single , an electric field of is applied to the sphere to monitor its net charge, , yielding a typical charge resolution of when the absolute value of the net particle charge is . At this field strength, the charge resolution degrades when the net charge magnitude becomes larger, possibly due to fluctuations in the driving electric field, non-linearity in the detection, or other stray electric field noise. Therefore, an automatic discharge protocol is used to maintain . The times at which the discharge protocol is active are recorded by the DAQ and are indicated in Fig. 2. Dead time arising from the DAQ and discharging periods accounts for less than of the total measurement time for all spheres considered.
Excluding periods during which the automatic discharge protocol is active, individual charge changes as small as are observed, while the largest events reach . A total of sixty six events exhibit charge changes exceeding . In addition to net electron loss, 33 events corresponding to a net loss of 1–2 positive charges are also observed.
A histogram of all charge-change events recorded from the full set of 14 spheres is shown in Fig. 3. We define the charge change from an initial net charge of the microsphere, , to final charge , . Since nearly all observed decays produce a net loss of electrons, the sign is defined such that is positive when more electrons are lost than protons. The distribution exhibits a sharp peak near that is modeled as a Gaussian distribution, as well as a pronounced high-charge tail that is empirically modeled by a log-normal distribution peaking at . While all 14 spheres are considered for producing this charge change spectrum, only 12 of the spheres have corresponding scintillator detector data and are used in the coincidence analysis in Sec. III, where the emitted radiation associated with charge changes of different magnitudes is determined.
II.3 Particle detection
A scintillator detector is used to identify , , and radiation emitted during decays within the particle, which can be measured in coincidence with the charge changes described in Sec. II.2. This detector consists of a scintillator read out using a array of SiPMs. This configuration allows both the energy deposited in the scintillator to be reconstructed (through the summed SiPM signal) as well as the position of the interaction to be determined (through the distribution of energy across the SiPM array). While future work will aim to reconstruct the momentum of the recoiling sphere in coincidence with a measurement of the momenta of the decay products using this position sensitivity [70], here we focus on differentiating and decays only through the total energy deposited in the coincidence detector.

The scintillator material is a 20 mm 20 mm 5 mm gadolinium aluminum gallium garnet (GAGG) crystal optically coupled to nine 6 mm 6 mm ONSemi MICROFJ-TSV-TR SiPMs mounted in a fully hermetic, polished aluminum housing. Each SiPM channel is read out individually by a Cremat CR-113 charge-sensitive preamplifier followed by a CR-200 shaping amplifier with a shaping time of , integrated on a custom nine-channel board. The analog outputs are digitized using a CAEN DT5740 digitizer, which records 2 s long waveforms for all channels when any SiPM’s output voltage exceeds a predefined 100 mV trigger threshold (corresponding to more than photoelectrons detected on any channel).
To suppress stray light scattered from the particle within the optical trap or other chamber surfaces and to allow the detector face to function as an electrode, two layers of aluminized Mylar (each 0.8 mg/cm2 mass density per unit area) are mounted on the detector front surface. Two layers are used to minimize light leakage through pinholes in the aluminum coating while minimizing mass that can degrade the energy of incident particles. When grounded together with the detector housing, this coating forms an effective shield for low frequency electric fields, preventing field leakage resulting from the SiPM bias voltages, which would otherwise induce significant forces on the microsphere as its charge changes throughout the measurement, resulting in drifts in the sphere’s equilibrium position. In all measurements reported here, the detector is positioned from the trapped sphere, subtending a solid angle of about .
The scintillator detector is calibrated using a 212Pb source produced by implantation of activity directly onto a glass surface, following the same procedure used to implant activity to the microspheres themselves [70]. During calibration, the source is placed within of the sphere’s trapping position relative to the detector, with the surface on which the activity was implanted directly facing the detector. Calibrations are taken under vacuum at a pressure of , where loss of energy due to gas collisions between the source and the detector is negligible.
Because the scintillation light yield is particle dependent and subject to quenching effects, interactions of and particles yield different light responses for the same deposited energy, causing signals from one particle species to appear at shifted reconstructed energies when interpreted using the calibration of the other [27, 25]. In addition we observe a non-linear variation in the detector response for particles at different energies, arising from energy dependence of this quenching and energy loss in the aluminized Mylar entrance window. After correcting for the observed energy dependence based on the measured 212Bi and 212Po peak locations to define the calibrated energy scale, the energy resolutions are at the 6.1 MeV 212Bi peak and keV at the 8.8 MeV 212Po peak, as shown in the upper panel of Fig. 4. The energy scale is calibrated by mono-energetic electron peaks (at 482 keV and 976 keV) from a 207Bi source. To reduce the dependence of the reconstructed energy on the detector position at which the particle interacts, the individual channel contributions are corrected by a calibration factor determined by minimizing the position-dependent energy spread of the peaks from 212Bi and 212Po decays, which accounts for variations of in the gain and light collection efficiency between channels.
The same reconstruction procedure used to define the calibrated beta and alpha energy scales from the calibration sources is then applied to data where a radioactive microsphere is present in the chamber. In addition to radioactive decays from the sphere, a significant background is present due to and particles emitted by activity remaining on the dropper slide used for sphere loading, which remains inside the vacuum chamber during operation, as described in Sec. II.1. These particles can penetrate the trap electrodes and produce detector signals that are uncorrelated with charge-change events. The energy spectrum of this background is determined through measurements of the scintillator detector response in the absence of a trapped sphere, and is shown in the lower panel of Fig. 4. The interpolated background shape is then used to model backgrounds arising from random coincidences of charge change events with this background in Sec. III.2, based on a detailed timing analysis.

III Decay-resolved Coincidence Measurements
We analyzed twelve radioactive spheres trapped in the optical tweezer to study coincidences between discrete charge-change events and particle energy deposition measured by the SiPM array. Time coincidence is established using a hardware trigger issued by the CAEN digitizer when the SiPM voltage signal exceeds the 100 mV threshold, with resolution ns based on the shaping time of the readout electronics. This trigger is routed to a dedicated input channel of the data-acquisition system (DAQ), which monitors the sphere’s displacement with a 0.1 ms time resolution.
The data are synchronized to ensure the relative timing resolution between the data streams is equal to the coarser 0.1 ms time resolution of the DAQ, which is substantially faster than the ms timescale at which charge changes can be resolved (see Fig. 6).
III.1 Time reconstruction of charge changes
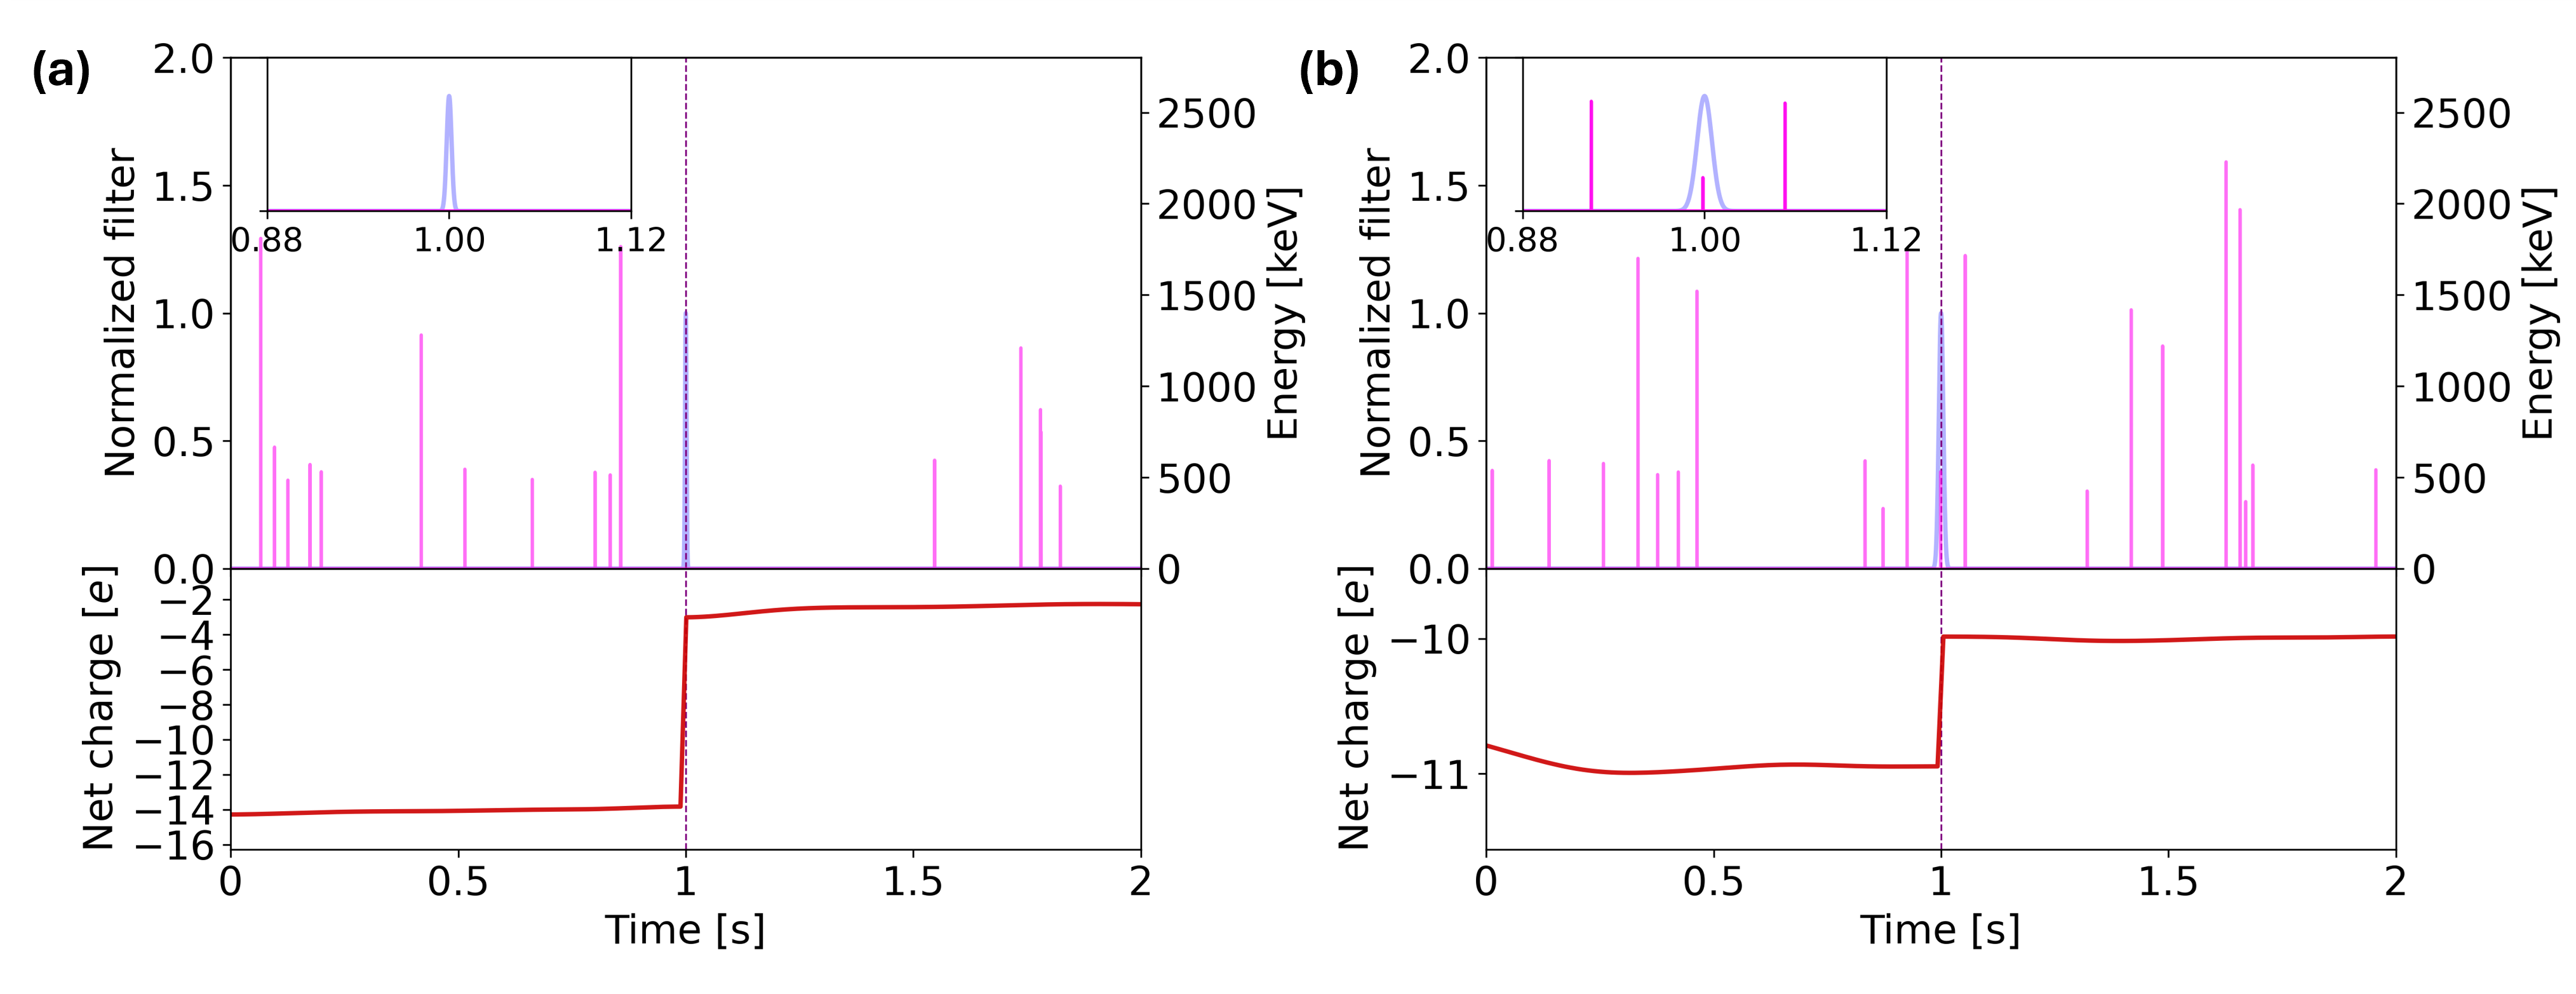
To reconstruct the times of charge changes within the DAQ data stream, a matched filter is implemented. Matched filtering provides an optimal linear estimator for both the amplitude and time of the charge change based on the known signal shape and noise spectral density [70, 28, 58]. In our analysis, the signal template corresponds to the response of the oscillator to an abrupt change in electric force produced by a sudden change in the net charge of the sphere, evaluated at the applied electric driving frequency. When the sphere is driven by an electric field at a single frequency, the absolute value of the Fourier transform of the resulting displacement response to a step change in force can be described by a Lorentzian, with a small damping constant that accounts for phase fluctuations and the finite sampling frequency. The charge change amplitude, , at discrete time index can be estimated as:
| (1) |
where labels the discrete frequency index for a waveform with samples; is the Fourier transform of the measured sphere displacement; is the template of the sphere response near the driving frequency for a charge change of one elementary charge , and is the noise power spectral density, which includes displacement noise at a level of m/.
In practice, we apply this matched filter to the sphere position data within a narrow frequency band (2 Hz) around the drive. The filtered waveform exhibits a sharply peaked response at the time of each charge-change event, arising from the change in the Coulomb force acting on the sphere. The location of the maximum of the filtered response for each reconstructed event identified in Sec. II.2 provides an estimate of the event time.
The result of this timing reconstruction for two example events is shown in Fig. 5. Figure 5 (a) shows a charge–change event without a time coincident signal, consistent with a decay in the particle but where no signal is detected in the scintillator detector due to its finite solid angle. Figure 5 (b) demonstrates a temporal coincidence between a charge step measured by the sphere and an energy deposition event in the scintillator detector. The reconstructed charge change time from the matched filter analysis, with resolution consistent with Fig. 6 is shown in the upper panels, while the bottom panels show the net charge estimated from the amplitude of the response at the drive frequency extracted from the Fourier transform in each 25.6 ms long window.
Finally, as shown in Fig. 5, because a relatively large electric field is applied to measure the charge changes, even a single–electron charge change produces a sufficiently strong impulsive response that the matched filter provides high temporal resolution.
III.2 Timing resolution

The time resolution of the measurement is limited by the resolution for reconstructing the charge changes from the sphere response, as described in the previous section. All other limitations on timing resolutions (due to, e.g., the DAQ bandwidth, scintillator detector response, escape of charged particles from the sphere, etc.) are estimated to be subdominant. Due to this finite time resolution, we associate events in which a charge-change signal is reconstructed at and a scintillator detector signal is measured at when they are coincident within:
where is an empirically determined time window that depends on the amplitude of the charge change, .
To determine , the distribution of time differences, , between reconstructed charge-change events and the nearest scintillator detector trigger was analyzed. The resulting distribution consists of a narrow Gaussian peak superimposed on a smooth exponential background. The Gaussian component corresponds to true charge change–scintillator coincidences resulting from the same nuclear decay, while the exponential background arises from accidental coincidences of uncorrelated events. The accidental coincidence background is independently measured by generating a control sample with identical event statistics in which the charge-change times are randomized and the time differences to the nearest scintillator detector triggers are recomputed. This approach provides an empirical, high-statistics method of measuring the accidental background rate independent of true coincidences.
The background determined from this randomized timing data is plotted in Fig. 6 (red lines), along with the observed event distribution. The total event distribution is well described by this background (fully fixed in the model, with no free parameters) and a single Gaussian centered at , with the amplitude and resolution, , determined by a fit to the observed data. The timing resolution, , varies from 4.9 ms for to 1.6 ms for , since larger charge changes can be reconstructed with better timing accuracy. To define coincidences in the following section, we take in each bin of used to analyze the energy spectrum of coincident events, i.e. and . These thresholds give an expected efficiency to retain true coincidences of approximately 95%.
The signal-to-background ratio for each bin of can also be measured from the data in Fig. 6. For the number of true coincidences is approximately 1.5 the number of accidental backgrounds, while for this ratio rises to .
III.3 Coincidence spectrum

Based on the timing analysis presented in Sec. III.2, the energy spectrum measured by the scintillator detector for events at a given point in the charge change distribution can be measured. Events are divided into two categories to distinguish between the two features empirically observed in the charge change distribution shown in Fig. 3: small charge changes with (the Gaussian component) and large charge changes with (the log-normal component). The corresponding energy spectra for events satisfying these coincidence criteria are shown in Fig. 7.
For small charge changes (), the energy spectrum in Fig. 7(a) exhibits a broad continuum consistent with the sum of multiple and decay branches in the 212Pb decay chain. As discussed in Sec. III.2, this spectrum is expected to have significant contribution from both accidental coincidences as well as true coincidences between decays in the sphere and detection of the decay products in the scintillator detector. The energy distribution of the accidental coincidence spectrum is modeled based on the measured spectrum for backgrounds originating from the dropper slide when no sphere is present in the trap (see Fig. 4 (bottom)), with the total normalization of this background determined from the integral of the exponential distribution of accidental coincidences within the coincidence window shown in Fig. 6. In addition to this background component, we find the energy distribution measured by the scintillator detector for events can be adequately described by a single additional signal component that matches the exponential background used to fit the unresolved and decays originating from the 212Pb source at the sphere location, shown in Fig. 4 (top). Again, the shape is fully fixed by the calibration data, while the amplitude is fixed by the integral of the Gaussian component in Fig. 6. This allows the full spectrum to be modeled with no free parameters, but under the assumption that decays do not significantly contribute to the events.
For large charge changes (), the spectrum in Fig. 7 (b) exhibits two distinct peaks whose energies are consistent with the calibrated -decay lines of 212Bi and 212Po. To model the observed spectrum, the accidental coincidence background is again fully fixed by the timing analysis, following the same procedure as for the events. In addition to this background, a signal component is included based on the 212Bi and 212Po components measured in the calibration spectrum shown in Fig. 4 (top). The spectral shape (i.e., widths and relative amplitudes of the peaks) and the total normalization are fixed by the calibration data and the timing analysis, respectively. However, the fit of the model to the data is improved by allowing a small scaling of the energy scale for the peaks between the calibration data and charge change data (), which is optimized as a single free fitting parameter. The best-fit systematic offset of approximately is attributed to slow drifts in the detector energy calibration over the three-month data-taking period, while the calibration measurements were performed at the end of the experiment.
These results demonstrate that after accounting for accidental coincidence backgrounds, the charge-change events are predominantly associated with decays, whereas charge changes arise primarily from decays. Unlike previous studies that reported only an average number of electrons removed per decay, our measurements reveal a broad distribution of charge ejection following individual decays. In particular, a single decay typically ejects approximately 10 electrons (and in rare cases more than 60 electrons) from the surface of the silica sphere. For detected energies within of the and lines, the charge–change distribution peaks at and , respectively. Thus, in addition to the two protons escaping in the high energy particle, 10 electrons are also typically ejected. In contrast, the decays that occur in the 212Pb decay chain typically eject electrons, including the primary high-energy electron escaping from the decay.
Due to the timing resolution of the charge change measurement, we do not separately distinguish the charge changes from the decay branch where 212Bi decays by emission followed by the decay of its 212Po daughter, with a half-life of 0.3 s. Based on the solid-angle coverage of our particle detector, events in which the emission is detected while the subsequent decay of its daughter is missed are expected to contribute approximately of the observed coincidences in this portion of the decay chain. These events would provide a small additional contribution to the continuum in the spectrum, but do not preclude the identification of large charge changes for 212Po where the is detected by the scintillator.
IV Summary and Discussion
Using coincidences between a particle detector placed near a levitated silica microsphere with implanted radioactive isotopes and the change of the charge state of the sphere, we observe that different radioactive decay modes can be distinguished through the net charge change they induce. In particular, while both and decays eject low-energy electrons in addition to the high-energy primary decay products, we directly verify that decays occurring from radon daughters implanted 100 nm below the surface of the sphere produce substantially larger charge changes than decays. The distribution of charge changes associated with emission is broad, with the largest observed event corresponding to a loss of 115 elementary charges.
This work also demonstrates the ability to detect charged particles emitted in nuclear decays occurring in an optically trapped particle. Characterizing the distribution of charge changes of the trapped particle for such decays is important for predicting the ultimate background levels that may be reached in rare event searches using nuclear decays, such as searches for sterile neutrinos [17] or other hidden sector particles [10]. In addition, while not used here, the position sensitivity of the scintillator detector allows both the energy and momentum of the decay products to be measured, allowing future work to study the kinematic reconstruction of the momentum of any undetected particles [17].
Beyond these applications, the ability to detect the emission of single, low-energy electrons with the techniques described here may provide a new approach for studying charge production by low energy nuclear recoils in solids, including rare low energy processes such as the Migdal effect [33, 8, 71]. These techniques may also find applications in the radioassay of individual dust-sized particles, where we demonstrate the ability to distinguish single and decays occurring in such particles with backgrounds at the Bq level or below. Finally, in trapped-ion quantum processors, these results suggest that natural implantation of daughters of radon onto nearby surfaces or trap electrodes (during exposure of the components to room air during fabrication) can induce single nuclear decay events in which many low energy electrons may be simultaneously emitted and travel through the trapping region, interacting with the ions through Coulomb forces. In analogy to correlated errors observed in superconducting quantum processors arising from radioactivity, such events may become more evident as error correction techniques minimize the importance of error sources that are not correlated between qubits [18, 15, 69]. Searches for millicharged particles or other rare-event searches using trapped ions may also eventually be sensitive to such low-energy charged particle backgrounds [14, 16, 11].
Acknowledgements.
We thank the QuIPS team at Lawrence Berkeley National Lab for helpful discussions, and Gadi Afek and Fernando Monteiro for their early experimental efforts related to this work. This work was supported through the DOE Office of Science under Grants DE-SC0023672 and DE-SC0026367, and in part by ONR Grant N00014-23-1-2600. Y.-H. T. is supported by the Graduate Instrumentation Research Award (GIRA) from the Coordinating Panel for Advanced Detectors (CPAD).References
- [1] Note: National Nuclear Data Center, information extracted from the NuDat 3.0 database, https://www.nndc.bnl.gov/nudat/ Cited by: §II.1.
- [2] (2023-10) Search for new physics in low-energy electron recoils from the first lz exposure. 108, pp. 072006. External Links: Document, Link Cited by: §I.
- [3] (2022-03) Coherent Scattering of Low Mass Dark Matter from Optically Trapped Sensors. Phys. Rev. Lett. 128 (10), pp. 101301. External Links: Link, Document Cited by: §I.
- [4] (2021-07) Limits on the abundance of millicharged particles bound to matter. Phys. Rev. D 104 (1), pp. 012004. External Links: ISSN 2470-0010, 2470-0029, Link, Document Cited by: §I.
- [5] (2022-03) Searching for New Physics with a Levitated-Sensor-Based Gravitational-Wave Detector. Phys. Rev. Lett. 128 (11), pp. 111101. External Links: Link, Document Cited by: §I.
- [6] (1963-12) Secondary Electron Production from Alpha Particles Emerging from Gold. Journal of Applied Physics 34 (12), pp. 3495–3499 (en). External Links: ISSN 0021-8979, 1089-7550, Link, Document Cited by: §I.
- [7] External Links: 2601.11296, Link Cited by: §I.
- [8] (2019-12) Search for light dark matter interactions enhanced by the migdal effect or bremsstrahlung in xenon1t. Phys. Rev. Lett. 123, pp. 241803. External Links: Document, Link Cited by: §IV.
- [9] (1993) Principles and mechanisms of ion induced electron emission. 78 (1), pp. 223–238. External Links: ISSN 0168-583X, Document, Link Cited by: §I.
- [10] (2019-02) Invisible decay modes in nuclear gamma cascades. 99, pp. 035025. External Links: Document, Link Cited by: §IV.
- [11] External Links: 2510.25834, Link Cited by: §IV.
- [12] (2025-02) Massive quantum systems as interfaces of quantum mechanics and gravity. Rev. Mod. Phys. 97, pp. 015003. External Links: Document, Link Cited by: §I.
- [13] (2023-09) Entanglement-enhanced optomechanical sensor array with application to dark matter searches. Commun Phys 6 (1), pp. 1–9. External Links: ISSN 2399-3650, Link, Document Cited by: §I.
- [14] (2022-02) Millicharged dark matter detection with ion traps. 3, pp. 010330. External Links: Document, Link Cited by: §IV.
- [15] (2021-05) Reducing the impact of radioactivity on quantum circuits in a deep-underground facility. 12 (1), pp. 2733. External Links: ISSN 2041-1723, Link, Document Cited by: §IV.
- [16] (2021-08) Trapped electrons and ions as particle detectors. 127, pp. 061804. External Links: Document, Link Cited by: §IV.
- [17] (2023-02) Searches for massive neutrinos with mechanical quantum sensors. PRX Quantum 4 (1), pp. 010315. External Links: ISSN 2691-3399, Link, Document Cited by: §I, §IV.
- [18] (2011-08) Relaxation and frequency shifts induced by quasiparticles in superconducting qubits. 84, pp. 064517. External Links: Document, Link Cited by: §IV.
- [19] (2023-06) Comprehensive study of radon progeny attachment to surfaces. 107, pp. 065802. External Links: Document, Link Cited by: §I.
- [20] (2025) Direct neutrino-mass measurement based on 259 days of katrin data. 388 (6743), pp. 180–185. External Links: Document Cited by: §I.
- [21] (2025-10) High-purity quantum optomechanics at room temperature. 21 (10), pp. 1603–1608. External Links: ISSN 1745-2481, Link, Document Cited by: §I.
- [22] (2025-07) Primary activity measurement of an am-241 solution using microgram inkjet gravimetry and decay energy spectrometry. MetrologiaKgl. Danske Videnskab., Selskab. Mat. Fys. Medd.Applied Surface ScienceProgress in Nuclear EnergyAstroparticle PhysicsScienceAstroparticle PhysicsPhys. Rev. Lett.Nature PhysPhys. Rev. Lett.Phys. Rev. APhys. Rev. Lett.Sci RepPhys. Rev. APhys. Rev. APhys. Rev. XJ. High Energ. Phys.Journal of InstrumentationJournal of InstrumentationPhys. Rev. DPhys. Rev. Lett.Phys. Rev. DJournal of InstrumentationPhys. Rev. DNaturePhys. Rev.Jpn. J. Appl. Phys.At EnergyPhys. Rev. AProceedings of the 8th Pfefferkorn Conference on Fundamental Beam Interactions with Solids for Microscopy, Microanalysis and MicrolithographyJournal of Environmental RadioactivityPRX QuantumPhys. Rev. Appl.Eur. Phys. J. PlusJournal of InstrumentationPhys. Rev. DPRX QuantumNatureNat CommunPhys. Rev. BPhys. Rev. Lett.Fundamental ResearchNature. Phys.ScienceNatureNature PhysPhys. Rev. Res.Environmental Science & TechnologyPhys. Rev. Lett.Phys. Rev. CPhys. Rev. DPhys. Rev. Lett.Nuclear Instruments and Methods in Physics Research Section B: Beam Interactions with Materials and Atoms 62 (4), pp. 045005. External Links: Document, Link Cited by: §I.
- [23] (2011) Radon induced background processes in the katrin pre-spectrometer. 35 (3), pp. 128–134. External Links: ISSN 0927-6505, Document, Link Cited by: §I.
- [24] (2022) KATRIN background due to surface radioimpurities. 138, pp. 102686. External Links: ISSN 0927-6505, Document, Link Cited by: §I.
- [25] (2021-10) Response of the gagg(ce) scintillator to charged particles compared with the csi(tl) scintillator. 16 (10), pp. P10012. External Links: Document, Link Cited by: §II.3.
- [26] (2012-09) Subkelvin parametric feedback cooling of a laser-trapped nanoparticle. 109, pp. 103603. External Links: Document, Link Cited by: §I.
- [27] (2025-05) A custom experimental setup for scintillator characterization: application to a Ce-doped GAGG crystal. 140 (5), pp. 415 (en). External Links: ISSN 2190-5444, Link, Document Cited by: §II.3.
- [28] (2000) Exclusion limits on the wimp-nucleon elastic-scattering cross section from the cryogenic dark matter search. Ph.D. Thesis, University of California, Berkeley. External Links: Document Cited by: §III.1.
- [29] (2021) Levitodynamics: levitation and control of microscopic objects in vacuum. Science 374 (6564), pp. eabg3027. External Links: Document Cited by: §I.
- [30] External Links: 2512.00166, Link Cited by: §I.
- [31] (1992) Particle Induced Electron Emission II. Springer Tracts in Modern Physics Ser, Springer Berlin / Heidelberg, Berlin, Heidelberg. External Links: ISBN 978-3-540-54147-9 978-3-540-47447-0 Cited by: §I.
- [32] (2018-08) Sensing static forces with free-falling nanoparticles. 121, pp. 063602. External Links: Document, Link Cited by: §I.
- [33] (2018-03) Migdal effect in dark matter direct detection experiments. J. High Energ. Phys. 2018 (3), pp. 194 (en). External Links: ISSN 1029-8479, Link, Document Cited by: §IV.
- [34] (2022) Charging of radioactive and environmental airborne particles. 248, pp. 106887. External Links: ISSN 0265-931X, Document, Link Cited by: §I.
- [35] (2025) Quantum squeezing of a levitated nanomechanical oscillator. 389 (6766), pp. 1225–1228. External Links: Document, Link Cited by: §I.
- [36] (2014) Influence of radioactivity on surface charging and aggregation kinetics of particles in the atmosphere. 48 (1), pp. 182–189. External Links: Document, Link Cited by: §I.
- [37] (1976-09) Secondary Electron Emission from Ni and Al by High-Energy Proton and α-Particle Bombardment. 15 (9), pp. 1811–1812 (en). External Links: ISSN 0021-4922, 1347-4065, Link, Document Cited by: §I.
- [38] (2025-07) Impulse measurements enhanced with squeezed readout light. Phys. Rev. Res. 7, pp. 033041. External Links: Document, Link Cited by: §I.
- [39] (2023-06) Search for light dark matter with ionization signals in the pandax-4t experiment. 130, pp. 261001. External Links: Document, Link Cited by: §I.
- [40] (2011-07) Millikelvin cooling of an optically trapped microsphere in vacuum. 7 (7), pp. 527–530 (en). External Links: ISSN 1745-2481, Link, Document Cited by: §I.
- [41] (2023) Yoctonewton force detection based on optically levitated oscillator. 3 (1), pp. 57–62. External Links: ISSN 2667-3258, Document, Link Cited by: §I.
- [42] (2021-07) Real-time optimal quantum control of mechanical motion at room temperature. Nature 595 (7867), pp. 373–377. External Links: ISSN 1476-4687, Link, Document Cited by: §I, §I.
- [43] (2018-11) Nuclear recoil spectroscopy of levitated particles. 98, pp. 052103. External Links: Document, Link Cited by: §I.
- [44] (2010-09) Vacuum friction in rotating particles. Phys. Rev. Lett. 105 (11), pp. 113601. External Links: ISSN 0031-9007, 1079-7114, Link, Document Cited by: §I.
- [45] External Links: 2601.22283, Link Cited by: §I.
- [46] (2020-05) Locality and entanglement in table-top testing of the quantum nature of linearized gravity. 101, pp. 052110. External Links: Document, Link Cited by: §I.
- [47] (2023-09) Quantum theory of light interaction with a lorenz-mie particle: optical detection and three-dimensional ground-state cooling. Phys. Rev. A 108, pp. 033714. External Links: Document, Link Cited by: §I.
- [48] (2022-07) Ponderomotive squeezing of light by a levitated nanoparticle in free space. Phys. Rev. Lett 129 (5), pp. 053602. External Links: ISSN 0031-9007, 1079-7114, Link, Document Cited by: §I.
- [49] (2020-10) Search for composite dark matter with optically levitated sensors. Phys. Rev. Lett. 125 (18), pp. 181102. External Links: ISSN 0031-9007, 1079-7114, Document Cited by: §I.
- [50] (2017-12) Optical levitation of 10-ng spheres with nano-g acceleration sensitivity. Phys. Rev. A 96 (6), pp. 063841. External Links: Link, Document Cited by: §II.1.
- [51] (2021) Searching for new physics using optically levitated sensors. Quantum Sci. Technol. 6, pp. 014008. External Links: Document Cited by: §I.
- [52] (2023-07) Simultaneous ground-state cooling of two mechanical modes of a levitated nanoparticle. 19 (7), pp. 1009–1013. External Links: ISSN 1745-2481, Link, Document Cited by: §I.
- [53] (2022-07) Two-dimensional quantum motion of a levitated nanosphere. 4, pp. 033051. External Links: Document, Link Cited by: §I.
- [54] (2016-05) Zeptonewton force sensing with nanospheres in an optical lattice. 93, pp. 053801. External Links: Document, Link Cited by: §I.
- [55] (2024-10) Non-Hermitian dynamics and non-reciprocity of optically coupled nanoparticles. Nature Phys 20 (10), pp. 1629–1635. External Links: ISSN 1745-2481, Link, Document Cited by: §I.
- [56] (2025-08) Quantum delocalization of a levitated nanoparticle. 135, pp. 083601. External Links: Document, Link Cited by: §I.
- [57] (2013-10) Matter-wave interferometry of a levitated thermal nano-oscillator induced and probed by a spin. Phys. Rev. Lett. 111, pp. 180403. External Links: Document, Link Cited by: §I.
- [58] (2025-05) Optimal sensing of momentum kicks with a feedback-controlled nanomechanical resonator. 23, pp. 054016. External Links: Document, Link Cited by: §III.1.
- [59] (2014) Optically measuring force near the standard quantum limit. Science 344 (6191), pp. 1486–1489. External Links: Link, Document Cited by: §I.
- [60] (1963-06) Secondary electron emission produced by relativistic primary electrons. 130, pp. 2135–2141. External Links: Document, Link Cited by: §I.
- [61] (2025-03) Optical levitation of arrays of microspheres. Phys. Rev. A 111 (3), pp. 033514 (en). External Links: ISSN 2469-9926, 2469-9934, Link, Document Cited by: §I.
- [62] External Links: 2601.19392, Link Cited by: §I, §I.
- [63] External Links: Link, 2404.03102 Cited by: §I.
- [64] (2019-10) Optimal position detection of a dipolar scatterer in a focused field. Phys. Rev. A 100, pp. 043821. External Links: Document, Link Cited by: §I.
- [65] (2021-07) Quantum control of a nanoparticle optically levitated in cryogenic free space. 595 (7867), pp. 378–382. External Links: ISSN 1476-4687, Link, Document Cited by: §I.
- [66] External Links: Link, Document, 2509.13398 Cited by: §I.
- [67] (2025-12) Search for Dark Matter Scattering from Optically Levitated Nanoparticles. PRX Quantum 6 (4), pp. 040367. External Links: Link, Document Cited by: §I.
- [68] (2026-01) Optomechanical vector sensing of new forces at 6 micron separation. 16, pp. 5180. External Links: ISSN 2045-2322, Link Cited by: §I.
- [69] (2020-08) Impact of ionizing radiation on superconducting qubit coherence. 584 (7822), pp. 551–556. External Links: ISSN 1476-4687, Link, Document Cited by: §IV.
- [70] (2024-07) Mechanical Detection of Nuclear Decays. Phys. Rev. Lett. 133 (2), pp. 023602. External Links: Link, Document Cited by: §I, §II.1, §II.1, §II.2, §II.2, §II.2, §II.3, §II.3, §III.1.
- [71] (2026-01) Direct observation of the Migdal effect induced by neutron bombardment. 649 (8097), pp. 580–583 (en). External Links: ISSN 1476-4687, Link, Document Cited by: §IV.
- [72] (2023-09) Non-Hermitian physics of levitated nanoparticle array. Phys. Rev. Res. 5 (3), pp. 033217. External Links: Link, Document Cited by: §I.
- [73] (2012-09) Rotational Quantum Friction. Phys. Rev. Lett. 109 (12), pp. 123604. External Links: ISSN 0031-9007, 1079-7114, Link, Document Cited by: §I.