Reference-Free Image Quality Assessment for Virtual Try-On via Human Feedback
Abstract
Given a person image and a garment image, image-based Virtual Try-ON (VTON) synthesizes a try-on image of the person wearing the target garment. As VTON systems become increasingly important in practical applications such as fashion e-commerce, reliable evaluation of their outputs has emerged as a critical challenge. In real-world scenarios, ground-truth images of the same person wearing the target garment are typically unavailable, making reference-based evaluation impractical. Moreover, widely used distribution-level metrics such as Fréchet Inception Distance and Kernel Inception Distance measure dataset-level similarity and fail to reflect the perceptual quality of individual generated images. To address these limitations, we propose Image Quality Assessment for Virtual Try-On (VTON-IQA), a reference-free framework for human-aligned, image-level quality assessment without requiring ground-truth images. To model human perceptual judgments, we construct VTON-QBench, a large-scale human-annotated benchmark comprising 62,688 try-on images generated by 14 representative VTON models and 431,800 quality annotations collected from 13,838 qualified annotators. To the best of our knowledge, this is the largest dataset to date for human subjective evaluation in virtual try-on. Evaluating virtual try-on quality requires verifying both garment fidelity and the preservation of person-specific details. To explicitly model such interactions, we introduce an Interleaved Cross-Attention module that extends standard transformer blocks by inserting a cross-attention layer between self-attention and MLP in the latter blocks. Extensive experiments show that VTON-IQA achieves reliable human-aligned image-level quality prediction. Moreover, we conduct a comprehensive benchmark evaluation of 14 representative VTON models using VTON-IQA. The dataset and source code will be released at https://github.com/litelightlite/VTON-IQA.
1 Introduction
Image-based Virtual Try-On (VTON) aims to synthesize a realistic composite image of a target person wearing a given garment, conditioned on a person image and a garment image. In the fashion e-commerce domain, it has attracted considerable attention as a means of providing an online try-on experience and bridging the gap between online and in-store shopping. Despite its growing practical importance, reliable evaluation remains a fundamental challenge. In real-world deployment, ground-truth images of the same person wearing the target garment are typically unavailable, making reference-based metrics such as Structural Similarity Index (SSIM) [ssim] and Learned Perceptual Image Patch Similarity (LPIPS) [lpips] inapplicable. In contrast, distribution-level metrics such as Fréchet Inception Distance (FID) [fid] and Kernel Inception Distance (KID) [kid] measure dataset-level statistics and fail to reflect the quality of individual generated images. Recent works have explored evaluation methods specifically designed for virtual try-on that do not require ground-truth images [vtonqa, vtonvllm, vtbench]. While these approaches represent meaningful progress toward task-specific and reference-free evaluation, comprehensive validation against large-scale human user studies remains scarce. Furthermore, the lack of publicly available implementations and standardized evaluation benchmarks makes it difficult to conduct reproducible evaluations and to support steady progress in the virtual try-on community.
To address these challenges, we propose Image Quality Assessment for Virtual Try-On (VTON-IQA), a reference-free framework designed to approximate human perceptual judgment without requiring ground-truth images. By taking as input a person image, a garment image, and the corresponding generated try-on image, VTON-IQA outputs a continuous quality score aligned with human subjective evaluation. To model human perceptual judgments, we construct VTON-QBench, a large-scale human-annotated benchmark tailored to virtual try-on images. VTON-QBench comprises 62,688 try-on images generated by 14 representative VTON models, annotated through crowdsourced subjective evaluation. Since crowdsourcing inevitably introduces variability in annotation quality, including inattentive or adversarial responses, we design a dedicated data curation pipeline to quantitatively assess annotator consistency and reliability. This process enables the identification and exclusion of unreliable annotators from the final dataset. As a result, VTON-QBench contains 431,800 high-quality annotations collected from 13,838 qualified annotators. To the best of our knowledge, this is the largest dataset to date for human subjective quality evaluation in the virtual try-on domain. Through this framework and dataset, our method provides a scalable and reproducible alternative to large-scale user studies for evaluating virtual try-on quality.
Evaluating the quality of try-on image fundamentally differs from conventional single-image IQA, which predicts quality based solely on features extracted from a single input image [qalign, clipiqa]. In virtual try-on, quality assessment requires verifying both garment fidelity and the preservation of non-target visual elements, including the person’s identity, previously worn clothing, and background. This inherently necessitates modeling cross-image interactions between the generated try-on image and its input garment and person images. To achieve this, we introduce an Interleaved Cross-Attention (ICA) module, which extends standard transformer blocks by inserting a cross-attention layer between self-attention and MLP in the latter half blocks. By enabling structured interactions across the try-on, garment, and person representations, ICA allows the model to jointly evaluate whether garment attributes are faithfully transferred while ensuring that non-target regions remain visually consistent and free of artifacts. Extensive experiments demonstrate that ICA effectively captures quality factors specific to virtual try-on and achieves strong alignment with human perception.
Furthermore, we conduct a comprehensive benchmark evaluation of 14 representative virtual try-on models using VTON-IQA. The source code, pretrained weights of VTON-IQA, and VTON-QBench will be publicly released. We anticipate that our framework will serve as a fair, reproducible, and reference-free evaluation criterion, contributing to the standardization of quality assessment and advancing research in virtual try-on.
2 Related Work
Image-based Virtual Try-On. Given a person image and a garment image, image-based virtual try-on synthesizes a try-on image of the person wearing the target garment. Early approaches [viton, vitonhd, hrviton, sdviton] predominantly followed a two-stage pipeline. A clothing-agnostic representation was first constructed by removing garment-related information from the person image, after which the target garment was geometrically aligned to the body using Thin-Plate Spline transformation and fused via a Generative Adversarial Network (GAN) [gan]. Subsequent works improved robustness to complex poses and occlusions through human parsing, pose estimation, and enhanced warping–fusion modules, leading to better texture preservation and more natural garment boundaries [vitonhd, hrviton, sdviton, clothflow, acgpn, pfafn, gpvton]. More recently, diffusion-based approaches have gained popularity due to their strong ability to reproduce high-frequency details and generate high-resolution images [ddpm, stablediffusion]. Early diffusion-based VTON models leveraged pretrained latent diffusion backbones and incorporated garment features as conditioning signals within U-Net architectures [tryondiffusion, ladi]. Later works explored improved conditioning strategies and architectural refinements. For example, IDM-VTON [idm] enhances garment fidelity by disentangling semantic and texture features within attention modules, whereas CatVTON [catvton] adopts a simplified end-to-end design by spatially concatenating person and garment images. Recent efforts have further transitioned to Diffusion Transformers (DiT) [dit], which offer stronger global modeling through self-attention [any2any, fitdit, qwenedit], enabling improved long-range dependency modeling of garment structure and texture. In parallel, advances in proprietary image editing models [nanobanana, gptimage] demonstrate that high-quality virtual try-on can be achieved in a zero-shot manner using a person image, a garment image, and appropriate textual prompts.
Quality Assessment for Virtual Try-On. Recent works have explored evaluation frameworks for virtual try-on that do not require ground-truth images. VTON-VLLM [vtonvllm] trains a multimodal large language model using human annotations on LLM-generated critiques of synthesized try-on images, enabling preference-aware evaluation and feedback. However, its focus is on validating and generating textual critiques rather than learning a direct quantitative image-level quality predictor. VTBench [vtbench] introduces a hierarchical benchmark with multi-dimensional evaluation criteria, providing a comprehensive diagnostic framework. While it incorporates human-aligned signals through LLM-based judgment and aesthetic models, it does not explicitly learn a unified quality assessment model from large-scale human perceptual annotations. VTONQA [vtonqa] is most closely related to our work, as it constructs a human-annotated dataset to train a virtual try-on quality evaluator. However, the relatively limited dataset scale may restrict the robustness of the learned model. In contrast, we construct a large-scale human-annotated benchmark and learn a reference-free, image-level quality assessment model aligned with human perceptual judgment.
3 VTON-QBench

| Method | # Pair | # Try-On | # VTON Model | # Annotator | # Annotation | OSS |
|---|---|---|---|---|---|---|
| VTONQA [vtonqa] | 748 | 8,132 | 11 | 40 | N/R | No |
| VTON-QBench | 13,153 | 62,688 | 14 | 13,838 | 431,800 | Yes |
To enable human-aligned quality assessment for VTON, we construct VTON-QBench, a large-scale dataset comprising 62,688 try-on images generated by 14 representative models and 431,800 quality annotations collected from 13,838 crowd workers who met reliability criteria. As shown in Tab. 1, VTON-QBench is larger in scale than the concurrent work [vtonqa] and, to the best of our knowledge, the only publicly available dataset for human subjective evaluation in VTON.
3.1 Image Preparation
Data Augmentation via Synthetic Garment–Person Pairs. VTON-QBench is built upon the test splits of VITON-HD [vitonhd] and Dress Code [dresscode], both of which provide high-quality garment–person image pairs . However, since our construction is restricted to their test sets, the diversity of garment styles and person appearances is limited. To alleviate this constraint, we augment the data with synthetic garment–person pairs, as illustrated in Fig. 2. We generate additional pairs based on the fashion taxonomy of MyStyleBox [mystylebox2026fashion], covering styles such as casual, street, formal, minimal, and vintage. We employ FLUX.1-dev [flux2024] and train a LoRA specialized for garment–person pair generation [lhhuang2024iclora] on an internally collected dataset. Since synthesis can introduce attribute inconsistencies (e.g., category, color, shape, texture), we apply a two-stage verification process: (1) automatic attribute consistency filtering using GPT and (2) manual inspection by fashion experts. Only visually plausible pairs with consistent garment attributes are retained. As a result, the number of garment–person pairs increases from 6,981 to 13,153 (approximately 1.9).
Pseudo-Triplet Construction. To enable comparison with full-reference metrics such as SSIM [ssim] and LPIPS [lpips], we construct pseudo-triplets from existing garment–person pairs . Specifically, given a different garment image , we apply a strong virtual try-on model to generate
| (1) |
We then form the pseudo-triplet , introducing a pseudo ground-truth reference image into an otherwise unpaired setting and enabling systematic comparison with reference-based metrics. In our experiments, we use Nano Banana Pro [nanobanana] as a strong virtual try-on model . Since generation may introduce unintended changes (e.g., pose shifts, background alterations, or modifications beyond the target garment region), we manually filter the generated samples and retain only those where garment transfer is the primary difference while preserving the person structure and background.
Try-On Image Generation. We generated virtual try-on images using 14 representative models, including VITON-HD [vitonhd], HR-VITON [hrviton], LADI-VTON [ladi], SD-VITON [sdviton], CAT-DM [catdm], OOTDiffusion [oot], IDM-VTON [idm], CatVTON [catvton], CatVTON-FLUX [catvton], FitDit [fitdit], Any2AnyTryon [any2any], Qwen-Image-Edit [qwenedit], Nano Banana Pro [nanobanana], and GPT-Image-1.5 [gptimage]. We adopted publicly released pretrained models and followed the recommended settings whenever available. To simulate realistic scenarios, garments different from those originally worn by the target person were randomly selected for virtual try-on.


3.2 Annotation Protocol
For each clothing image , person image , and generated try-on image , we collect a set of independent quality annotations from multiple crowd workers. Preliminary experiments indicated that evaluating garment length consistency is difficult when only the clothing image is provided. Therefore, we additionally present a reference image , in which the garment is worn by a real person, as auxiliary context. Each questionnaire contains 50 evaluation tasks. While the questionnaire structure and evaluation format are fixed, we generated 2,139 questionnaires by varying the presented image triplets. Each questionnaire was assigned to multiple crowd workers to ensure that every sample was evaluated independently multiple times. Each annotation follows a three-level ordinal scale: (1) Unnatural, (2) Slightly unnatural, but not noticeable, (3) Completely natural. The final subjective quality score is computed as the average of numerical ratings from multiple annotators:
| (2) |
where is defined as follows:
| (3) |
3.3 Dataset Curation
Crowdsourced annotation inevitably introduces variability, including careless responses. To ensure reliability, we apply a two-stage curation pipeline to remove unreliable annotators and low-quality annotations. In the first stage, we perform sanity checks using five shared dummy tasks with unambiguous answers among the 50 tasks assigned to each annotator; those who fail are removed. We further exclude annotators who select identical responses for more than 80% of tasks or disagree with the majority vote in over 60% of cases. As a result, the questionnaire-level agreement, measured by Krippendorff’s [krippendorff], increases from 0.286 to 0.550. In the second stage, we discard questionnaires with , retaining only annotations above the commonly accepted reliability threshold for subjective tasks [ku2024imagenhub].
4 Image Quality Assessment for VTON (VTON-IQA)
Given a garment image , a person image , and a generated try-on image , VTON-IQA predicts a continuous quality score aligned with human perceptual judgment. This section presents the overall architecture of VTON-IQA and details the proposed Interleaved Cross-Attention (ICA) module.

4.1 Model Architecture
We adopt a three-branch transformer architecture to process the garment image , the person image , and the generated try-on image , as illustrated in Fig. 3. Each image is first embedded into a sequence of patch tokens augmented with a [CLS] token:
| (4) |
where is the number of tokens and is the embedding dimension.
The feature extraction module consists of transformer blocks. For the first half of the network, standard transformer blocks are applied independently to each branch:
| (5) |
In the latter layers, we extend the standard transformer block by introducing the proposed ICA module. Unlike conventional multi-branch designs that symmetrically model all pairwise interactions, ICA is motivated by the observation that virtual try-on quality primarily depends on the consistency between the generated try-on image and its corresponding garment and person images. Specifically, after the self-attention operation, cross-attention is applied between the try-on representation and each of the garment and person representations. In other words, interactions are explicitly modeled for the modality pairs and in both directions. The cross-attention features are computed as
| (6) | ||||
To reflect the asymmetric dependency structure, the try-on representation aggregates contributions from both garment and person features:
| (7) |
In contrast, the garment and person branches only incorporate information from the try-on branch:
| (8) |
This asymmetric interaction design emphasizes that the quality judgment is fundamentally centered on the generated try-on image, which must be evaluated with respect to both garment fidelity and preservation of person-specific attributes. By explicitly modeling and interactions while avoiding unnecessary coupling, ICA provides structured relational modeling tailored to virtual try-on quality assessment.
After the final layer , we extract the [CLS] token from each branch to obtain compact global representations , , and for the garment, person, and try-on images, respectively. We first compute an intermediate relational score as a weighted combination of cosine similarities between the try-on representation and the garment/person representations:
| (9) |
where is a learnable scalar parameter that adaptively balances the relative importance of garment consistency and preservation of non-target regions. This formulation explicitly captures two complementary aspects of virtual try-on quality: (i) garment consistency via the similarity between and , and (ii) preservation of non-target regions via the similarity between and . By learning , the model dynamically weights these two relational components, allowing the overall quality score to reflect their relative significance in human perceptual judgment. Finally, the predicted score is obtained through a learnable affine transformation followed by a activation:
| (10) |
where and are learnable scalar parameters. The function constrains the score to the bounded interval , which improves numerical stability, enhances interpretability, and enables consistent comparison across models.
4.2 Loss Function
Human ratings for virtual try-on images can exhibit high variance on an absolute scale, whereas relative preferences between two outputs for the same person–garment pair are often more consistent. We therefore optimize a joint objective that combines pairwise preference learning with score regression.
Inspired by the Bradley–Terry model [bt], we model pairwise preferences between two try-on results, and , generated from the same person–garment pair . The predicted preference probability is defined as
| (11) |
where denotes the sigmoid function, is the predicted quality score, and is a temperature parameter. Similarly, given the human evaluation scores and assigned to and , the empirical human preference probability is defined as
| (12) |
The overall objective is given by the soft-label cross-entropy combined with a score regression term:
| (13) |
The first term aligns the predicted pairwise preference distribution with the empirical human preference distribution via soft-label cross-entropy, while the second term enforces consistency between the predicted quality scores and the corresponding human ratings.
5 Experiments
We train VTON-IQA on VTON-QBench and evaluate it on the held-out test set against conventional full-reference metrics and a zero-shot baseline model. We report correlation with human ratings and pairwise ranking accuracy, and conduct ablation studies to quantify the effect of the proposed ICA module. Finally, we apply VTON-IQA to benchmark 14 representative VTON models on Dress Code and VITON-HD under both paired and unpaired settings.
5.1 Experimental Setup
Implementation Details. We build VTON-IQA on top of DINOv3 ViT-L/16 [dinov3]. To integrate the proposed ICA module, we augment the last 12 transformer blocks with ICA layers and fine-tune both the original parameters of these blocks and the inserted ICA layers. The model is optimized using AdamW [adamw] with a batch size of 16 and a learning rate of . We employ early stopping based on the validation loss, selecting the checkpoint with the lowest validation loss if no improvement is observed for three consecutive epochs. Training is conducted on a single NVIDIA A100 (40GB) GPU using bfloat16 mixed-precision.
Evaluation Dataset. We split VTON-QBench into 43,948 training, 5,702 validation, and 13,038 test samples, with disjoint person and garment identities across splits. The subjective quality scores are normalized to the range of .
Baselines. We compare our method against representative full-reference image quality assessment metrics, including SSIM [ssim] and LPIPS [lpips]. We include DINOv3 ViT [dinov3] as a strong zero-shot baseline, where garment, person, and try-on images are processed independently and the final score is computed using the cosine similarity formulation in Eq. (9). We evaluate two configurations of VTON-IQA: one without the ICA module and the full model with ICA.
Metrics. We evaluate prediction performance by measuring correlation with human subjective scores using Pearson’s Linear Correlation Coefficient (PLCC, ) and Spearman’s Rank Correlation Coefficient (SRCC, ). Regression accuracy is assessed using the coefficient of determination (). In addition, we report macro () and micro () pairwise accuracy at the garment–person pair level. For pairwise evaluation, binary labels are derived from the relative ordering of human scores; a pair is considered correctly ranked if the predicted scores preserve the ground-truth preference between two samples.
5.2 Quantitative Results
Comparison with Baselines. Tab. 2 summarizes the evaluation results on the test set of VTON-QBench. For SSIM, LPIPS, and zero-shot DINOv3, and are not reported, as their score scales are not directly comparable to human subjective ratings, rendering these statistics less meaningful. Note that LPIPS is originally a “lower-is-better” metric; for consistency, we compute all correlation and regression metrics on its negated values so that all metrics follow a “higher-is-better” convention. Among conventional full-reference metrics, SSIM exhibits weak alignment with human judgment, achieving low PLCC and pairwise accuracy. LPIPS performs better than SSIM but still shows a substantial gap compared to learning-based approaches. The comparison between zero-shot DINOv3 and VTON-IQA without ICA highlights the importance of task-specific training on VTON-QBench, while further performance gains obtained by incorporating garment–person interaction modeling demonstrate the effectiveness of the proposed ICA module. The full VTON-IQA achieves the highest scores across all reported metrics, with , , and the best macro and micro pairwise accuracy.
| Scorer | reference-free | fine-tuned | |||||
|---|---|---|---|---|---|---|---|
| SSIM [ssim] | – | 0.135 | – | 0.596 | 0.593 | ||
| LPIPS [lpips] | – | 0.387 | – | 0.701 | 0.695 | ||
| DINOv3 [dinov3] | – | 0.261 | – | 0.637 | 0.641 | ||
| VTON-IQA w/o ICA | 0.617 | 0.615 | 0.372 | 0.722 | 0.747 | ||
| VTON-IQA | 0.750 | 0.751 | 0.553 | 0.781 | 0.790 |
Comparison with Human. To estimate human performance, we split the annotators in the test set into two disjoint groups and compute independent quality scores from each group. One group is treated as ground-truth labels, while the other serves as predictions. This random partitioning is repeated 10 times, and we report the mean and standard deviation of the metrics across runs. For fair comparison with human performance, VTON-IQA is evaluated against labels derived from only half of the annotators in the test set, while being trained on quality scores aggregated from all available annotators in the training set. Tab. 3 presents the comparison between human performance and our model. For correlation-based metrics ( and ) and the coefficient of determination (), a noticeable gap remains between our model and human performance, indicating room for further improvement in capturing fine-grained perceptual alignment. In contrast, our method achieves performance close to the human level in terms of macro accuracy () and micro accuracy (). This suggests that, for pairwise quality comparisons of individual try-on images, the proposed model demonstrates human-comparable decision consistency.
| Scorer | |||||
|---|---|---|---|---|---|
| Ours | |||||
| Human |
5.3 Qualitative Results

Fig. 4 presents representative qualitative comparisons. From left to right, the columns show the garment image, the target person image, the generated try-on results (columns 3–7), and the ground-truth image. The try-on results are arranged in ascending order of human subjective scores. The value at the top-right of each image indicates the human score, while the black box at the top-left shows the ranking assigned by each metric. In the first row, only the human-rated best sample faithfully preserves both garment length and printed text details. Both our method and LPIPS correctly identify this sample as the top result, demonstrating sensitivity to fine-grained garment consistency. The second and third rows illustrate the impact of global transformations. The second row involves pose variation, whereas the third exhibits differences in zoom level, which commonly arise in mask-free try-on models without strict pose or scale constraints. Because SSIM and LPIPS rely on pixel- or feature-level alignment, they tend to over-penalize such global transformations, resulting in rankings that deviate from human judgment. In contrast, our method maintains rankings consistent with human perception, indicating robustness to pose and zoom variations.
| paired | unpaired | |||||||
| Method | Ours | FID | KID | SSIM | LPIPS | Ours | FID | KID |
| Proprietary image edit model | ||||||||
| Nano Banana Pro [nanobanana] | 0.305 | 1.837 | 0.471 | 0.917 | 0.045 | 0.295 | 5.179 | 1.048 |
| GPT-Image-1.5 [gptimage] | 0.237 | 4.270 | 0.729 | 0.824 | 0.170 | 0.205 | 5.621 | 0.845 |
| DiT-based diffusion | ||||||||
| Qwen-Image-Edit [qwenedit] | -0.094 | 6.827 | 4.541 | 0.928 | 0.066 | -0.081 | 7.495 | 3.477 |
| CatVTON-FLUX [catvton] | 0.014 | 3.093 | 0.291 | 0.890 | 0.122 | -0.132 | 4.914 | 0.767 |
| FitDit [fitdit] | 0.219 | 3.374 | 0.623 | 0.899 | 0.083 | 0.153 | 4.771 | 0.642 |
| Any2AnyTryon [any2any] | -0.045 | 4.312 | 1.347 | 0.895 | 0.133 | -0.236 | 6.359 | 1.800 |
| U-Net-based diffusion | ||||||||
| LADI-VTON [ladi] | -0.562 | 6.608 | 2.907 | 0.893 | 0.150 | -0.694 | 9.131 | 4.414 |
| CAT-DM [catdm] | -0.412 | 5.643 | 2.229 | 0.881 | 0.143 | -0.741 | 8.189 | 3.408 |
| OOTDiffusion [oot] | -0.230 | 4.571 | 1.044 | 0.888 | 0.080 | -0.511 | 8.593 | 2.981 |
| IDM-VTON [idm] | 0.141 | 3.223 | 0.797 | 0.911 | 0.058 | -0.349 | 4.931 | 1.095 |
| CatVTON [catvton] | -0.081 | 5.306 | 1.841 | 0.882 | 0.110 | -0.232 | 6.927 | 2.015 |
| GAN-based | ||||||||
| VITON-HD [vitonhd] | -0.933 | 94.605 | 90.826 | 0.854 | 0.224 | -0.933 | 96.261 | 94.204 |
| HR-VITON [hrviton] | -0.835 | 20.873 | 8.767 | 0.917 | 0.109 | -0.841 | 22.626 | 9.337 |
| SD-VITON [sdviton] | -0.868 | 17.494 | 5.736 | 0.911 | 0.107 | -0.874 | 19.575 | 6.798 |
| paired | unpaired | |||||||
| Method | Ours | FID | KID | SSIM | LPIPS | Ours | FID | KID |
| Proprietary image edit model | ||||||||
| Nano Banana Pro [nanobanana] | 0.303 | 3.318 | 0.707 | 0.904 | 0.052 | 0.315 | 10.309 | 2.454 |
| GPT-Image-1.5 [gptimage] | 0.255 | 9.613 | 3.500 | 0.768 | 0.220 | 0.234 | 12.801 | 4.631 |
| DiT-based diffusion | ||||||||
| Qwen-Image-Edit [qwenedit] | 0.137 | 6.195 | 2.849 | 0.882 | 0.071 | 0.087 | 10.706 | 3.030 |
| CatVTON-FLUX [catvton] | 0.207 | 5.470 | 0.413 | 0.872 | 0.132 | -0.025 | 9.084 | 0.878 |
| FitDit [fitdit] | 0.230 | 8.048 | 1.232 | 0.843 | 0.144 | 0.189 | 9.893 | 1.355 |
| Any2AnyTryon [any2any] | 0.074 | 9.043 | 3.271 | 0.860 | 0.169 | -0.082 | 12.018 | 3.892 |
| U-Net-based diffusion | ||||||||
| LADI-VTON [ladi] | -0.756 | 15.404 | 7.416 | 0.847 | 0.202 | -0.864 | 21.515 | 12.333 |
| CAT-DM [catdm] | -0.419 | 9.154 | 2.340 | 0.842 | 0.171 | -0.511 | 11.774 | 3.141 |
| OOTDiffusion [oot] | 0.018 | 5.915 | 0.290 | 0.845 | 0.114 | -0.142 | 9.064 | 0.543 |
| IDM-VTON [idm] | 0.151 | 6.007 | 0.775 | 0.865 | 0.101 | 0.039 | 9.093 | 1.119 |
| CatVTON [catvton] | -0.163 | 9.082 | 2.710 | 0.833 | 0.196 | -0.266 | 11.199 | 2.824 |
| GAN-based | ||||||||
| VITON-HD [vitonhd] | -0.512 | 9.450 | 1.956 | 0.877 | 0.130 | -0.559 | 11.535 | 2.437 |
| HR-VITON [hrviton] | -0.420 | 9.379 | 2.578 | 0.883 | 0.118 | -0.504 | 11.809 | 2.921 |
| SD-VITON [sdviton] | -0.368 | 7.746 | 1.567 | 0.886 | 0.112 | -0.479 | 10.412 | 1.912 |
5.4 Quality Assessment Results for VTON Models
We conduct a comprehensive evaluation of 14 representative VTON models under both paired settings, where ground-truth try-on images are available, and unpaired settings, where no reference images are provided. In the paired setting, full-reference metrics such as SSIM and LPIPS are applicable, whereas unpaired evaluation typically relies on distribution-level metrics including FID and KID. As a reference-free method, VTON-IQA can be applied consistently in both settings. All experiments are performed on the original test sets of Dress Code and VITON-HD, with results reported in Tab. 4 and Tab.5. Across both datasets, proprietary image editing models achieve the highest VTON-IQA scores. Nano Banana Pro ranks first in all configurations, followed by GPT-Image-1.5, suggesting stronger alignment with human subjective ratings. By contrast, conventional full-reference metrics yield different rankings. Under SSIM and LPIPS, GPT-Image-1.5 performs substantially worse, particularly on VITON-HD, where it ranks below earlier GAN-based models. As discussed in Section 5.3, these metrics penalize global structural variations such as pose and zoom changes. To further validate this hypothesis, we randomly sample 30 results per model and find that only one Nano Banana Pro sample exhibits noticeable pose or zoom variation, compared to 19 for GPT-Image-1.5, thereby accounting for the lower SSIM/LPIPS scores. More broadly, several diffusion models achieve competitive FID/KID scores yet rank lower under VTON-IQA, indicating that distribution-level similarity does not necessarily reflect perceptual quality in virtual try-on.
6 Conclusion
We presented VTON-IQA, a reference-free, human-aligned image-level quality assessment framework for virtual try-on. To model human perceptual judgments, we constructed VTON-QBench, a large-scale human-annotated benchmark comprising 62,688 try-on images and 431,800 quality annotations collected from 13,838 annotators. By introducing an Interleaved Cross-Attention (ICA) module to explicitly model interactions between the generated try-on image and its corresponding garment and person images, our method substantially improves alignment with human subjective judgments. Through a comprehensive evaluation of 14 representative VTON models under both paired and unpaired settings, we observe that recent proprietary image editing models achieve the highest human-aligned quality scores. At the same time, conventional metrics such as SSIM, LPIPS, and FID/KID do not always reflect these improvements, highlighting a gap between pixel- or distribution-level similarity and perceptual quality in virtual try-on. Overall, VTON-IQA and VTON-QBench establish a scalable and reproducible evaluation paradigm that supports standardized and sustained progress in the virtual try-on community.
Acknowledgements
We thank Hideya Tanaka, Hiroshige Matsushita, and Motoaki Nakai for their support in building and maintaining the data collection infrastructure.
References
Appendix 0.A Additional Details on VTON-QBench
0.A.1 Synthetic Pair Generation
VTON-QBench is built on the test splits of VITON-HD [vitonhd] and Dress Code [dresscode]. However, the garment and person images contained in these test sets alone are insufficient in terms of diversity. To address this limitation, we expand the garment–person pair dataset across three categories: tops, bottoms, and dresses. Inspired by In-Context LoRA [lhhuang2024iclora], we train a dedicated model that generates a concatenated image by horizontally concatenating a garment image and a person image corresponding to an input prompt . This model enables the generation of diverse garment–person pairs for data augmentation. The synthetic pair generation pipeline consists of four stages: (1) construction of the training dataset , (2) training of the pair generation model , (3) synthetic pair generation, and (4) filtering of generated pairs. We describe each stage below.
Construction of the Training Dataset . The training dataset consists of paired samples of a concatenated image and its corresponding prompt . For each of the three categories (upper-body, lower-body, dresses), we manually collected 40 high-quality garment–person pairs. To standardize the representation and facilitate efficient learning, we introduce a prompt template (Fig. 5) that explicitly describes a two-panel layout: a product image on the left and a person wearing the same garment on the right [lhhuang2024iclora]. For each pair, the prompt is constructed by filling the placeholders <GARMENT_DESCRIPTION> and <PERSON_DESCRIPTION> using GPT. The instruction used for this annotation process is shown in Fig. 6.
Training of the Pair Generation Model .
We train using ai-toolkit, a widely used framework for diffusion model fine-tuning and LoRA training.
This toolkit enables rapid prototyping by supporting various diffusion backbones with standardized training configurations.
In our experiments, we fine-tune FLUX.1-dev [flux2024] following the default configuration provided in
train_lora_flux_24gb.yaml.
Synthetic Pair Generation. To generate diverse garment–person pairs, careful prompt design is essential. We adopt a structured strategy to ensure both systematic style control and attribute diversity. First, we define target fashion styles based on established style categories (e.g., casual, street, formal, minimal, vintage) organized by MyStyleBox [mystylebox2026fashion]. Next, for each garment category, we prepare a taxonomy of subcategories (Tab. 6) and use GPT to extract style-relevant subcategories via the prompt shown in Fig. 7. For each selected style–subcategory combination, we generate up to 50 diverse prompts using the template in Fig. 8, enabling controlled variation in attributes, coordination, and styling. This process yields diverse yet systematically structured synthetic pairs.
Filtering of Generated Pairs. Synthetic generation may introduce inconsistencies between the garment and person images in terms of category, color, shape, or texture. To ensure attribute consistency and visual validity, we introduce a three-stage filtering pipeline. First, we perform automatic filtering based on OpenPose [openpose]: (i) no person should be detected in the garment image, and (ii) exactly one front-facing person should be detected in the person image. Second, we use GPT to evaluate garment attribute consistency using the prompt shown in Fig. 9. Only pairs for which GPT outputs “No critical mismatch detected.” are retained. Finally, the remaining samples undergo manual inspection by 18 domain experts, consisting of nine practitioners who routinely handle fashion imagery and nine academic researchers in fashion-related fields. To ensure consistency, a unified evaluation guideline is established in advance and strictly followed during inspection.
| Parent Category | Subcategories |
|---|---|
| Upper-body | T-shirt, Long-sleeve T-shirt, Blazer, Blouse, Cardigan, Hoodie, Pullover, Shirt, Dress shirt, Flannel shirt, Polo shirt, Sweater, Crewneck sweater, V-neck sweater, Turtleneck, Sweatshirt, Tank top, Crop top, Vest, Zip-up hoodie, Henley shirt. |
| Lower-body | Jeans, Straight-leg jeans, Skinny jeans, Bootcut jeans, Wide-leg jeans, Cargo pants, Chinos, Slacks, Trousers, Dress pants, Corduroy pants, Track pants, Sweatpants, Joggers, Leggings, Biker shorts, Culottes, Capri pants, Shorts, Cargo shorts, Denim shorts, Skirt, Mini skirt, Midi skirt, Maxi skirt, Denim skirt, Pleated skirt, Wrap skirt, Overalls, Palazzo pants, Flare pants, Skort. |
| Dresses | Dress, Mini dress, Midi dress, Maxi dress, Evening gown, Cocktail dress, Slip dress, Bodycon dress, Sheath dress, Wrap dress, Shirt dress, Tunic dress, Sundress, Shift dress, A-line dress, Ball gown, Romper, Jumpsuit, Playsuit, Halter dress, Strapless dress. |
0.A.2 Try-On Image Generation
We generate virtual try-on images using 14 representative virtual try-on models. To ensure a fair comparison, we use the officially released pretrained weights for each model and follow the configurations recommended by the original authors. Below, we describe the details of mask generation, the procedure for adapting mask-free image editing models to the virtual try-on task.
Recomputation of Cloth-Agnostic Representations. Due to our experimental design, we construct pseudo triplets, which prevents us from directly using the precomputed clothing-agnostic representations provided in the original datasets. Moreover, different virtual try-on methods adopt distinct heuristics for generating cloth-agnostic representations. To enable a fair comparison, we therefore recompute the required human parsing and preprocessing steps for each person image, reconstructing cloth-agnostic representations separately according to the specifications of each method. In particular, the original cloth-agnostic representations in the VITON-HD dataset are generated using the Crowd Instance-level Human Parsing model [cihp], whose official implementation is provided in TensorFlow. To integrate it into our PyTorch-based inference pipeline, we convert the parser to ONNX format, enabling seamless execution within the PyTorch environment.
Adapting Mask-Free Image Editing Models to Virtual Try-On. Recent advances in mask-free image editing models enable zero-shot virtual try-on without requiring cloth-agnostic representations. In this work, we incorporate virtual try-on images generated by these mask-free image editing models, including Qwen-Image-Edit [qwenedit], Nano Banana Pro [nanobanana], and GPT-Image-1.5 [gptimage], into VTON-QBench during its construction. To perform virtual try-on, we provide the person image as the primary input, the target garment image as a secondary input, and a textual instruction describing the desired editing operation. Fig. 10 presents the prompt template used in our experiments. In the template, the placeholder <CAPTION> denotes a concise description (approximately 5–7 words) of the garment originally worn by the person. This description is automatically extracted using GPT to ensure consistent and structured prompts. The placeholder <GARMENT_CATEGORY> specifies the category of the target garment, selected from top wear, bottom wear, or dress.
0.A.3 Details of the Crowdsourcing Procedure
We recruited crowd workers via email invitations distributed through a commercial fashion platform. As compensation, participants were entered into a lottery for a gift voucher valued at approximately $20.
Appendix 0.B Additional Experimental Results
0.B.1 Human–Model Calibration Analysis
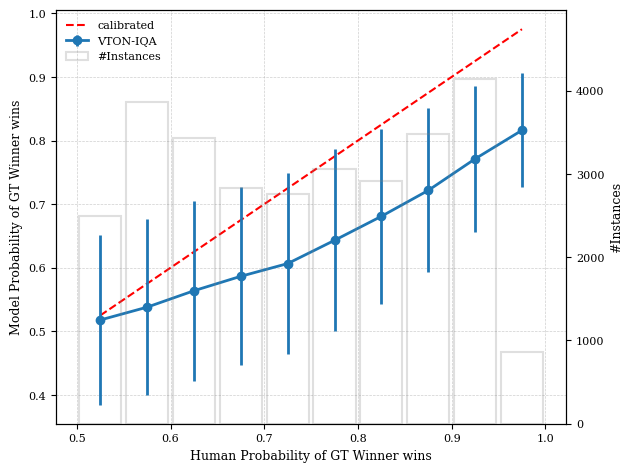
Fig. 11 shows the calibration between human judgments and model predictions across different levels of perceptual difficulty. Human difficulty is defined based on pairwise comparisons between two virtual try-on results generated for the same garment–person pair, where we compute the probability that annotators select the ground-truth (GT) image as the winner, following the procedure described in Sec. 4.2. These probabilities are grouped into bins with a width of 0.05. For each bin, we report the mean probability predicted by VTON-IQA that the GT image wins. Error bars indicate the standard deviation within each bin, while the gray bars (right axis) represent the number of instances. The red dashed line denotes perfect calibration.
As shown in the Fig. 11, the model prediction exhibits a clear positive correlation with human perceptual difficulty. When even human annotators struggle to distinguish between the two images (i.e., the human preference probability is close to 0.5), the model prediction also remains near 0.5. As the task becomes easier for humans and the GT image is more consistently preferred, the predicted probability increases accordingly. Although the predictions are not perfectly calibrated, the consistent monotonic trend indicates that VTON-IQA behaves in line with human judgments. In particular, the model is uncertain when humans are uncertain and becomes more confident as the perceptual difference becomes clearer. This suggests that the model captures meaningful perceptual signals rather than relying on unintended shortcuts.
0.B.2 Generalization to Unseen VTON Models
To evaluate the generalization ability to unseen virtual try-on models, we conduct two complementary experiments: cross-group generalization and strong-model generalization. In the first experiment, we partition the VTON models into two groups and train VTON-IQA using only samples generated by models in one group. The trained model is then evaluated on the full test set, which includes samples generated by models from both groups. This design allows us to explicitly measure how well VTON-IQA generalizes to virtual try-on models that were not observed during training. In the second experiment, we simulate a more challenging scenario in which a new and stronger virtual try-on model emerges after the deployment of the quality assessment model. Specifically, we identify the top-performing models based on VTON-IQA scores obtained from full training, remove all corresponding instances from the training and validation split, and retrain the model from scratch. We then evaluate whether the retrained VTON-IQA can still correctly assess and rank these high-performing models when used for quality assessment.
| Cond. | ||||
|---|---|---|---|---|
| K | - | |||
| U | ||||
| K+U |
| Cond. | ||
|---|---|---|
| KK | - | |
| UU | ||
| KU |


Cross-Group Generalization. To evaluate the generalization capability of VTON-IQA to unseen virtual try-on models, we partition the 14 VTON models into two groups in a manner that maintains a balanced distribution of model performance across groups. Specifically, Group 1 (G1) comprises Any2AnyTryon [any2any], CatVTON [catvton], IDM-VTON [idm], LADI-VTON [ladi], Nano Banana Pro [nanobanana], Qwen-Image-Edit [qwenedit], and VITON-HD [vitonhd]. Group 2 (G2) includes VITON-HD [vitonhd], HR-VITON [hrviton], SD-VITON [sdviton], CAT-DM [catdm], OOTDiffusion [oot], IDM-VTON [idm], CatVTON-FLUX [catvton], FitDit [fitdit], Qwen-Image-Edit [qwenedit], and GPT-Image-1.5 [gptimage]. We train VTON-IQA on the VTON-QBench training split restricted to samples generated by models in G1 and select the model based on validation performance on the validation split, also restricted to G1. The final evaluation is conducted on the full VTON-QBench test split, which includes samples generated by models from both G1 and G2. We then repeat the same procedure with the roles of G1 and G2 reversed.
Tab. 8 reports the Spearman rank correlation coefficient (SRCC), Pearson linear correlation coefficient (PLCC), and coefficient of determination (). The results are presented under three conditions: K (known models only), U (unknown models only), and K+U (all models). For Tab. 8, the relative performance drop is computed as the average decrease across the three metrics (SRCC, PLCC, and ), measured with respect to the known-only setting. Tab. 8 reports the macro accuracy , derived from pairwise comparisons between virtual try-on images. For each pair of virtual try-on models, we first compute the micro accuracy based on the correctness of VTON-IQA’s pairwise preference predictions. The macro accuracy is then obtained by averaging these micro accuracies across all model pairs. The pairwise comparison are categorized into three types: KK (comparisons between known models), UU (comparisons between unknown models), and KU (comparisons between known and unknown models). Within each category, the macro accuracy is computed by averaging the corresponding micro accuracies. In Tab. 8, denotes the relative decrease in macro accuracy with respect to the known-only setting. All reported values are presented as the mean and standard deviation over two runs, corresponding to training on G1 and training on G2, respectively.
For ranking-based metrics (Tab. 8), performance on unseen models (U) shows a relative decrease of 10.6% compared to known models (K). However, when both known and unknown models are evaluated jointly (K+U), the relative drop is reduced to 5.4%, indicating that the overall ranking consistency is largely preserved. Importantly, the SRCC remains above 0.67 even for unknown models, suggesting that relative ordering among models is still reasonably well maintained. In terms of macro accuracy (Tab. 8), the degradation is more limited. The relative drop is 3.5% for comparisons between unknown models (UU) and 4.4% for mixed comparisons (KU). This smaller decrease indicates that pairwise comparison accuracy is relatively robust to the presence of unknown models. Fig. 12 provides a visualization of the pairwise accuracy matrix. In line with the quantitative results, comparable accuracy values are observed not only within the known-model block (KK) but also within the unknown-model block (UU) and across known–unknown comparisons (KU).
Finally, to assess how the observed performance degradation on unknown models influences the final IQA outcomes, we apply VTON-IQA to the official unpaired test set of the Dress Code [dresscode] dataset. Fig. 13 illustrates a comparison of VTON-IQA scores under the full- and half-dataset training settings. Most points are distributed close to the diagonal line, indicating that the relative ordering of models is largely preserved even when training is restricted to half of the model set. Notably, the points do not exhibit a consistent directional shift depending on whether a model is known or unknown. Although minor variations are observed for individual virtual try-on models, there is no clear evidence of systematic bias related to the known/unknown distinction. These results suggest that VTON-IQA can provide fair and consistent quality assessment even for virtual try-on models that were not included in the training data.
Strong-Model Generalization.

To evaluate whether VTON-IQA can still identify top-performing models without having observed them during training, we first train VTON-IQA on the full VTON-QBench training set and determine the top three virtual try-on models (Nano Banana Pro [nanobanana], GPT-Image-1.5 [gptimage], and FitDit [fitdit]) according to its quality scores. We then remove all training instances corresponding to these three models from both the training and validation splits and retrain VTON-IQA from scratch. Finally, we examine whether the retrained model can still rank these models among the top performers when it is used as a quality assessment model.
Fig. 14 compares VTON-IQA scores on the Dress Code [dresscode] unpaired test set when trained on the full dataset versus when trained with the top three models omitted. Although a slight change in ordering is observed between Nano Banana Pro and GPT-Image-1.5, the three excluded models remain ranked above the next-best model (Qwen-Image-Edit [qwenedit]). This suggests that VTON-IQA retains sufficient sensitivity to assess the quality of future high-performing virtual try-on models beyond those currently available.
0.B.3 Exploring the Design Space of VTON-IQA Architectures
| Backbone type | Training type | |||||
|---|---|---|---|---|---|---|
| DINOv3 ViT-B/16 | Full | 0.222 | 0.242 | 0.055 | 0.592 | 0.579 |
| Last Half | 0.726 | 0.724 | 0.521 | 0.770 | 0.784 | |
| Last Quarter | 0.724 | 0.725 | 0.523 | 0.769 | 0.780 | |
| DINOv3 ViT-L/16 | Full | 0.226 | 0.254 | 0.063 | 0.609 | 0.590 |
| Last Half | 0.750 | 0.751 | 0.553 | 0.781 | 0.790 | |
| Last Quarter | 0.746 | 0.746 | 0.553 | 0.777 | 0.788 |
We conduct an ablation study to analyze the impact of backbone architecture and the number of fine-tuned layers in VTON-IQA. For the backbone, we compare DINOv3 ViT-B/16 and DINOv3 ViT-L/16. For the number of fine-tuned layers, we experiment with fine-tuning the full network, the last half of the layers, and the last quarter of the layers. As shown in Tab. 9, fine-tuning the last 12 layers of DINOv3 ViT-L/16 achieves the best overall performance.
0.B.4 Category-wise Quality Assessment Results on Dress Code
Tab. 10, Tab. 11, and Tab. 12 present the category-wise IQA results on the Dress Code dataset, covering upper-body garments, lower-body garments, and dresses, respectively. For each category, we report both paired and unpaired evaluation results, including our proposed VTON-IQA score and standard image quality metrics (FID [fid], KID [kid], SSIM [ssim], and LPIPS [lpips]).
| paired | unpaired | |||||||
| Method | Ours | FID | KID | SSIM | LPIPS | Ours | FID | KID |
| Proprietary image edit model | ||||||||
| Nano Banana Pro [nanobanana] | 0.392 | 4.992 | 0.447 | 0.923 | 0.044 | 0.406 | 12.127 | 1.341 |
| GPT-Image-1.5 [gptimage] | 0.334 | 10.105 | 1.012 | 0.837 | 0.163 | 0.323 | 13.337 | 1.403 |
| DiT-based diffusion | ||||||||
| Qwen-Image-Edit [qwenedit] | 0.055 | 10.101 | 4.355 | 0.940 | 0.052 | 0.150 | 14.782 | 4.525 |
| CatVTON-FLUX [catvton] | 0.099 | 8.258 | 0.474 | 0.914 | 0.103 | -0.005 | 11.863 | 0.855 |
| FitDit [fitdit] | 0.346 | 8.275 | 0.699 | 0.924 | 0.062 | 0.328 | 11.754 | 0.750 |
| Any2AnyTryon [any2any] | 0.131 | 9.001 | 1.646 | 0.892 | 0.142 | -0.026 | 13.007 | 2.112 |
| U-Net-based diffusion | ||||||||
| LADI-VTON [ladi] | -0.543 | 12.958 | 4.036 | 0.909 | 0.137 | -0.674 | 16.522 | 5.478 |
| CAT-DM [catdm] | -0.082 | 10.416 | 2.389 | 0.909 | 0.119 | -0.335 | 14.181 | 3.275 |
| OOTDiffusion [oot] | -0.064 | 8.684 | 0.660 | 0.908 | 0.066 | -0.232 | 13.504 | 1.834 |
| IDM-VTON [idm] | 0.137 | 7.505 | 1.055 | 0.928 | 0.047 | -0.082 | 11.512 | 1.291 |
| CatVTON [catvton] | 0.057 | 9.938 | 1.764 | 0.905 | 0.084 | -0.021 | 12.914 | 1.800 |
| GAN-based | ||||||||
| VITON-HD [vitonhd] | -0.933 | 94.605 | 90.826 | 0.854 | 0.224 | -0.933 | 96.261 | 94.204 |
| HR-VITON [hrviton] | -0.835 | 20.873 | 8.767 | 0.917 | 0.109 | -0.841 | 22.626 | 9.337 |
| SD-VITON [sdviton] | -0.868 | 17.494 | 5.736 | 0.911 | 0.107 | -0.874 | 19.575 | 6.798 |
| paired | unpaired | |||||||
| Method | Ours | FID | KID | SSIM | LPIPS | Ours | FID | KID |
| Proprietary image edit model | ||||||||
| Nano Banana Pro [nanobanana] | 0.279 | 4.554 | 0.341 | 0.904 | 0.050 | 0.215 | 13.201 | 1.680 |
| GPT-Image-1.5 [gptimage] | 0.214 | 10.520 | 1.145 | 0.810 | 0.188 | 0.181 | 13.913 | 1.225 |
| DiT-based diffusion | ||||||||
| Qwen-Image-Edit [qwenedit] | -0.315 | 19.233 | 11.014 | 0.913 | 0.088 | -0.222 | 15.682 | 5.082 |
| CatVTON-FLUX [catvton] | 0.012 | 7.861 | 0.418 | 0.896 | 0.121 | -0.166 | 12.338 | 0.802 |
| FitDit [fitdit] | 0.181 | 8.180 | 0.877 | 0.909 | 0.077 | 0.108 | 12.764 | 1.104 |
| Any2AnyTryon [any2any] | -0.110 | 9.439 | 1.571 | 0.914 | 0.142 | -0.317 | 13.815 | 2.303 |
| U-Net-based diffusion | ||||||||
| LADI-VTON [ladi] | -0.420 | 9.540 | 1.987 | 0.907 | 0.140 | -0.697 | 13.966 | 3.480 |
| CAT-DM [catdm] | -0.158 | 10.951 | 2.116 | 0.879 | 0.150 | -0.361 | 15.932 | 3.777 |
| OOTDiffusion [oot] | -0.247 | 8.572 | 0.784 | 0.901 | 0.066 | -0.608 | 15.718 | 3.443 |
| IDM-VTON [idm] | -0.010 | 7.256 | 1.495 | 0.923 | 0.045 | -0.481 | 11.773 | 2.329 |
| CatVTON [catvton] | -0.170 | 12.833 | 3.381 | 0.887 | 0.104 | -0.335 | 17.435 | 4.323 |
| paired | unpaired | |||||||
| Method | Ours | FID | KID | SSIM | LPIPS | Ours | FID | KID |
| Proprietary image edit model | ||||||||
| Nano Banana Pro [nanobanana] | 0.243 | 3.147 | 0.412 | 0.924 | 0.040 | 0.265 | 10.504 | 1.281 |
| GPT-Image-1.5 [gptimage] | 0.164 | 8.180 | 0.805 | 0.825 | 0.158 | 0.108 | 11.325 | 1.381 |
| DiT-based diffusion | ||||||||
| Qwen-Image-Edit [qwenedit] | -0.022 | 7.439 | 3.497 | 0.933 | 0.057 | -0.171 | 13.062 | 3.720 |
| CatVTON-FLUX [catvton] | -0.068 | 8.019 | 0.453 | 0.861 | 0.142 | -0.225 | 11.524 | 1.499 |
| FitDit [fitdit] | 0.130 | 7.886 | 0.926 | 0.864 | 0.111 | 0.023 | 10.767 | 1.211 |
| Any2AnyTryon [any2any] | -0.157 | 8.644 | 1.443 | 0.879 | 0.141 | -0.366 | 13.190 | 2.788 |
| U-Net-based diffusion | ||||||||
| LADI-VTON [ladi] | -0.724 | 15.434 | 5.023 | 0.863 | 0.174 | -0.851 | 20.363 | 8.295 |
| CAT-DM [catdm] | -0.404 | 11.896 | 2.888 | 0.855 | 0.159 | -0.680 | 16.585 | 5.417 |
| OOTDiffusion [oot] | -0.379 | 12.306 | 2.516 | 0.856 | 0.108 | -0.693 | 19.963 | 6.146 |
| IDM-VTON [idm] | -0.026 | 7.278 | 0.619 | 0.882 | 0.083 | -0.480 | 11.303 | 1.220 |
| CatVTON [catvton] | -0.130 | 10.394 | 2.169 | 0.887 | 0.104 | -0.339 | 13.091 | 2.810 |
0.B.5 Qualitative Results
We present further visualizations of VTON-IQA quality assessment results in Fig. 15, Fig. 16, and Fig. 17.


Appendix 0.C Limitations & Future Work
VTON-IQA is capable of assessing the quality of individual virtual try-on images even in the absence of ground-truth references. This property makes it particularly suitable for real-world applications where such references are unavailable.
However, several limitations remain. First, our current study focuses on standard studio-based scenarios with controlled garment–person pairs. Extending the proposed framework to more diverse and realistic conditions, such as in-the-wild images with complex backgrounds and poses, person-to-person transfer, and instruction-guided styling, offers an exciting direction for future research. Second, our framework emphasizes scalar quality score prediction for quantitative evaluation. While effective for benchmarking, it does not yet provide detailed and interpretable feedback about specific visual discrepancies, such as sleeve length, silhouette, or fine-grained design elements. Incorporating attribute-level reasoning or language-based explanations into the evaluation process could enhance interpretability and practical usability, representing a promising avenue for future work. Third, our framework is currently designed for image-based virtual try-on and does not explicitly address video-based or 3D settings. Extending the evaluation paradigm to these emerging scenarios would require modeling temporal consistency and geometric plausibility. Adapting the framework to capture such factors could further advance human-aligned evaluation of next-generation virtual try-on systems. Despite these limitations, our method provides a principled and empirically validated foundation for human-aligned evaluation of virtual try-on systems and can serve as a basis for these future extensions.