Quantifying Membership Disclosure Risk
for Tabular Synthetic Data Using Kernel Density Estimators
Abstract
The use of synthetic data has become increasingly popular as a privacy-preserving alternative to sharing real datasets, especially in sensitive domains such as healthcare, finance, and demography. However, the privacy assurances of synthetic data are not absolute, and remain susceptible to membership inference attacks (MIAs), where adversaries aim to determine whether a specific individual was present in the dataset used to train the generator. In this work, we propose a practical and effective method to quantify membership disclosure risk in tabular synthetic datasets using kernel density estimators (KDEs). Our KDE-based approach models the distribution of nearest-neighbour distances between synthetic data and the training records, allowing probabilistic inference of membership and enabling robust evaluation via ROC curves. We propose two attack models: a ‘True Distribution Attack’, which assumes privileged access to training data, and a more realistic, implementable ‘Realistic Attack’ that uses auxiliary data without true membership labels. Empirical evaluations across four real-world datasets and six synthetic data generators demonstrate that our method consistently achieves higher F1 scores and sharper risk characterization than a prior baseline approach, without requiring computationally expensive shadow models. The proposed method provides a practical framework and metric for quantifying membership disclosure risk in synthetic data, which enables data custodians to conduct a post-generation risk assessment prior to releasing their synthetic datasets for downstream use. The datasets and codes for this study are available at https://github.com/PyCoder913/MIA-KDE.
1 Introduction
Imagine sharing rich and sensitive healthcare, financial, or demographic data without risking individual privacy - synthetic data generation makes this possible. By training statistical or Machine Learning models on real data to simulate datasets, synthetic data aims to retain analytical utility while protecting individual identities. However, despite growing adoption, synthetic datasets remain susceptible to membership inference attacks (MIAs) [2], where adversaries infer whether specific individuals were present in the original training data. This is particularly concerning when the inclusion of an individual in the dataset reveals sensitive information (e.g., HIV status, rare diseases, financial default).
State-of-the-art MIAs typically employ computationally expensive shadow modelling strategies [16, 17, 6], training multiple shadow generators to simulate attack scenarios and meta-classifiers for membership prediction. A more practical alternative uses distance-based methods that calculate F1 scores via data partitioning [4, 11, 3], but these produce hard membership labels rather than probabilistic predictions.
In this work, we introduce a non-parametric, distance-based framework using Kernel Density Estimators (KDEs) to model empirical distance distributions between synthetic and training data. Extending the methodology used in [4, 11, 3], our approach generates probabilistic membership predictions, enabling improved analysis through ROC curves at low false positive rates while remaining computationally efficient. Our contributions are threefold: (1) a KDE-based privacy scoring framework for tabular synthetic data, (2) comprehensive validation across diverse datasets and generation models, and (3) demonstration of superior F1 scores compared to the existing data-partitioning method without requiring expensive shadow model training.
2 Background and Related Work
2.1 Synthetic Data Generation
Synthetic data is generated by first training a statistical or machine learning model on the original dataset, and then producing artificial (synthetic) records by sampling new values from the learned model. Contemporary literature highlights diverse methodologies for synthetic data generation. Bayesian networks (e.g., BayNet, PrivBayes [26]) model attribute dependencies via directed acyclic graphs and conditionals. Generative Adversarial Networks (GAN)-based approaches like CTGAN (Conditional Tabular GAN) [22] use adversarial training to capture complex data distributions, though they face challenges in tabular data synthesis. Generative models such as Variational Autoencoders (VAEs) [20, 10] and diffusion models [9] have gained significant attention in synthetic data generation. Recently, Large Language Models (LLMs) have demonstrated promising results in synthesizing tabular data, capturing patterns and distributions inherent in real-world datasets.
2.2 Membership Inference Attacks
Membership inference attacks (MIAs) have emerged as a standard approach for assessing the privacy risks associated with synthetic data and Machine Learning models. For synthetic tabular data, one class of MIAs involves direct comparisons between synthetic and original records to identify exact or near matches [23]. However, these similarity-based approaches have been criticized for underestimating privacy risks [17]. The state-of-the-art alternatives are shadow modelling approaches [16, 17, 6], which are practically infeasible for large datasets due to their heavy computational overhead. For instance, consider a data custodian who routinely generates and sells synthetic datasets derived from proprietary, high-dimensional, and dynamic data containing billions of records, refreshed weekly. To assess privacy risk before each release, employing shadow modelling would require training numerous additional generative models - an approach that is both time and resource-intensive. Given the dynamic nature of the data, any delay in release diminishes its utility and commercial value to potential users.
Breugel et al. present DOMIAS [19], a membership inference attack against generative models, which estimates synthetic data and reference data distributions using methods like BNAF and KDE. It can be used as a loss during the training of the generative model, as well as a post-training metric to evaluate the synthetic data MI risk. A more popular approach implemented in practice to evaluate membership disclosure risks of synthetic data is a distance-based approach [11, 4, 3, 2], which we elaborate in Section 3.1. Our proposed method is grounded on the distance-based method, where we model the distance distributions using KDEs.
2.3 Kernel Density Estimation
Kernel Density Estimation (KDE), also known as the Parzen’s window [14], is a fundamental nonparametric technique used to estimate the probability density function (pdf) of a random variable based on a finite data sample. Unlike parametric models, KDE does not assume a specific functional form for the underlying distribution, making it especially useful for exploring complex, multimodal, or unknown distributions. Given a sample drawn independently from an unknown distribution with density , the kernel density estimator at a point is defined as,
where is a smooth, symmetric kernel function (e.g., Gaussian or Epanechnikov), and is the bandwidth (smoothing parameter) controlling the scale of smoothing.
3 Methodology
3.1 Motivation
This section discusses the practical approach for quantifying membership disclosure risk from El Emam et al. [4] and establishes our proposed framework.
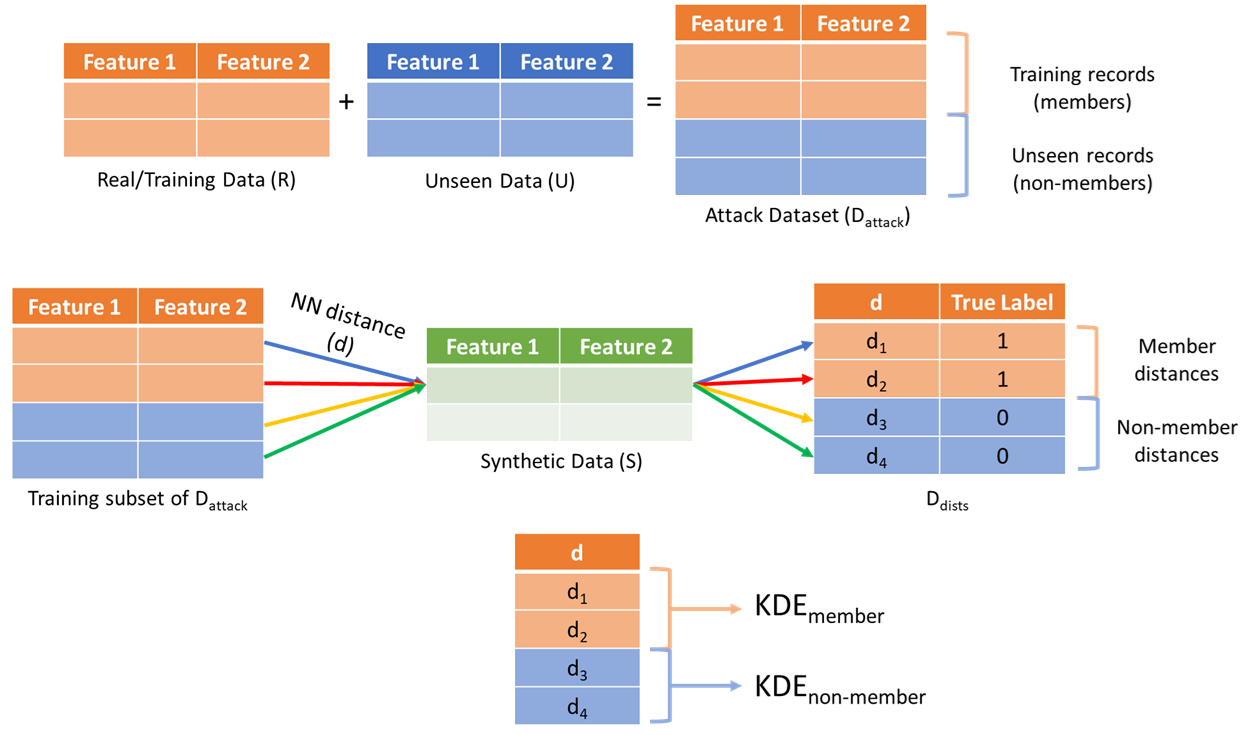
Membership inference attacks simulate a classification task where adversaries classify records as training set members or non-members. Given real dataset (training set) generating synthetic data , and unseen data (not used in training), we form an attack dataset comprising records from and . The standard approach in [11, 4, 3, 2] (which we hereafter refer to as Method 1) sets a distance threshold , computes nearest-neighbour distances between records and synthetic data , and classifies records below the threshold as members, and others as non-members. Finally, the F1 score for this classification quantifies the membership disclosure risk.
However, Carlini et al. [1] argue that average-case metrics like F1 scores underestimate privacy risks by masking worst-case leakage scenarios. They recommend ROC analysis evaluating true positive rates (TPRs) at low false positive rates (FPRs). Method 1 produces only hard classifications, not probabilistic membership scores needed for comprehensive ROC analysis. In many settings, it might be beneficial to have a probability associated with the class label. Membership probabilities provide a sense of confidence, the degree of uncertainty, or the likelihood of being incorrect in classifying records as members.
We propose a KDE-based approach that retains Method 1’s structure and generates probabilistic membership predictions. Our method models the relationship between nearest-neighbour distances and membership probability using real training data, synthetic data, and unseen holdout data. We present two variants: the True Distribution Attack (leveraging data holders’ privileged access to training data for risk assessment) and the Realistic Attack (using auxiliary datasets accessible to adversaries, which is also a requirement in some prior works [4, 16]). The interpretation of membership inference risk is two-fold: low risk may indicate genuine privacy protection, or reflect weak attack models that underestimate actual leakage. While our approach may not match shadow model accuracies [6], it offers significant practical advantages in terms of computation time.
3.2 True Distribution Attack
Let denote the real training dataset, the synthetic dataset, and unseen records not used during training. We construct the attack dataset by combining and , with ground truth labels: records as members (class = 1) and records as non-members (class = 0). We randomly split into balanced training and test sets - each set has an equal number of members and non-members , ensuring 50% baseline accuracy and 0.67 baseline F1 score (random guess111In a random guess attack, an adversary can achieve a baseline accuracy of 50% by randomly guessing whether a record is a member or non-member, from a set of records having an equal number of members and non-members.).
We compute Gower’s distance222Absolute difference (Manhattan distance) for numerical features; 0 for matching categories, 1 otherwise. [5] between each record in and its nearest neighbour in , creating distance table with computed distances and corresponding membership labels. We fit separate KDEs to member distances () and non-member distances (), providing smooth approximations of empirical distance distributions for each class.
For evaluation, we classify test records by computing their nearest-neighbour distance to the synthetic dataset and estimating membership probability using:
| (1) |
This estimator, formally justified by Bayes’ Theorem (Proposition 3.1), models membership likelihood without fixed distance thresholds. This probability can be thresholded (e.g., ) to classify whether the test record is a member. The probabilistic output enables both classification metrics (accuracy, F1) and comprehensive ROC analysis. Figure 1 illustrates this process.
Proposition 3.1.
Following the above setup, assume that and approximates the distributions of member distances and non-member distances respectively. Then for a given query record and the distance of its nearest neighbour in the synthetic data, the probability that it is a member of the training set is given by
Proof.
Assume that the prior probabilities of the query record being a member and non-member are equal, i.e., . From Bayes’ Theorem, we have
| (2) |
By the Theorem of Total Probability, it follows that the probability of observing the distance is given by:
Putting this in the denominator of equation 2, we get that
Since, and approximate the probabilities and respectively. ∎
When member and non-member distance distributions are statistically indistinguishable, the true distribution attack yields poor performance below baseline levels. For example, TVAE-generated UK Census data shows statistically indistinguishable distances (KS test -value = 0.71), resulting in accuracy (49.97%) and F1 score (0.375) below baselines. While this suggests low average MIA risk which might be a good news for the data custodian, ROC analysis (Figure 12) reveals high TPRs at low FPRs, indicating successful attacks in worst-case scenarios (discussed in Section 5.2).
3.3 Realistic Attack
In practical scenarios, adversaries will not have access to the true membership labels, making direct modelling of member and non-member distance distributions impossible. We propose the Realistic Attack, where adversaries access only auxiliary datasets from the same population, potentially containing mixed training and non-training records acquired through public sources. The requirement of such an auxiliary dataset does not undermine the validity of our approach, because our objective is providing data custodians practical risk assessment methods, and not creating new, potentially stronger, MIAs per se.
We simulate this using (mixture of and ) as auxiliary data. Without true labels, adversaries partition records into ‘supposed members’ (with distance below threshold) and ‘supposed non-members’ (above threshold), based solely on nearest-neighbour distances to synthetic data. Unlike Method 1, these labels are not used directly for classification. Instead, we fit separate KDEs to the supposed member and supposed non-member distances, and evaluate using Equation 1, enabling probabilistic assessment under realistic assumptions (Figure 2).
This yields monotonically decreasing membership probabilities as functions of distances. Label noise occurs as supposed member distances may include true non-members and vice versa, introducing modelling inaccuracies. However, our experiments show realistic attack risk can exceed true distribution attack risk for certain thresholds and datasets (Figure 3, Section 5.1). At higher thresholds (above 50th percentile), our realistic attack significantly outperforms Method 1 in F1 scores.

4 Results
We use four publicly available datasets to demonstrate our method: The MIMIC-IV data [7, 8], UK Census data [13], Texas-100X data [18], and Nexoid COVID-19 data [12]. For all datasets, we partition the data into two equal parts to construct the attack dataset: one half () is used to train the generative models and generate , while the remaining half (), unseen during training, is used as the unseen (non-members) set. We use six different generation techniques: CTGAN [22], ADS-GAN [24], DPGAN [21], TabDDPM [9], TVAE [22], and Bayesian Network [25], which are trained on and implemented using the SynthCity framework [15].
We evaluate both attack variants across these 24 datasets using Gower’s distance between and , measuring MIA risk via attack accuracy, F1 score, and log-scaled ROC curves. First, we form by computing the distances between records in and . We randomly split into 70% training (KDE fitting) and 30% testing (balanced members and non-members), using membership probability threshold for classification and Scott’s rule for KDE bandwidths. The specific choice of bandwidth matters in practice, but the analysis and results hold for any choice. For true distribution attack, we use equal numbers of members and non-members in the training subset. Table I shows training and test set sizes across datasets.
MIMIC-IV UK Census Texas-100X Nexoid # Training distances 112,000 398,818 647,588 420,000 # Test distances 48,000 170,923 277,540 180,000
Tables II and III report the accuracies and F1 scores, respectively, for the true distribution attack across the various datasets and generative models. In majority of the cases, the synthetic datasets generated using Bayesian Network are observed to be comparatively more vulnerable to membership inference attacks, consistently exhibiting higher accuracy and F1 scores. Following Carlini et al. [1], we also analyze ROC curves to assess worst-case privacy leakage (see Section 5.2).
CTGAN ADS-GAN DPGAN TabDDPM TVAE Bayesian Network MIMIC-IV 75.617% 73.708% 59.433% 79.508% 88.952% 68.298% UK Census 50.075% 49.918% 57.933% 50.055% 49.975% 62.889% Texas-100X 83.957% 71.184% 71.023% 50.49% 78.341% 97.503% Nexoid 50.827% 50.353% 50.057% 51.6% 53.768% 58.493%
CTGAN ADS-GAN DPGAN TabDDPM TVAE Bayesian Network MIMIC-IV 0.793 0.791 0.612 0.827 0.877 0.759 UK Census 0.333 0.402 0.274 0.633 0.375 0.631 Texas-100X 0.825 0.760 0.716 0.454 0.781 0.975 Nexoid 0.516 0.079 0.042 0.579 0.540 0.619
For the realistic attack, we conduct our experiments using nine distinct distance thresholds, corresponding to the percentiles of the nearest neighbour distances. For each threshold, the distances are partitioned as ‘supposed member’ and ‘supposed non-member’ distances, and separate KDEs are fitted to model the their distributions. We report the resulting accuracy and F1 score achieved by the realistic attack for each threshold, and compare these with the corresponding scores obtained using Method 1 through heatmaps. We present the MIA risks (F1 scores) for all three attacks (true distribution attack, realistic, and method 1) across all four datasets and all generators in Figure 3. Sections 4.1-4.3 present the results for the four datasets with the help of a series of illustrative plots. The fitted KDEs for the training distances of supposed members and supposed non-members of the realistic attack for the datasets are not included in the text for brevity. However, they are available in the Experiments notebooks in the GitHub repository for this project.

4.1 MIMIC-IV (EHR) Data
4.1.1 True Distribution Attack
Figure 4 presents accuracy and F1 scores for synthetic MIMIC-IV datasets. KS tests (-values = 0) confirm statistically distinguishable member and non-member distance distributions for all MIMIC-IV datasets. TVAE-generated data shows the highest vulnerability with accuracy and F1 score.

Figure 5 shows member/non-member distance distributions, with fitted KDEs used to compute test record membership probabilities. Figure 6 displays distance versus membership probability relationships. Figure 7 presents log-scaled ROC curves for true distribution attacks on EHR synthetic datasets, demonstrating our method’s capability for comprehensive ROC analysis through probabilistic predictions.


4.1.2 Realistic Attack
Figure 8 presents the realistic attack results - the accuracies and F1 scores across nine different distance thresholds. The realistic attack yields low F1 scores at lower thresholds, indicating limited separability between member and non-member records in these regions. However, at higher thresholds, the F1 scores increase and approach the baseline value of 0.67 (for more discussion, see Section 5.1), and consistently outperform those achieved by Method 1 under the same conditions. The accuracy and F1 scores of both the realistic attack and Method 1 remain below their respective baselines, suggesting that the realistic attack is weaker in this case.

4.2 UK Census Data
The UK Census dataset contains only categorical features, resulting in 7-14 discrete distance values and sparsity in the membership probability plot (as fewer unique probabilities are computed; see Figure 11). KS tests show indistinguishable member and non-member distances for CTGAN, ADS-GAN, TabDDPM, and TVAE, with true distribution attack accuracies near the 50% baseline, indicating reduced MIA susceptibility from a data holder perspective.


4.3 Texas-100X and Nexoid Data
For conciseness, we present only the ROC curves for the true distribution attack on Texas-100X and Nexoid datasets, as showing the corresponding KDE distributions and membership probability plots would be redundant. We also omit the realistic attack heatmap for Nexoid data for brevity. They are, however, available in our GitHub repository.


5 Discussion
5.1 Distance Threshold vs. F1 Score for Realistic Attack
Intuitively, realistic attack risk should be lower than true distribution attack risk, as the latter uses true membership labels to model distance distributions. However, we observe that F1 scores from realistic attack can exceed F1 scores of true distribution attack, at specific distance thresholds (Figure 3). For UK Census data, this occurs across all synthetic datasets due to statistical indistinguishability between member and non-member distance distributions, causing true distribution attacks to perform near baseline levels. The realistic attack achieves strong performance on Texas-100X (F1 scores up to 0.98 for Bayesian Network at 50th-60th percentiles) and shows generally increasing F1 scores with higher thresholds for Nexoid data.
This trend reflects the relationship between TPs and FPs as distance thresholds increase. Higher thresholds classify more records as members, simultaneously increasing both TPs and FPs. When TP growth outpaces FP growth, F1 scores improve, which is observed for UK Census, Texas-100X, and Nexoid datasets (Figure 17). Texas-100X exhibits the most pronounced TP-to-FP ratio increase, explaining its high realistic attack F1 scores. MIMIC-IV presents an exception: FPs initially grow faster than TPs, resulting in lower F1 scores that approach the 0.67 baseline at higher thresholds slowly, which is favorable for data custodians. Attack effectiveness depends critically on dataset properties and the privacy characteristics of specific synthetic data generation methods.

5.2 ROC Analysis
Our approach enables seamless ROC analysis, revealing critical limitations of average-case metrics like accuracy and AUC in evaluating membership inference attacks [1]. For example, TVAE-generated UK Census data achieves only 49.97% accuracy (below baseline), while DPGAN achieves 57.93% (8 percentage points above baseline), suggesting limited risk. However, log-ROC analysis (Figure 12) reveals TPRs of 0.1-1.0 at FPR=, indicating TPR up to times greater than FPR - a substantial vulnerability masked by benign average metrics. Similarly, TVAE-generated Nexoid data shows marginally above-baseline performance (AUC=0.554, accuracy=53.77%), yet achieves TPR=- at FPR= (Figure 16), representing TPR over 100 times higher than FPR. From a privacy perspective, TPRs at low FPRs should not exceed times the FPR (adjustable based on use-case requirements), and metric selection should align with application-specific risk tolerance and privacy requirements.
6 Conclusion
We proposed a computationally efficient KDE-based framework for calculating membership disclosure risk in tabular synthetic datasets, by modelling nearest-neighbour distance distributions. Our method enables probabilistic membership inference without expensive shadow modelling, with further acceleration through distance calculations and KDE estimation on GPUs. The proposed method primarily functions as a post-generation metric, allowing data custodians to assess risk after synthesis using only the training data, synthetic dataset, and reference data from the same population (a subset of the real data not used in training).
The experiments conducted in this study used balanced attack datasets with equal member/non-member records. However, El Emam et al. [4] suggest setting member proportions to (training size/population size) for realistic deployment scenarios. Our implementation supports flexible partitioning and train-test-split parameters. Future work could explore: (1) relaxing balanced dataset assumptions to improve practical applicability, (2) investigating theoretical guarantees on distance-to-membership probability mappings, and (3) developing hybrid strategies combining KDE-based post-hoc assessment with lightweight shadow modelling or adversarial training for more robust membership disclosure risk evaluation.
References
- [1] (2022) Membership inference attacks from first principles. In 2022 IEEE Symposium on Security and Privacy (SP), pp. 1897–1914. Cited by: §3.1, §4, §5.2.
- [2] (2020) Gan-leaks: a taxonomy of membership inference attacks against generative models. In Proceedings of the 2020 ACM SIGSAC conference on computer and communications security, pp. 343–362. Cited by: §1, §2.2, §3.1.
- [3] (2017) Generating multi-label discrete patient records using generative adversarial networks. In Machine learning for healthcare conference, pp. 286–305. Cited by: §1, §1, §2.2, §3.1.
- [4] (2022) Validating a membership disclosure metric for synthetic health data. JAMIA open 5 (4), pp. ooac083. Cited by: §1, §1, §2.2, §3.1, §3.1, §3.1, §6.
- [5] (1971-04) A general coefficient of similarity and some of its properties. Biometrics 27 (4), pp. 857–871. Cited by: §3.2.
- [6] (2023) Synthetic is all you need: removing the auxiliary data assumption for membership inference attacks against synthetic data. In European Symposium on Research in Computer Security, pp. 182–198. Cited by: §1, §2.2, §3.1.
- [7] (2020) Mimic-iv. PhysioNet. Available online at: https://physionet. org/content/mimiciv/1.0/(accessed August 23, 2021), pp. 49–55. Cited by: §4.
- [8] (2023) MIMIC-iv, a freely accessible electronic health record dataset. Scientific data 10 (1), pp. 1. Cited by: §4.
- [9] (2023) Tabddpm: modelling tabular data with diffusion models. In International Conference on Machine Learning, pp. 17564–17579. Cited by: §2.1, §4.
- [10] (2020) Vaem: a deep generative model for heterogeneous mixed type data. Advances in Neural Information Processing Systems 33, pp. 11237–11247. Cited by: §2.1.
- [11] (2021) Fidelity and privacy of synthetic medical data. arXiv preprint arXiv:2101.08658. Cited by: §1, §1, §2.2, §3.1.
- [12] (2020) Nexoid covid-19 dataset. Note: Accessed: 2025-06-06 External Links: Link Cited by: §4.
- [13] (2011) Census microdata teaching files (2011). Note: https://www.ons.gov.uk/census/2011census/2011censusdata/censusmicrodata/microdatateachingfileAccessed: 2025-06-05 Cited by: §4.
- [14] (1962) On estimation of a probability density function and mode. The annals of mathematical statistics 33 (3), pp. 1065–1076. Cited by: §2.3.
- [15] (2023) Synthcity: facilitating innovative use cases of synthetic data in different data modalities. External Links: Document, Link Cited by: §4.
- [16] (2017) Membership inference attacks against machine learning models. In 2017 IEEE symposium on security and privacy (SP), pp. 3–18. Cited by: §1, §2.2, §3.1.
- [17] (2022) Synthetic data–anonymisation groundhog day. In 31st USENIX Security Symposium (USENIX Security 22), pp. 1451–1468. Cited by: §1, §2.2.
- [18] (2022) Texas hospital inpatient discharge public use data file, [quarters 1-4, 2006]. Texas Department of State Health Services, Austin, Texas. Note: [June 21, 2022]https://www.dshs.texas.gov/centers-health-statistics/health-care-data-collection/texas-inpatient-public-use-data-file-pudf Cited by: §4.
- [19] (2023) Membership inference attacks against synthetic data through overfitting detection. arXiv preprint arXiv:2302.12580. Cited by: §2.2.
- [20] (2020) Generating privacy-preserving synthetic tabular data using oblivious variational autoencoders. In Proceedings of the Workshop on Economics of Privacy and Data Labor at the 37 th International Conference on Machine Learning, Cited by: §2.1.
- [21] (2018) Differentially private generative adversarial network. arXiv preprint arXiv:1802.06739. Cited by: §4.
- [22] (2019) Modeling tabular data using conditional gan. Advances in neural information processing systems 32. Cited by: §2.1, §4.
- [23] (2019) Assessing privacy and quality of synthetic health data. In Proceedings of the Conference on Artificial Intelligence for Data Discovery and Reuse, pp. 1–4. Cited by: §2.2.
- [24] (2020) Anonymization through data synthesis using generative adversarial networks (ads-gan). IEEE journal of biomedical and health informatics 24 (8), pp. 2378–2388. Cited by: §4.
- [25] (2009) Using bayesian networks to create synthetic data. Journal of Official Statistics 25 (4), pp. 549–567. Cited by: §4.
- [26] (2017) Privbayes: private data release via bayesian networks. ACM Transactions on Database Systems (TODS) 42 (4), pp. 1–41. Cited by: §2.1.