Juhász et al.\corresÁ. Juhász,
Obscured Star Formation in the Dwarf Galaxy DDO 43? A Comparative UV–IR Analysis
Abstract
We present a study of recent star formation in the dwarf irregular galaxy DDO 43 using GALEX FUV and WISE NIR imaging. We identify regions of elevated FUV flux, indicating unobscured star-forming activity across much of the galaxy. To further characterize the stellar content, we compare the FUV fluxes to archival WISE W1 and W2 infrared data across 56 regions of interest. A general correlation is found between the FUV and infrared fluxes, suggesting spatially coherent star formation throughout the galaxy. A few regions, however, show elevated infrared fluxes but little or no UV emission, potentially indicating localized, dust-obscured star formation.
keywords:
galaxies: dwarf, galaxies: individual (DDO 43), stars: formation, ultraviolet: galaxies, infrared: galaxies1 Introduction
DDO 43 is a nearby, gas-rich dwarf irregular galaxy located in relative isolation, with no known companion galaxies in its immediate vicinity. Its low-mass nature, irregular morphology, and lack of recent interactions make it an ideal testbed for investigating the internal processes that govern star formation.
The star formation rate (SFR) in galaxies may be estimated in various ways (see reviews by R\BPBIC. Kennicutt Jr., \APACyear1998; R\BPBIC. Kennicutt \BBA Evans, \APACyear2012): based on the UV surface brightness (e.g. Salim \BOthers. \APACyear2007); on the far-infrared brightness (e.g. Héraudeau \BOthers. \APACyear2004); on the total infrared luminosity (e.g. Liu \BOthers. \APACyear2020); from the brightness of PAH lines (e.g. Kovács \BOthers. \APACyear2019); or using SED modelling (e.g. Suleiman \BOthers. \APACyear2022).
Recent analysis by Subramanian \BOthers. (\APACyear2024) reports a stellar mass of M⊙ and an H i mass of M⊙ for DDO 43, implying a gas fraction of 0.91. The far-ultraviolet luminosity corresponds to a star formation rate of M⊙ yr-1, and the authors identify 18 star-forming clumps with sizes ranging from 100 to 250 pc. These values are consistent with other gas-rich dwarf irregular galaxies showing distributed and clumpy star formation.
DDO 43 exhibits ongoing, spatially extended star formation activity (Simpson \BOthers., \APACyear2005). This makes it particularly valuable for studying how local physical conditions can sustain or regulate star formation.
Previous multiwavelength surveys, such as LITTLE THINGS (Hunter \BOthers., \APACyear2012) and LVL (Dale \BOthers., \APACyear2009), have shown that combining UV and IR observations provides a more complete picture of star formation activity, revealing both unobscured young stellar populations and embedded regions obscured by dust. These data are critical for identifying both the structural morphology and possible dust-obscured regions of star formation.
| ID | Source ID | W1 Catalog | W2 Catalog | W1 IRAF | W2 IRAF | W1 Diff. | W2 Diff. |
|---|---|---|---|---|---|---|---|
| A | 1127p408_b0-000918 | 12.619 | 12.713 | 12.937 | 12.940 | –0.318 | –0.227 |
| B | 1127p408_b0-002631 | 14.004 | 14.156 | 14.280 | 14.661 | –0.276 | –0.505 |
| C | 1127p408_b0-004038 | 14.593 | 14.690 | 14.790 | 15.066 | –0.197 | –0.376 |
| D | 1127p408_b0-005810 | 15.102 | 14.949 | 15.386 | 16.217 | –0.284 | –1.268 |
| ID | W1 (DN) | W2 (DN) | W1 (cat, DN) | W2 (cat, DN) | BGW1 (DN) | BGW2 (DN) | ApW1 (pix) | ApW2 (pix) |
|---|---|---|---|---|---|---|---|---|
| A | 1524.409 | 1812.791 | 1420.365 | 518.561 | 0.867 | 8.492 | 119.944 | 152.407 |
| B | 745.497 | 1493.289 | 396.643 | 137.278 | 2.915 | 8.906 | 119.682 | 152.266 |
| C | 634.626 | 1490.135 | 230.569 | 83.946 | 3.375 | 9.207 | 119.720 | 152.726 |
| D | 549.390 | 1456.439 | 144.278 | 66.130 | 3.375 | 9.103 | 120.027 | 152.735 |
Motivated by these findings, we apply this combined approach to DDO 43 using archival far-ultraviolet (FUV) data from the Galaxy Evolution Explorer (GALEX; (Martin \BOthers., \APACyear2005)) and infrared imaging from the Wide-field Infrared Survey Explorer (WISE; (Wright \BOthers., \APACyear2010)). Specifically, we analyze the W1 (3.4 m) and W2 (4.6 m) bands alongside FUV data to assess the galaxy’s star-forming morphology and the presence of potentially obscured regions. Our goal is to evaluate whether the UV and IR tracers yield a consistent picture of star formation in this system.
2 Data and Methods
2.1 Infrared Imaging and Background Treatment
The infrared data were obtained from the WISE W1 (3.4 m) and W2 (4.6 m) bands (Cutri \BOthers., \APACyear2021), which primarily trace the Rayleigh–Jeans (RJ) tail of the stellar continuum emitted by evolved, low-mass stars (Jarrett \BOthers., \APACyear2023). As such, both W1 and W2 are predominantly sensitive to the older stellar population, and their luminosities serve as proxies for stellar mass. The images have angular resolutions of 6.1" in W1 and 6.4" in W2 (Wright \BOthers., \APACyear2010), enabling moderately resolved surface brightness measurements in nearby dwarf galaxies.
W2 is also sensitive to additional emission components such as warm dust, and can therefore exhibit subtle excesses in dusty or star-forming environments (Simonian \BBA Martini, \APACyear2017).
While direct tracers of thermal dust emission are typically found in longer-wavelength bands such as W3 (12 m) and W4 (22 m) — which include prominent PAH features (Nikutta \BOthers., \APACyear2014) — DDO 43 remains undetected in these bands due to its low infrared surface brightness and strong background fluctuations. We therefore rely on W1 and W2 imaging, using the W1–W2 color as a proxy for identifying potential warm dust emission (Stern \BOthers., \APACyear2012).


The images were retrieved from the official WISE data release, where the pipeline-processed frames are already calibrated and corrected for instrumental artifacts. Pixel values are given in digital numbers (DN) per pixel, which can be converted into flux densities and subsequently Vega-system magnitudes using the standard conversion formulae provided in the WISE documentation (Cutri \BOthers., \APACyear2021).
The WISE images of DDO 43 are dominated by foreground stars (Lang, \APACyear2014) from the Milky Way and are known to suffer from background fluctuations. In the W2 band, after foreground star subtraction, the brightest pixel within the galaxy reaches a digital number (DN) value of 9.8, while the local background is 9.0. In W1, the central peak reaches 5.24 DN against a background level of 3.4. Expressed as simple contrasts, these correspond to 12% in W2 and 60% in W1 relative to the background level. However, the relevant metric for detection significance is the signal-to-noise ratio.
To estimate the background noise amplitude, we first removed contaminating foreground stars through PSF photometry, and then measured statistics in the cleaned edge strips of the images. This procedure yields DN pix-1 in both W1 and W2. In W1, the net signal above the background (1.83 DN) corresponds to 26, while in W2 the net signal (0.8 DN) corresponds to 11. These values confirm that the galaxy is robustly detected in both bands, even though the overall contrast relative to the background level is modest. Accurate background subtraction and noise characterization remain critical for any meaningful photometric analysis.
In addition, the W2 mosaic exhibits a weak, nearly vertical dark stripe running in the northeast–southwest direction, effectively slicing through the image and also crossing the galaxy. While the stripe is not strong enough to dominate the photometry, it represents an instrumental artifact that must be kept in mind in later sections.
Our goal was to measure the surface brightness in selected regions of the galaxy. The background is shaped by a combination of diffuse Galactic emission (Schlegel \BOthers., \APACyear1998), interplanetary dust scattering (Kelsall \BOthers., \APACyear1998), and instrumental effects. Unlike in the GALEX data, where the sky level could be directly adopted, here the presence of structured fluctuations and instrumental artifacts meant that a simple global background estimate would not have been reliable. Accurate modeling of all these components would be necessary to derive a scientifically defensible background level, but this exceeds the scope and capabilities of our dataset. Therefore, instead of attempting a detailed physical decomposition, we adopted a more practical solution.
To mitigate these challenges, we employed a targeted background correction strategy based on IRAF aperture photometry. Several foreground stars were selected and measured in both W1 and W2 bands (see Figure 1). By comparing their instrumental magnitudes to catalog values from the CatWISE2020 catalog (Marocco \BOthers., \APACyear2021), we estimated the effective background contribution within typical photometric apertures and applied a uniform correction accordingly (see Table 1 and Table 2, and Figure 1). This method allows us to recover approximate flux measurements under suboptimal conditions.
2.2 Ultraviolet Imaging
We analyzed archival FUV imaging of DDO 43 from the GALEX space telescope. The GALEX FUV channel provides a spatial resolution of 4.5" (Martin \BOthers., \APACyear2005), which is sharper than that of the WISE W1 and W2 bands. In our data, the sky background—measured via sigma-clipped statistics across the full frame—has a mean level of approximately counts s-1 pix-1, with a pixel-to-pixel rms noise of counts s-1 pix-1. The brightest clumps reach peak brightness levels of 0.02 counts s-1 pix-1, corresponding to a signal-to-noise ratio of 60–70. Even outside these brightest areas, the galaxy’s diffuse FUV emission typically exceeds the background by a factor of 10 to 50, allowing for robust photometric analysis throughout most of the disk.
The FUV background is exceptionally low and spatially uniform (Morrissey \BOthers., \APACyear2007), across the field, largely free from the structured contamination. In this wavelength regime, there are no significant contributions from interplanetary dust (Bianchi \BOthers., \APACyear2011), diffuse Galactic emission, or instrumental artifacts.
The GALEX data are pipeline-processed and calibrated, with pixel values given in counts per second per pixel (Morrissey \BOthers., \APACyear2007). These values can be converted into flux densities and AB magnitudes using the provided calibration constants. While we did not carry out a full photometric conversion for this study, we relied on the native count-rate values for relative surface brightness comparisons.
To accurately determine the sky background level, we applied a sigma-clipping technique to the entire image. Specifically, we performed a iterative clipping with a maximum of five iterations, producing robust estimates of mean, median, and standard deviation. This allowed us to statistically characterize the background level while minimizing the influence of outliers. Since the GALEX data are largely free from the structured artifacts and large-scale fluctuations that affect the WISE images, the resulting background value could be directly adopted for the surface brightness measurements of the galaxy.

In addition, isolated zero-valued pixels were present within the galaxy, likely due to detector artifacts or local sensitivity issues. To avoid artificially underestimating the surface brightness in these regions, we replaced the affected pixels with the mean of their immediate, non-zero neighbors. This correction preserved the overall morphology while allowing for a more reliable statistical analysis of the galaxy’s emission.
2.3 UV–IR Sampling Strategy
To compare ultraviolet and infrared emission on a consistent spatial basis, we defined 56 identical sampling regions across the galaxy. The sampling layout was guided by a H i analysis of DDO 43 (Pichler \BOthers., \APACyear2025). Each region is a arcsec box, corresponding to approximately 380 pc at the assumed distance of DDO 43. The boxes were arranged to cover the central part of the galaxy. The angular resolution of the data varies between bands: GALEX FUV provides 4.5" full width at half maximum (FWHM; (Martin \BOthers., \APACyear2005)), while WISE W1 and W2 have resolutions of 6.1" and 6.4", respectively (Wright \BOthers., \APACyear2010). All of these values are significantly smaller than the arcsec sampling boxes, ensuring that the resolution differences do not critically affect the interpretation of the flux measurements within each region.
Care was taken to exclude areas strongly contaminated by residual foreground stars or background artifacts, as identified in earlier processing steps. In particular, regions surrounding the bright subtracted stars used for background calibration (sources A and B; see Figure 1 and Table 1) often display PSF-related residual structures that could distort local flux measurements. The final grid was therefore restricted to the main body of the galaxy, deliberately avoiding these visually compromised peripheral zones.
For each valid region, we measured the background-corrected FUV, W1, and W2 fluxes, and computed W1–W2 color indices in the Vega magnitude system. This spatially matched sampling provides a foundation for assessing the degree of correlation and disparity between ultraviolet and infrared emission, and for identifying regions of potentially obscured star formation. While some peripheral zones appear redder, even these regions remain under the AGN threshold (W1–W2 0.8; (Stern \BOthers., \APACyear2012)), and none of the redder zones are centrally located.
3 Results
3.1 Morphology
The FUV image reveals several bright clumps, particularly concentrated in the northern and eastern portions of the galaxy (see third panel of Figure 2). These regions are likely associated with recent, unobscured star formation, possibly representing OB associations or fragmented stellar complexes.
In comparison, the WISE W1 image displays a relatively regular, mildly elliptical shape with an orientation from the northwest to the southeast. This suggests a symmetric near-infrared stellar light distribution. The W2 image, by contrast, appears more irregular and less elliptical. It features several localized protrusions, and in the southeastern quadrant, a spur-like extension appears partially separated from the main body of the galaxy. These morphological differences between W1 and W2 (see Figure 3) highlight structural asymmetries that are not visible in the UV or W1 images.
3.2 General UV–IR Correlation
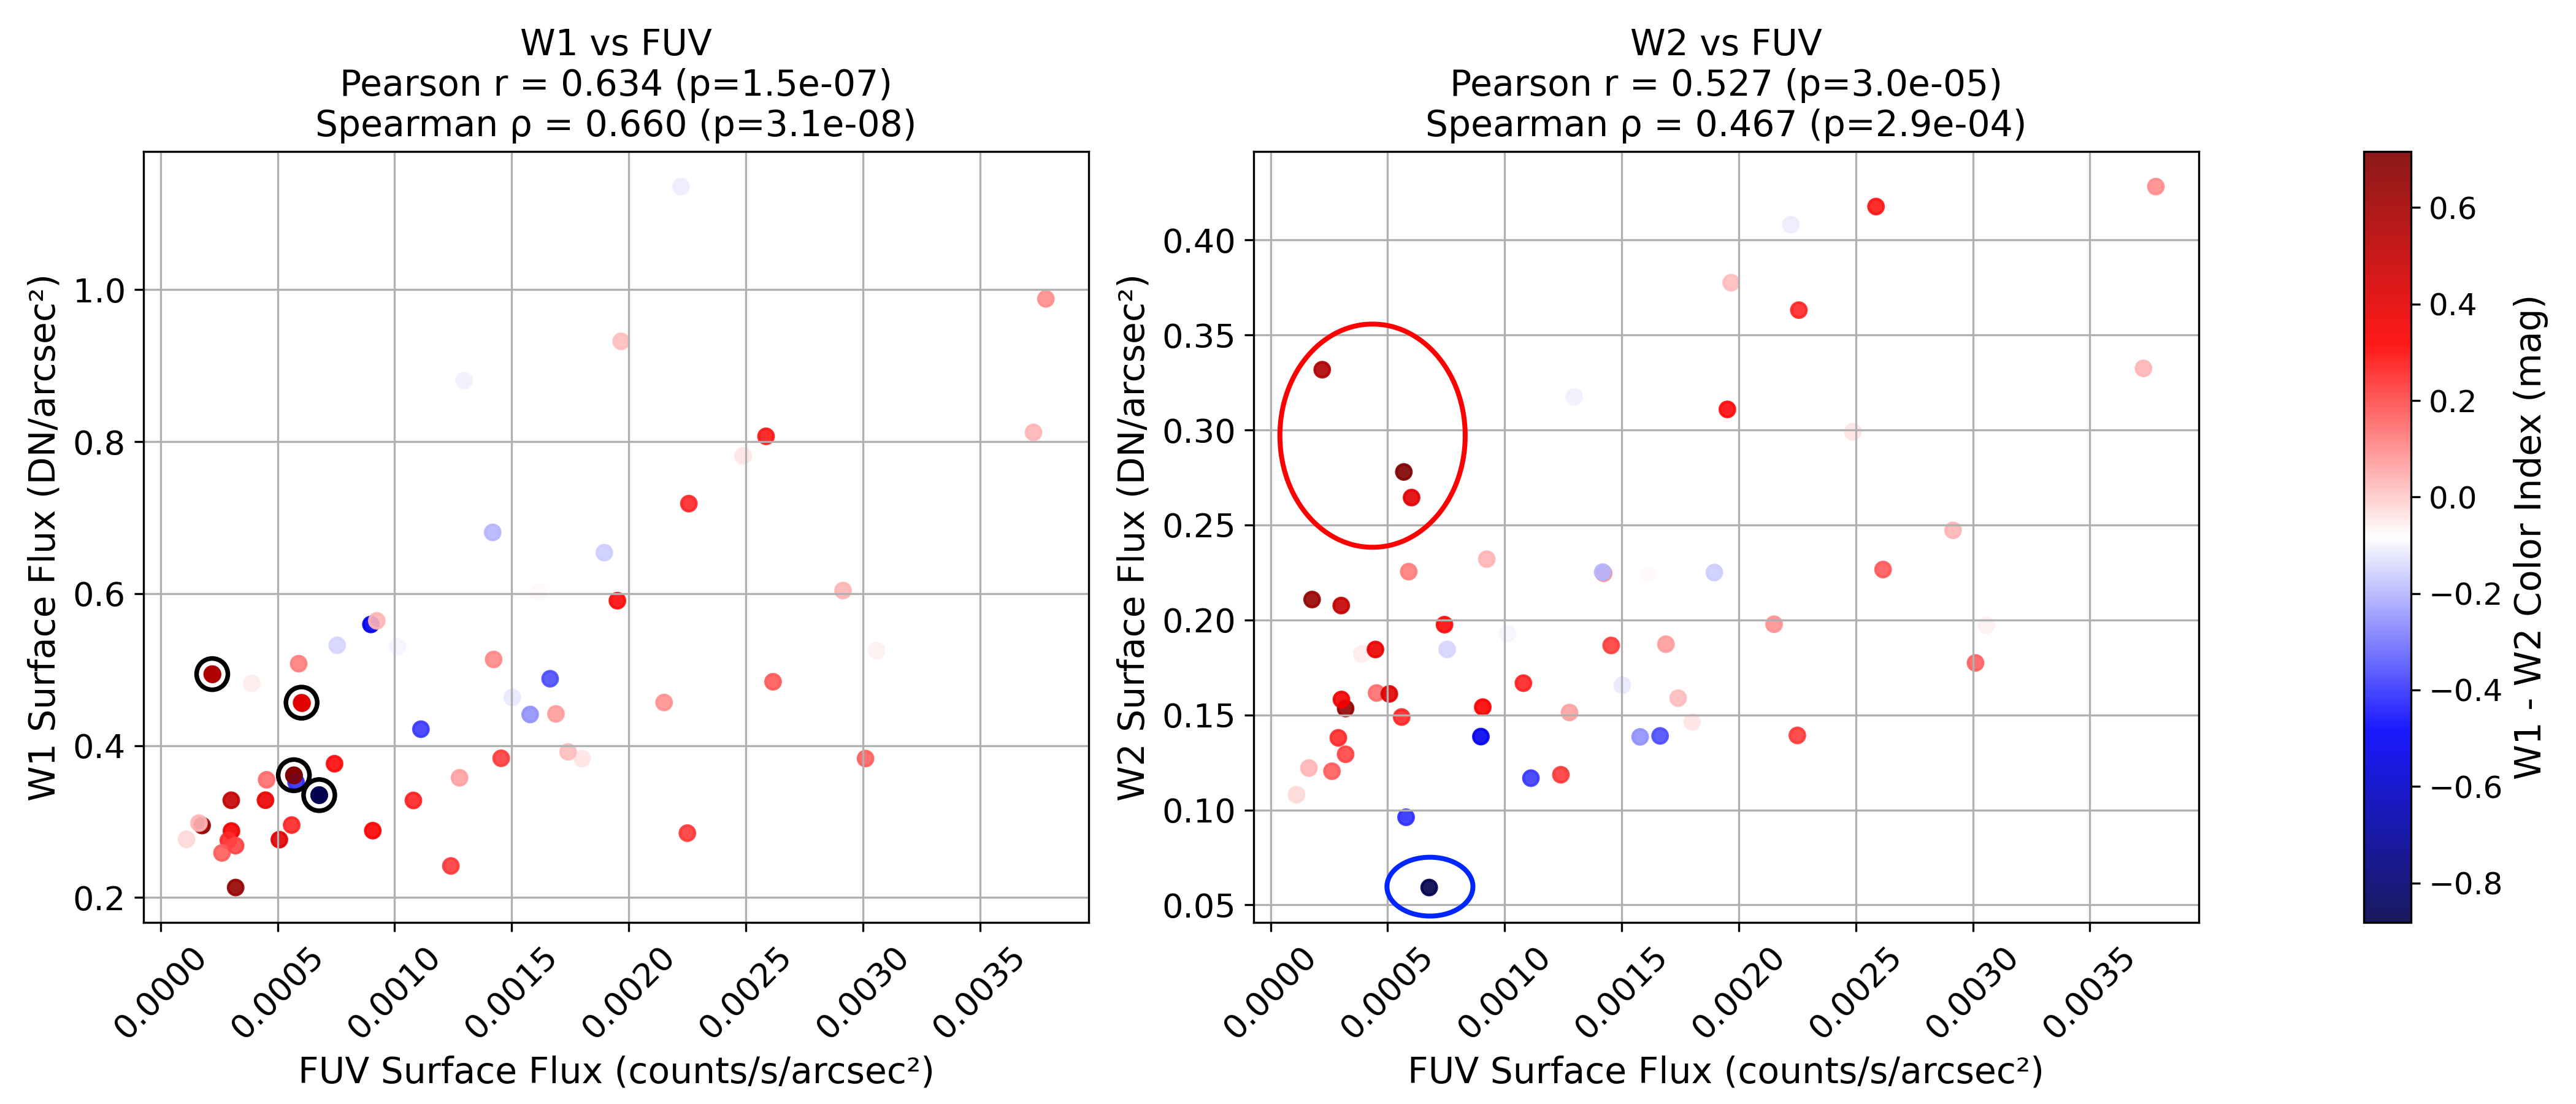
To explore the relationship between unobscured and dust-embedded star formation, we compared the measured fluxes in the GALEX FUV, WISE W1, and W2 bands across the 56 sampled regions (see Figure 4). As expected, a positive correlation is observed between the FUV and infrared fluxes in most areas of the galaxy. Regions that are bright in FUV tend to show elevated W1 and W2 emission as well, consistent with spatially coincident young stellar populations and their associated stellar mass and dust content.
| Region | W1 Flux | W1 (mag) | W2 Flux | W2 (mag) | W1–W2 | FUV Flux |
|---|---|---|---|---|---|---|
| (DN / arcsec2) | (Vega) | (DN / arcsec2) | (Vega) | (mag) | (counts s-1 arcsec-2) | |
| SE1 | 0.456 | 21.35 | 0.264 | 20.94 | 0.41 | 0.00060 |
| SE2 | 0.361 | 21.61 | 0.278 | 20.89 | 0.72 | 0.00057 |
| SE3 | 0.494 | 21.27 | 0.332 | 20.70 | 0.57 | 0.00022 |
| N1 | 0.335 | 21.69 | 0.059 | 22.57 | 0.00068 |
Quantitatively, the FUV–W1 correlation shows high significance, with Pearson’s and Spearman’s . The FUV–W2 correlation is somewhat weaker (, ), primarily due to a few outlier regions, discussed below.
3.3 Outlier Regions and Dust Obscuration
A subset of regions in the southeastern quadrant deviates markedly from the overall trend. These outliers exhibit strong W2 emission but minimal or no FUV signal. In these cases, the W1 flux is also relatively weak, suggesting that the emission is not simply due to old stellar populations. Rather, the elevated W2 values combined with suppressed ultraviolet flux point to localized star-forming regions that are heavily obscured by dust, rendering them invisible in the UV (see Figure 2 and Table 3).
Importantly, these W2-bright clumps are located just to the west of the weak vertical artifact noted in Sect. 2.1. Their fluxes are therefore not directly contaminated by the stripe itself. Nevertheless, the presence of the artifact means that the separation of these clumps from the central body of the galaxy (as shown in Fig. 3) might appear more pronounced than it really is. We therefore treat their interpretation with caution, while still regarding them as plausible candidates for dust-enshrouded star formation.
In contrast, we identified one additional outlier in the northern region with a notably blue W1–W2 color index, showing significant W1 flux but negligible W2 and FUV emission. This region likely reflects a passively evolving stellar population without active star formation or warm dust — effectively the opposite of the southeastern dusty clumps (see Figure 2 and Table 3).
Excluding these four outliers — three W2-bright and one W2-faint — the remaining 52 sampled regions exhibit broadly consistent behavior. FUV, W1, and W2 fluxes are moderately correlated throughout, reinforcing the overall picture of a galaxy dominated by spatially coherent star formation, with only localized departures due to dust obscuration or population gradients.
4 Discussion and Conclusions
Our analysis of ultraviolet and infrared imaging of DDO 43 reveals a predominantly consistent picture of spatially coherent star formation throughout the galaxy, punctuated by a small number of anomalous regions. The general correlation between FUV, W1, and W2 fluxes supports the view that most star formation in this system is unobscured and moderately active.
However, the presence of several W2-bright, UV-dark regions — particularly in the southeastern quadrant — points to a localized component of dust-enshrouded star formation. These areas display elevated W2 flux without a corresponding increase in UV emission, and their red W1–W2 color indices are inconsistent with passively evolving stellar populations. In contrast, one region with a blue W1–W2 index and no FUV emission likely reflects a passively evolving stellar population, devoid of both young stars and warm dust (e.g., Jarrett \BOthers., \APACyear2023). The coexistence of such varied environments within a single, relatively small dwarf galaxy underscores the complex internal structure of DDO 43.
In general, W1 traces the older stellar population, while W2 includes contributions from both evolved stars and warm dust emission, including very small grains (Simonian \BBA Martini, \APACyear2017). Typical W1–W2 colors for normal star-forming galaxies range between 0 and 0.5mag, with values exceeding 0.8mag generally associated with AGN activity (Stern \BOthers., \APACyear2012). In our sample, the reddest regions (e.g., SE2, SE3) exhibit W1–W2 values of 0.57–0.72mag (see Table3), placing them near the upper range expected for dust-rich star-forming clumps but still below the AGN threshold. This further supports their interpretation as localized regions with enhanced warm dust emission rather than non-stellar contamination.
Minor contributions from stellar population effects such as metallicity-dependent CO absorption may also affect the W1–W2 color (Norris \BOthers., \APACyear2014), although we do not model this explicitly here. Red W1–W2 colors may also arise from AGN activity in dwarf galaxies (Aravindan \BOthers., \APACyear2024), but this is unlikely in our case given that all redder regions remain below the AGN threshold and are located away from the galactic center.
The spatial offset between the infrared and ultraviolet emission — particularly the asymmetry observed in W2 — raises the possibility of non-uniform star formation triggers. While DDO 43 is classified as an isolated system, the presence of a morphologically distinct, dust-rich zone may point to past internal instabilities or subtle external influences, such as minor tidal interactions (Subramanian \BOthers., \APACyear2024) or gas accretion events. These scenarios remain speculative in the absence of kinematic data, but highlight the value of multiwavelength analysis in revealing structural and evolutionary features that may otherwise go unnoticed.
Similar combinations of obscured and unobscured regions have been reported in other low-mass dwarf irregular galaxies. Zhang \BOthers. (\APACyear2012) found that a significant fraction of such systems exhibit “outside-in” star formation histories, where recent activity becomes increasingly confined to the central regions, while the outer disk becomes quiescent. The presence of both UV-bright, W2-faint zones and W2-bright, UV-dark clumps within DDO 43 fits well into this broader picture, suggesting that this galaxy may represent a typical example of the heterogeneous internal structure and evolutionary path seen among low-mass dwarfs.
In summary, our results suggest that DDO 43 hosts a primarily unobscured, moderately active star-forming population, with localized regions of potential embedded star formation and internal asymmetry. Narrow-band H imaging from the LITTLE THINGS survey shows no pronounced emission at the location of the W2-bright region; this neither proves nor rules out embedded star formation, since very dusty environments could remain invisible even in H. Future studies incorporating spatially resolved H i data and mid-infrared spectroscopy may help further clarify the origin and nature of these features. Optical and infrared spectroscopy and imaging with high spatial resolution — for example, using SUBARU/FOCAS (Kashikawa \BOthers., \APACyear2002) or SUBARU/IRCS — could both reveal kinematic signatures of past perturbations and directly test whether the W2-bright, UV-dark region indeed hosts heavily obscured star formation. We are preparing a proposal for such SUBARU/IRCS observations, since the - and -bands are closely matched to the W1 and W2 wavelength regime. Likewise, deeper and higher-resolution ultraviolet imaging, such as with UVIT onboard the AstroSat mission (Tandon \BOthers., \APACyear2017), could confirm whether the W2-bright, UV-dark regions are truly lacking in UV emission or merely unresolved in the current GALEX data.
Acknowledgements
Supported by the University of Debrecen Program for Scientific Publication.
Based on observations made with the NASA Galaxy Evolution Explorer. GALEX is operated for NASA by the California Institute of Technology under NASA contract NAS5-98034.
This publication makes use of data products from the Wide-field Infrared Survey Explorer, which is a joint project of the University of California, Los Angeles, and the Jet Propulsion Laboratory/California Institute of Technology, funded by the National Aeronautics and Space Administration.
We are grateful to Deidre Hunter and Bruce Elmegreen for their helpful comments on the manuscript and for their leadership in the LITTLE THINGS project, which included DDO 43.
We also thank the anonymous referee for the many constructive comments and suggestions that greatly improved the paper.
References
- Aravindan \BOthers. (\APACyear2024) \APACinsertmetastarAravindan2024{APACrefauthors}Aravindan, A., Canalizo, G., Secrest, N., Satyapal, S.\BCBL \BBA Bohn, T. \APACrefYearMonthDay2024\APACmonth11, \APACjournalVolNumPagesApJ975160. {APACrefDOI} 10.3847/1538-4357/ad702b \PrintBackRefs\CurrentBib
- Bianchi \BOthers. (\APACyear2011) \APACinsertmetastarBianchi2011{APACrefauthors}Bianchi, L., Herald, J., Efremova, B. et al. \APACrefYearMonthDay2011\APACmonth09, \APACjournalVolNumPagesAp&SS3351161-169. {APACrefDOI} 10.1007/s10509-010-0581-x \PrintBackRefs\CurrentBib
- Cutri \BOthers. (\APACyear2021) \APACinsertmetastarCutri2013{APACrefauthors}Cutri, R\BPBIM., Wright, E\BPBIL., Conrow, T. et al. \APACrefYearMonthDay2021\APACmonth02, \APACrefbtitleVizieR Online Data Catalog: AllWISE Data Release (Cutri+ 2013). VizieR Online Data Catalog: AllWISE Data Release (Cutri+ 2013)., \APAChowpublishedVizieR On-line Data Catalog: II/328. Originally published in: IPAC/Caltech (2013). \PrintBackRefs\CurrentBib
- Dale \BOthers. (\APACyear2009) \APACinsertmetastarDale2009{APACrefauthors}Dale, D\BPBIA., Cohen, S\BPBIA., Johnson, L\BPBIC. et al. \APACrefYearMonthDay2009\APACmonth09, \APACjournalVolNumPagesApJ7031517-556. {APACrefDOI} 10.1088/0004-637X/703/1/517 \PrintBackRefs\CurrentBib
- Héraudeau \BOthers. (\APACyear2004) \APACinsertmetastarHeraudeau2004{APACrefauthors}Héraudeau, P., Oliver, S., del Burgo, C. et al. \APACrefYearMonthDay2004\APACmonth11, \APACjournalVolNumPagesMNRAS3543924-934. {APACrefDOI} 10.1111/j.1365-2966.2004.08259.x \PrintBackRefs\CurrentBib
- Hunter \BOthers. (\APACyear2012) \APACinsertmetastarHunter2012{APACrefauthors}Hunter, D\BPBIA., Ficut-Vicas, D., Ashley, T. et al. \APACrefYearMonthDay2012\APACmonth11, \APACjournalVolNumPagesAJ1445134. {APACrefDOI} 10.1088/0004-6256/144/5/134 \PrintBackRefs\CurrentBib
- Jarrett \BOthers. (\APACyear2023) \APACinsertmetastarJarrett2023{APACrefauthors}Jarrett, T\BPBIH., Cluver, M\BPBIE., Taylor, E\BPBIN., Bellstedt, S., Robotham, A\BPBIS\BPBIG.\BCBL \BBA Yao, H\BPBIF\BPBIM. \APACrefYearMonthDay2023\APACmonth04, \APACjournalVolNumPagesApJ946295. {APACrefDOI} 10.3847/1538-4357/acb68f \PrintBackRefs\CurrentBib
- Kashikawa \BOthers. (\APACyear2002) \APACinsertmetastarKashikawa2002{APACrefauthors}Kashikawa, N., Aoki, K., Asai, R. et al. \APACrefYearMonthDay2002\APACmonth12, \APACjournalVolNumPagesPASJ546819-832. {APACrefDOI} 10.1093/pasj/54.6.819 \PrintBackRefs\CurrentBib
- Kelsall \BOthers. (\APACyear1998) \APACinsertmetastarKelsall1998{APACrefauthors}Kelsall, T., Weiland, J\BPBIL., Franz, B\BPBIA. et al. \APACrefYearMonthDay1998\APACmonth11, \APACjournalVolNumPagesApJ508144-73. {APACrefDOI} 10.1086/306380 \PrintBackRefs\CurrentBib
- R\BPBIC. Kennicutt \BBA Evans (\APACyear2012) \APACinsertmetastarKennicuttEvans2012{APACrefauthors}Kennicutt, R\BPBIC.\BCBT \BBA Evans, N\BPBIJ. \APACrefYearMonthDay2012\APACmonth09, \APACjournalVolNumPagesARA&A50531-608. {APACrefDOI} 10.1146/annurev-astro-081811-125610 \PrintBackRefs\CurrentBib
- R\BPBIC. Kennicutt Jr. (\APACyear1998) \APACinsertmetastarKennicutt1998{APACrefauthors}Kennicutt, R\BPBIC., Jr. \APACrefYearMonthDay1998\APACmonth01, \APACjournalVolNumPagesARA&A36189-232. {APACrefDOI} 10.1146/annurev.astro.36.1.189 \PrintBackRefs\CurrentBib
- Kovács \BOthers. (\APACyear2019) \APACinsertmetastarkovacs2019{APACrefauthors}Kovács, T\BPBIO., Burgarella, D., Kaneda, H., Molnár, D\BPBIC., Oyabu, S., Pinter, S.\BCBL \BBA Toth, L\BPBIV. \APACrefYearMonthDay2019\APACmonth04, \APACjournalVolNumPagesPASJ71227. {APACrefDOI} 10.1093/pasj/psy145 \PrintBackRefs\CurrentBib
- Lang (\APACyear2014) \APACinsertmetastarLang2014{APACrefauthors}Lang, D. \APACrefYearMonthDay2014\APACmonth05, \APACjournalVolNumPagesAJ1475108. {APACrefDOI} 10.1088/0004-6256/147/5/108 \PrintBackRefs\CurrentBib
- Liu \BOthers. (\APACyear2020) \APACinsertmetastarliu2020{APACrefauthors}Liu, T., Evans, N\BPBIJ., Kim, K\BHBIT. et al. \APACrefYearMonthDay2020\APACmonth08, \APACjournalVolNumPagesMNRAS49632821-2835. {APACrefDOI} 10.1093/mnras/staa1501 \PrintBackRefs\CurrentBib
- Marocco \BOthers. (\APACyear2021) \APACinsertmetastarMarocco2021{APACrefauthors}Marocco, F., Eisenhardt, P\BPBIR\BPBIM., Fowler, J\BPBIW. et al. \APACrefYearMonthDay2021\APACmonth03, \APACjournalVolNumPagesApJS25318. {APACrefDOI} 10.3847/1538-4365/abd805 \PrintBackRefs\CurrentBib
- Martin \BOthers. (\APACyear2005) \APACinsertmetastarMartin2005{APACrefauthors}Martin, D\BPBIC., Fanson, J., Schiminovich, D. et al. \APACrefYearMonthDay2005\APACmonth01, \APACjournalVolNumPagesApJ6191L1-L6. {APACrefDOI} 10.1086/426387 \PrintBackRefs\CurrentBib
- Morrissey \BOthers. (\APACyear2007) \APACinsertmetastarMorrissey2007{APACrefauthors}Morrissey, P., Conrow, T., Barlow, T\BPBIA. et al. \APACrefYearMonthDay2007\APACmonth12, \APACjournalVolNumPagesApJS1732682-697. {APACrefDOI} 10.1086/520512 \PrintBackRefs\CurrentBib
- Nikutta \BOthers. (\APACyear2014) \APACinsertmetastarNikutta2014{APACrefauthors}Nikutta, R., Hunt-Walker, N., Nenkova, M., Ivezić, Ž.\BCBL \BBA Elitzur, M. \APACrefYearMonthDay2014\APACmonth08, \APACjournalVolNumPagesMNRAS44243361-3379. {APACrefDOI} 10.1093/mnras/stu1087 \PrintBackRefs\CurrentBib
- Norris \BOthers. (\APACyear2014) \APACinsertmetastarNorris2014{APACrefauthors}Norris, M\BPBIA., Meidt, S., Van de Ven, G., Schinnerer, E., Groves, B.\BCBL \BBA Querejeta, M. \APACrefYearMonthDay2014\APACmonth12, \APACjournalVolNumPagesApJ797155. {APACrefDOI} 10.1088/0004-637X/797/1/55 \PrintBackRefs\CurrentBib
- Pichler \BOthers. (\APACyear2025) \APACinsertmetastarPichler2025b{APACrefauthors}Pichler, E., Koncz, B., Gabanyi, K\BPBIE., Joó, A\BPBIP.\BCBL \BBA Tóth, L\BPBIV. \APACrefYearMonthDay2025Mar., \APACjournalVolNumPagesActa Polytechnica65173–78. {APACrefURL} https://ojs.cvut.cz/ojs/index.php/ap/article/view/9973 {APACrefDOI} 10.14311/AP.2025.65.0073 \PrintBackRefs\CurrentBib
- Salim \BOthers. (\APACyear2007) \APACinsertmetastarsalim2007{APACrefauthors}Salim, S., Rich, R\BPBIM., Charlot, S. et al. \APACrefYearMonthDay2007\APACmonth12, \APACjournalVolNumPagesApJS1732267-292. {APACrefDOI} 10.1086/519218 \PrintBackRefs\CurrentBib
- Schlegel \BOthers. (\APACyear1998) \APACinsertmetastarSchlegel1998{APACrefauthors}Schlegel, D\BPBIJ., Finkbeiner, D\BPBIP.\BCBL \BBA Davis, M. \APACrefYearMonthDay1998\APACmonth06, \APACjournalVolNumPagesApJ5002525-553. {APACrefDOI} 10.1086/305772 \PrintBackRefs\CurrentBib
- Simonian \BBA Martini (\APACyear2017) \APACinsertmetastarsimonian2017{APACrefauthors}Simonian, G\BPBIV.\BCBT \BBA Martini, P. \APACrefYearMonthDay2017\APACmonth02, \APACjournalVolNumPagesMNRAS46443920-3936. {APACrefDOI} 10.1093/mnras/stw2623 \PrintBackRefs\CurrentBib
- Simpson \BOthers. (\APACyear2005) \APACinsertmetastarSimpson2005{APACrefauthors}Simpson, C\BPBIE., Hunter, D\BPBIA.\BCBL \BBA Nordgren, T\BPBIE. \APACrefYearMonthDay2005\APACmonth09, \APACjournalVolNumPagesAJ13031049-1064. {APACrefDOI} 10.1086/432537 \PrintBackRefs\CurrentBib
- Stern \BOthers. (\APACyear2012) \APACinsertmetastarStern2012{APACrefauthors}Stern, D., Assef, R\BPBIJ., Benford, D\BPBIJ. et al. \APACrefYearMonthDay2012\APACmonth07, \APACjournalVolNumPagesApJ753130. {APACrefDOI} 10.1088/0004-637X/753/1/30 \PrintBackRefs\CurrentBib
- Subramanian \BOthers. (\APACyear2024) \APACinsertmetastarSubramanian2024{APACrefauthors}Subramanian, S., Mondal, C.\BCBL \BBA Kalari, V. \APACrefYearMonthDay2024\APACmonth01, \APACjournalVolNumPagesA&A681A8. {APACrefDOI} 10.1051/0004-6361/202346536 \PrintBackRefs\CurrentBib
- Suleiman \BOthers. (\APACyear2022) \APACinsertmetastarsuleiman2022{APACrefauthors}Suleiman, N., Noboriguchi, A., Toba, Y. et al. \APACrefYearMonthDay2022\APACmonth10, \APACjournalVolNumPagesPASJ7451157-1185. {APACrefDOI} 10.1093/pasj/psac061 \PrintBackRefs\CurrentBib
- Tandon \BOthers. (\APACyear2017) \APACinsertmetastarTandon2017{APACrefauthors}Tandon, S\BPBIN., Subramaniam, A., Girish, V. et al. \APACrefYearMonthDay2017\APACmonth09, \APACjournalVolNumPagesAJ1543128. {APACrefDOI} 10.3847/1538-3881/aa8451 \PrintBackRefs\CurrentBib
- Wright \BOthers. (\APACyear2010) \APACinsertmetastarWright2010{APACrefauthors}Wright, E\BPBIL., Eisenhardt, P\BPBIR\BPBIM., Mainzer, A\BPBIK. et al. \APACrefYearMonthDay2010\APACmonth12, \APACjournalVolNumPagesAJ14061868-1881. {APACrefDOI} 10.1088/0004-6256/140/6/1868 \PrintBackRefs\CurrentBib
- Zhang \BOthers. (\APACyear2012) \APACinsertmetastarZhang2012{APACrefauthors}Zhang, H\BHBIX., Hunter, D\BPBIA., Elmegreen, B\BPBIG., Gao, Y.\BCBL \BBA Schruba, A. \APACrefYearMonthDay2012\APACmonth02, \APACjournalVolNumPagesAJ143247. {APACrefDOI} 10.1088/0004-6256/143/2/47 \PrintBackRefs\CurrentBib