Effect of gravity-driven longitudinal flows in filaments on angular momentum transport to embedded cores
Abstract
Different models of filament formation predict distinct patterns of angular momentum redistribution toward embedded cores, set by the underlying velocity-field structure, which can set the initial conditions for a preferential orientation between protostellar outflows and filaments. However, the absence of a dominant alignment in observations keeps this connection open to debate. We investigate whether gravity-driven longitudinal flows along filaments can redistribute angular momentum (AM) toward collapse centers and influence outflow-filament alignment. To this end, we analyze the distributions of 3D and 2D-projected angles between sink angular momentum vectors and host filament orientations in an SPH simulation of giant molecular cloud and filament formation. We also characterize the filament velocity field by measuring the angles between SPH particle velocity vectors and filament axes, and the degree of convergent flow toward filament density peaks. No preferred alignment between the sinks’ AM and the filament direction is found at early evolutionary stages, neither in 3D nor in 2D. Later, however, a predominantly perpendicular configuration emerges in 3D. Tracking individual sinks indicates that this alignment is not primordial but develops as gravity strengthens. In individual filaments, the onset of perpendicular alignment coincides with the development of convergent longitudinal flows. Finally, we estimate the minimum fraction of perpendicular 3D angles required to reveal a perpendicular 2D alignment for a given sample size. While longitudinal flows develop over extended timescales, once established, they can rapidly reorient the angular momentum vector of the sinks, enabling perpendicular alignments to arise within typical outflow lifetimes.
show]arroyochavezg@arizona.edu
]e.vazquez@irya.unam.mx
I Introduction
In recent years, star formation has increasingly been studied not as an isolated event, but as a consequence of the complex interplay between phenomena operating across multiple scales (Ballesteros-Paredes et al., 2012; Colombo et al., 2015; Vázquez-Semadeni et al., 2019). In particular, clumps and dense cores have been shown to reside within a hierarchical network of filaments that channels the gas toward local collapse centers (Schneider and Elmegreen, 1979; Bally et al., 1987; André et al., 2010; Molinari et al., 2010; Hacar et al., 2013; André et al., 2014; Planck Collaboration et al., 2016; Hacar et al., 2016, 2018). The dynamical study of the gas around these filaments has revealed the presence of multiple velocity components, including perpendicular accretion onto them (Palmeirim et al., 2013; Chen et al., 2020), longitudinal flows along their main axis (Myers, 2009; Kirk et al., 2013; Peretto et al., 2014; Gómez and Vázquez-Semadeni, 2014; Ren et al., 2021; Rawat et al., 2024), and rotation in a few examples (Hsieh et al., 2021; Álvarez-Gutiérrez et al., 2021; Salinas et al., 2025). These gas flows can directly impact the star formation process within filaments, particularly by regulating accretion onto dense cores and subsequently from the cores onto protostars (Anderson et al., 2021; Yang et al., 2023). Additionally, several studies have quantified both the direction and magnitude of the angular momentum of cores, considering the environment in which they form, including filamentary structures. These measurements have often been interpreted in terms of angular momentum acquisition mechanisms, including turbulence and accretion (e.g. Misugi et al., 2019, 2023b, 2023a; Kuznetsova et al., 2019). In turn, as a consequence of this accretion, feedback in the form of jets and outflows play a decisive role in local dynamics and the transport of momentum and energy to the surrounding environment, affecting the internal dynamics of their host filaments (Arce et al., 2007).
Recently, the influence of the filament velocity field on the relative orientation of protostellar outflows has gained considerable attention. Outflow samples from several nearby molecular clouds have been analyzed to investigate the degree of outflow-filament alignment (OFA). A statistical study in Perseus finds that the outflow-filament orientations are neither purely parallel nor purely perpendicular, consistent with a mixed or near-random distribution (Stephens et al., 2017). In Orion A, the overall orientation distribution is consistent with randomness; however, subsamples with higher-quality measurements exhibit a slight perpendicular preference, which has been interpreted as a potential signature of accretion along the filament (Feddersen et al., 2020). ALMA studies of massive protoclusters in a more evolved stage compared to infared dark clouds, likewise reveal no preferential orientation between outflows and filaments (Baug et al., 2020). On the other hand, Kong et al. (2019) collected a sample of outflows in the infrared dark cloud G28.37+0.07 (hereafter G28), and found statistical evidence that OFA in G28 is predominantly perpendicular. Although less frequently observed, evidence of parallel OFA has also been reported. In Serpens Main, outflows are found to be strongly co-aligned, lying within of the filament axis (Green et al., 2024). These results underscore the need for further detailed investigations to clarify the physical origin of this alignment and the processes that govern it.
Two theoretical models of core formation offer insights regarding the relative orientation between protostellar outflows and their host filaments. For instance, Anathpindika and Whitworth (2008) propose that filaments can form through the cooling of post-shock gas produced in cloud-cloud collisions. In this scenario, the orbital angular momentum of the colliding clouds is oriented perpendicular to the filaments that form within the compressed layer and evolve dynamically as the collision progresses. As the layer tumbles, the filaments move and deform accordingly, leading to increasing misalignment between the longitudinal gas flows that converge along them. This asymmetry generates a net torque on the central hub, imparting rotation. Consequently, the angular momentum vector (, see panel A in Fig. 1) of the core becomes oriented perpendicular to the filament, producing a perpendicular OFA111It is important to clarify that, from this point onward, our reference to this scenario concerns specifically the effect of misaligned longitudinal flows converging toward a collapse center in filaments. We do not, however, make any assumptions regarding the primary origin of the filaments themselves, whether they arise from cloud-cloud collisions, large-scale converging flows, or turbulent compression in the diffuse medium.. In contrast, Banerjee et al. (2006) suggest that filaments arise from shear in turbulent oblique shocks, which impart an initial rotation aligned with the filament’s major axis. This rotation is inherited by the cores during fragmentation, naturally leading to a parallel OFA (see panel B in Fig. 1).

The numerical simulation by Gómez and Vázquez-Semadeni (2014) of a head-on collision of two streams of warm atomic gas, appears more consistent with (Anathpindika and Whitworth, 2008). In their simulation simulation, filaments form in the compressed cold atomic layer by a combination of thermal and gravitational instabilities, and the filaments in turn develop local collapsing sites (cores and hubs) at their densest parts by gravitational instability. The gravitational attraction of these hubs and cores then generates a longitudinal flow along the filaments. Although these authors do not explicitly examine the angular momentum of the cores and hubs formed (and therefore neither the direction of the outflows), their simulations reveal a delay between their formation and the onset of longitudinal flows toward them. Once established, these flows impart rotation, implying that those formed later may have a preferential angular momentum orientation compared to those formed earlier. This picture is further supported by the results of Tsukamoto and Machida (2013), who follow the evolution of angular momentum orientations in protostellar disks relative to their parent cores. They find that disk and core angular momenta are initially uncorrelated, but progressively evolve toward a preferentially parallel configuration, after sustained periods of accretion, despite the turbulent nature of the environment.
In this work, we use a numerical simulation of cloud and filament formation to investigate the effect of gravity on the development of longitudinal flows along filaments, and how these flows can impart rotation at the convergence point, thereby setting the orientation of the angular momentum of the resulting cores and, in turn, potentially influencing the direction of their associated outflows, as proposed by Anathpindika and Whitworth (2008).
The structure of this paper is as follows. Section II describes the main characteristics of the simulation analyzed, followed by Section III, which details the methods and procedures employed in the analysis. Our results are presented in Section IV, with a discussion provided in Section V. Finally, the main conclusions are summarized in Section VII.
II Numerical data
We use the smoothed-particle hydrodynamics (SPH) code Phantom (Price et al., 2018), to perform a purely hydrodynamic simulations of decaying turbulence including gravity (labeled HDG3). The setup arises from combining the cluster Phantom setup preloaded in the public version derived from Bate et al. (2003), and the turbulent driving module based on the works of Price and Federrath (2010) and Tricco et al. (2016, 2017).
We simulate a pc box with periodic boundaries for hydrodynamics, with a resolution of . The simulation has an initial uniform density of and a temperature of K, corresponding to the equilibrium temperature at this density. Cooling and heating functions taken from Koyama and Inutsuka (2002) were also included, with the typographical correction of Vázquez-Semadeni et al. (2007). Forcing was applied during the first Myr for wave numbers such that , considering a solenoidal weight of , that is, a ratio of compressive to total forcing power of for 3D data (Federrath et al., 2010). After the forcing period, an rms sonic Mach number of is reached, equivalent to a velocity dispersion of km/s, with a maximum of at Myr, increase due to the formation of cold gas. The density for sink formation was fixed at , and are capable of accreting and merging. These simulations do not contain any star feedback prescriptions, nor magnetic field. The times of interest are those from the formation of the first sink, at time Myr, onwards. The final time considered is Myr. In the first row of Figure 2, we show the projected density field for run HDG3, at times , and Myr. White dots correspond to the sinks particles, which, due to resolution, represent stellar groups rather than individual stars.

III Methods
III.1 Filament identification
Filament identification is performed using DisPerSE (Discrete Persistent Structures Extractor; Sousbie (2011)), a topology-based algorithm that applies discrete Morse theory to identify voids, walls, clusters, and filaments from a scalar field defined in space. In this work, the input to DisPerSE is an interpolated density field mapped onto a 3D regular grid. This mesh is constructed from the Phantom simulation outputs using the Splash visualization and analysis tool (Price, 2007).
The DisPerSE algorithm incorporates a persistence threshold that sets a lower limit for identifying structures that are statistically significant with respect to the background noise. For the analysis of filaments across the entire computational domain, a persistence threshold corresponding to a density of cm-3 was adopted. In addition, selected filaments are analyzed individually, for which the persistence threshold is adjusted to better isolate the structure of interest. The second row of Figure 2 displays the filaments identified by DisPerSE, shown in cyan overlaid on the density field. A rich network of filamentary structures is recovered, becoming increasingly complex as the simulation evolves.
III.2 Core angular momentum approximation

As mentioned in the previous section, no prescription for stellar feedback is included in this simulation, consequently, the formation of actual protostellar outflows cannot be followed explicitly. Given the resolution of our simulations, we adopt the angular momentum of the sinks as a proxy for the angular momentum of the corresponding cores. Although the detailed evolution of protostellar accretion disks may be governed by the local dynamics within the disk/envelope itself, as demonstrated in the simulations by (Tsukamoto and Machida, 2013), the core angular momentum nevertheless provides a physically motivated first-order approximation to the expected disk orientation, in particular, when accretion onto the system is sustained. In our context, the presence of longitudinal flows along filaments naturally supplies such continued accretion, supporting the use of the core angular momentum as a meaningful indicator of the likely disk angular momentum direction.
Once a sink forms, the closest point along the filament spine identified by DisPerSE is found, and the sink is associated with that filament if its distance to the spine is pc. The local filament direction is then defined using the nearest consecutive spine points. Finally, we calculate the minimum 3D angle, , between sink’s angular momentum vector and filament’s direction. In the left panel of Figure 3 we show a representative scheme for calculating the angle between the angular momentum vector of the sinks (large white circles) in purple (), and the direction of the filament denoted in pink (f). We repeat this procedure at each time step, following the sinks from their formation to the final time studied ( Myr), or until they merge with a more massive sink, in which case they are considered as inactive or dead. We also defined a second subsample of sinks considering their contribution to the angles distribution during the first Myr from the time of their formation.
The full sink sample, that is, with not time restriction, is used to investigate whether a transition in the orientation of angular momentum occurs as gravity becomes increasingly important, thereby testing the alignment mechanism proposed by Anathpindika and Whitworth (2008). In contrast, the restricted subsample is designed to assess whether angular momentum vectors exhibit a preferential orientation at birth, depending on the evolutionary stage of the simulation, or whether such orientations emerge later as a consequence of gas dynamics. In other words, this approach allows us to distinguish between angular momentum orientations that are primordial and those that result from subsequent dynamical reorientation.
III.3 Velocity field around filaments
The velocity field around the filaments can be examined to assess whether gas motions exhibit a preferential orientation with respect to the filament axis. To this end, the 3D angle between the velocity vector of SPH particles in the vicinity of the filaments and the local filament direction, , is computed to determine the presence of any preferred alignment. Accretion motions onto the filament are expected to produce predominantly perpendicular orientations between these vectors, whereas longitudinal flows along the filament axis should manifest as a more parallel alignment.
To measure , curved cylindrical volumes of radius pc are defined around the filament spines identified with DisPerSE. All SPH particles within this radius are associated with their nearest spine point. To remove contributions from bulk motions, the mean velocity of the particles assigned to each spine point is subtracted from the velocity of each individual SPH particle. The local filament direction at each spine point is computed following the same procedure described in the previous section for the determination of . The minimum 3D angle between the particle velocity vector and the filament direction is then calculated. A schematic illustration of this procedure is shown in panel B of Figure 3, here the velocity vector, (), is indicated in purple, and the filament direction by a pink vector (f), for a representative particle, , shown in yellow. This procedure is repeated for all spine points in all filaments identified within the simulation domain.
Two filaments were also analyzed individually to assess whether the presence or absence of longitudinal flows is related to the emergence of a preferential alignment in the distribution. was computed following the same procedure described in the previous section for the full filament sample. In addition, to characterize the velocity field and evaluate the role of longitudinal flows, a single three-dimensional principal axis was fitted to the spatial distribution of points along the filament spine. The velocity vectors of the SPH particles were then projected onto this axis to construct a velocity profile along the filament’s major axis. The filament center, defined as the zero point in both position and velocity, was taken to be the projected spine point position whose associated SPH particles exhibit the highest mean density. A schematic illustration of the velocity decomposition is shown in panel C of Figure 3, where the velocity of an SPH particle () is projected onto the filament’s major axis (solid dark blue line) and obtaining ().
By adopting this axis definition for individual filaments, we aim to capture the overall tendency of the velocity field driven by gravity, which does not necessarily follow the exact spine geometry. Furthermore, defining a single principal axis is only feasible for isolated filaments that are sufficiently straight to admit a well-defined direction of elongation. This approach is not applicable when considering the full filament population, as these structures are typically curved and interconnected within a complex network. In such cases, the filament orientation was determined locally by estimating the tangent direction at each reference spine point using its immediate neighboring points, as described above.
IV Results
IV.1 Full-box analysis
IV.1.1 Sink angular momentum-filament alignment
In Figure 4, we show the evolution of the histograms of . Each histogram is plotted vertically at each time step, with the color coding representing the frequency per bin. From top to bottom, the first panel shows this evolution for all active sinks within the simulation domain over the time period considered. It can be seen that at early times ( Myr), the distribution appears random, while at later times a tendency towards perpendicularity emerges, with high frequencies (light-colored bins) in the upper right quadrant. However, it is well known that, unlike projected 2D angles, the distribution of 3D angles between pairs of randomly generated 3D vectors is not uniform, rather, it peaks at (Stephens et al., 2017). As the simulation generates more sinks, there is a possibility that the tendency is merely a geometric bias. To clarify whether this is a genuine trend or a statistic artifact, in the third panel of Figure 4 we show the evolution of the histograms of the cosine of shown in the first panel, since the cosine of the distribution of angles between random 3D vectors is indeed uniform. A genuine trend should also be observed in the evolution of the distribution of angle cosines, as indeed happens in this panel. Therefore, we consider this to be a trend resulting from physical processes and not due to geometric effects.


This behavior can be explained either by the reorientation of the angular momentum of the sinks at later times in the simulation, or by new sinks formed with an initial preferred orientation. To further elucidate this point, we conducted a second tracking considering sinks during the first Myr after their formation, as described in Section III.2. From top to bottom, in the second and fourth panels of Figure 4, we show the evolution of the histogram of and for this sample. Compared with the non-restricted sampled in the first and third panel, no clear tendency is found. The overall trend seems rather random.
This suggests that the excess of large angles (i.e., near-perpendicular alignments) observed at later times does not arise from newly formed sinks that are initially born with such orientations. Instead, it is primarily the result of a subsequent reorientation of sinks that formed earlier, leading to an increase in toward perpendicular configurations over time. To illustrate this, Figure 5 shows the trajectories of sinks in the histogram evolution from Figure 4. These sinks were selected as they remained active for most of the simulation, allowing detection of any potential reorientation of . However, during the tracking period, it is possible that a sink may detach from a filament, or that a filament identified by DisPerSE might break apart during the sink formation process, preventing it from being assigned to a filament for some snapshots. For this reason, we indicate with solid lines the periods where continuous data for the sink point is available, with a maximum time difference of Myr. Dotted lines, on the other hand, connect points with a time separation greater than this value. As can be seen, during the first few million years of tracking, there are significant fluctuations in the measurements of possibly due to the early formation of filaments, or accretion processes onto the sinks. From Myr onwards, a trend emerges towards oscillations near , and therefore explaining the high density of angles in this region. One possible explanation for this reorientation could be the development of longitudinal flows as gravity begins to exert a stronger influence on the filaments dynamics, and therefore, favoring the scenario proposed by Anathpindika and Whitworth (2008).


In order to compare with observations, which only have access to information on the plane of the sky, we perform 2D projections of the angular momentum vectors of the sinks and the filament orientation onto the three coordinate planes, and measure the angle between them, . We seek to determine whether the trend towards perpendicularity observed in 3D also occurs in 2D projections. Figure 6 shows the evolution of the histograms projected onto the three coordinate planes. Unlike the three-dimensional case, no trend is observed in any of these planes, indicating that the projected trend is a random distribution. However, it is possible to identify times for which the distribution under a certain projection may appear moderately parallel or perpendicular, even for the same time. In Figure 7 we take two snapshots at times (warm colors) and (cold colors) Myr (highlighted in Figure 6), and we plot the cumulative histogram of for the three projections at each time. For comparison, the perpendicular (dashed line, ), parallel (dotted line, ), and random (solid line, ) distributions are shown. The histograms vary greatly at Myr, showing moderately perpendicular alignment on the plane, while in the and planes it appears to lean toward a moderately parallel orientation. On the other hand, at time Myr, the distribution appears to be mainly random in all three projections. This appears to be the dominant case at late times in the simulation, where as more sinks are formed, the distribution appears to plateau at a random distribution. This suggests that, as might be expected, 2D projections reveal a fraction of the complete 3D information.


IV.1.2 Velocity vector-filament alignment

To characterize the gas dynamics within the filaments in a global manner, we computed the time evolution of the 3D angle, , between the velocity vectors of SPH particles located within pc of the filament spine, and the local filament orientation, as illustrated in panel B of Figure 3. Figure 8 shows the evolution of the probability distribution function of , and the dashed cyan line marks . In the early stages, a deficit of angles near () is observed, consistent with accretion flows directed toward the filament predominantly perpendicular to its major axis. As the simulation evolves, this deficit gradually shifts toward configurations clustered around . At later times in the simulation, when gravity is expected to dominate the dynamics, a clear excess of angles close to zero (; upper-right corner) emerges. This behavior is indicative of the development of longitudinal flows parallel to the filament axis and is consistent with the contemporaneous appearance of angles close to in the distribution of angles between the sinks’ angular momentum vectors and the local filament direction. The top panel presents the evolution of the total number of angles (), and therefore, of the SPH particles associated with filaments. may initially decrease as new sinks form and begin to accrete SPH particles, potentially reducing the number of SPH particles remaining within filamentary structures. This trend could also be associated with the possibility that, following the initial turbulent compressions, some overdense regions do not continue toward sustained gravitational collapse and instead disperse. The subsequent rise in after Myr may reflect a renewed phase of accretion onto the filaments as they grow in mass.
IV.2 Individual filaments
IV.2.1 Filament 1


.
In the top rows of Figure 9 we show the projected density field of one single pc-long filament at times and Myr. The second row shows the points belonging to the filament spine provided by DisPerSE in cyan on top of the density field. Sink particles are represented by white dots, and the transparent white arrows represent the direction of their angular momentum vector. It can be seen how the sinks move across the filament, approaching each other and eventually orbiting in multiple systems or merging.
We repeat the process to measure for this filament, and follow its evolution from Myr where 2 sinks have already formed. For individual filaments no time constraint was applied, so as not to further decrease the already small sample of sinks. In Figure 10 we show the evolution of the histograms of for Filament 1 (second row). During the first megayears no particular trend is observed. However, between and Myr, a tendency to have preferably parallel orientations seems to emerge. From Myr onwards, this orientation seems to reorient to a predominantly perpendicular one, similar to the behavior of the sinks presented in Figure 5 distributed throughout the numerical box.
To assess whether this reorientation is driven by longitudinal flows along the filament, a principal axis was fitted to the spine-point distribution, and the SPH particle velocities were projected onto this axis, as described in Section III.3 and shown in panel C of Figure 3.
At each snapshot, the filament center (in position and velocity) was defined as the local density peak. The resulting velocity projection for Filament 1 is shown in the upper panel of Figure 10. Black dots represent the projected position of the sinks at each time step. Three distinct evolutionary phases were identified, delimited by the dashed green and blue horizontal lines, which are also indicated in the heat map (top second panel). Before any preferred alignment emerges (below the blue dashed line), the inflow velocities toward the density peak are modest, on the order of km s-1. It can also be seen that the two initially formed sinks move toward each other in a consistent manner, a behavior that reappears later in the evolution and typically occurs in regions of converging flow. During the stage in which a predominantly parallel alignment develops (between the blue and green dashed lines), the inflow velocity increase to km s-1, though this flow originates primarily from one side of the filament. Around Myr, the high-velocity stream becomes offset from the density peak, suggesting the emergence of a secondary collapse center.
Finally, after Myr (above the green dashed line), when the alignment becomes predominantly perpendicular, accretion proceeds from both ends of the filament toward the densest region. This symmetric inflow may impart angular momentum to the central hub and promote the reorientation of the sink angular momenta. Furthermore, this reorientation can arise not only from the accretion of converging flows onto the sinks, but also from the contribution of orbital angular momentum during the formation of multiple systems by sink migration. The absence of data in portions of the filament between and pc from the collapse center likely reflects a physical break in the structure, produced by the accelerated inflow of material toward the dense region, which creates a void around the hub. This acceleration can be also seen in the simulation presented by Gómez and Vázquez-Semadeni (2014).


In order to test whether this behavior is also recovered in the two-dimensional case, in Figure 11 we have projected the 3D distribution evolution of onto the three coordinate planes 222Note that we present the results in terms of the angle itself rather than its cosine. In two dimensions, as is not the case in 3D, the distribution of angles between randomly oriented vector pairs is uniform, which provides the appropriate reference case against which we compare our measurements in order to identify any systematic deviation from randomness.. We then take two snapshots at times (warm colors) and (cold colors) Myr which correspond to the times when the distribution appears mainly parallel and perpendicular respectively, and plot the cumulative distribution functions for at both times in Figure 12, following the same color pattern.
It can be seen that at time Myr the cumulative distributions tends to be above the solid black line, and therefore, closer to a parallel distribution (black dotted line). On the other hand, at time Myr the cumulative distribution is positioned on and below the solid black line, with the projection on the plane in cyan being the one that recovers the distribution closest to the perpendicular distribution (black dashed line). For all three projections, the distribution at time Myr are positioned above their equivalent at time . Although the same behavior is reproduced in 3D and 2D for this filament, it is important to note, however, that the relatively small number of sinks leads to increased statistical noise in the cumulative histograms. Consequently, these results should be interpreted with caution.

IV.2.2 Filament 2
We also consider a second filament in which there does not appear to be a clear longitudinal flow shown in the two lower rows of Figure 9. In this case, the sinks do not appear to be approaching each other and rather seem to remain in their place of origin. The two lower panels of Figure 10 presents the corresponding evolution of distribution and the longitudinal velocity () for the filament axis obtained by fitting the spine points from DisPerSE, respectively, and using the same color scale for as in Filament 1. As expected, the angle distribution shows no significant preferential alignment throughout the Myr of evolution.
The evolution of the longitudinal velocity profile (third panel) indicates that during the first Myr the density peak lies closer to one end of the filament, with no clear evidence of coherent convergence toward a single point. After Myr, weak convergence appears at specific locations that correspond to sink positions. Although these flows are substantially weaker than those in Filament 1, they may still contribute to the reorientation of the angular momentum vectors of some sinks, as suggested by the mild excess of angles near after Myr in the bottom panel for distribution. However, the reduced number of sinks limits the statistical significance of this feature.
V Discussion
V.1 Can gravity-driven longitudinal flows form rapidly enough to orient outflows?
We have investigated the isolated role of gravity in driving longitudinal flows along filaments and its ability to produce a predominantly perpendicular alignment between sink angular momentum and the filament’s main axis, thereby testing the alignment mechanism proposed by Anathpindika and Whitworth (2008). In our simulation, the angular momentum vectors of the sinks gradually reorient as shown in Figure 5. Some sinks begin to oscillate near by Myr, whereas most of them tend to reorient by Myr. This timescales are broadly consistent with reported values for mass growth in filaments (- Myr, Treviño-Morales et al., 2019) and longitudinal collapse (- Myr, Peretto et al., 2014; Yuan et al., 2020). However, they are longer than the typical protostellar outflow lifetime ( Myr, Bally, 2016).
This raises the question of whether gravity alone can reorient sinks’ angular momentum at a characteristic time within the lifetime of protostellar outflows. An additional consideration is that the sink tracking shown in Fig. 5 includes only sinks that survived long enough to follow their angular-momentum evolution. Sinks are removed from the sample once they merge with a more massive one. When sinks are tracked only during the first Myr of their lifetime, no preferential alignment is found between their angular momentum vectors and the filament axis. This suggests that gravity may not act rapidly enough to produce an observable reorientation within this early phase. However, the absence of a detectable signal may also reflect the global filament population. Only a minority of filaments exhibit strong longitudinal flows, while most resemble Filament 2 in the bottom panels of Fig. 9. If only a small subset of sinks undergo rapid reorientation, their contribution may be insufficient to dominate the overall angle distribution. Moreover, in filaments with significant longitudinal flows, such as Filament 1, sinks tend to migrate, increasing the likelihood that recently reoriented sinks merge and are therefore removed from the statistics. This would naturally reduce the number of angles near , further obscuring any early-time signature of preferential alignment.
A total of sinks associated with filaments were identified over the course of the simulation. By the final time considered, remained, implying that % were accreted by other sinks. Among the full sample, sinks formed with between and and remained within this range until their removal (by merging) or until the final snapshot. An additional sinks formed with outside this interval but later reoriented into the range and stayed there.
Top right panel of Figure 13 presents sink lifetimes, measured from formation until it leaves the statistics due to merging with a more massive sink or reaching the end of the simulation, vs reorientation times, defined as the time between sink formation and the moment when enters, and subsequently remains within, the interval for the sinks mentioned above. Color represents the simulation times at which these reorientations occur, and the dashed black line represents the identity line. These three quantities are presented individually in the histograms of the three remaining panels in the same figure. Most sinks reorient within Myr, with a mode at Myr. The majority of reorientations take place at later times in the simulation, consistent with the increasing influence of gravity as some filaments develop stronger longitudinal flows.
This appears to suggest that, once longitudinal flows are established, they may be capable of reorienting the angular momentum of the sink within a timescale comparable to the lifetime of protostellar outflows. However, such flows occur only in a subset of filaments, and at the adopted resolution they also promote sink migration and subsequent merging, as can be seen from their short lifespan. In fact, the clustering of sinks near the identity line (dashed black line) suggests that once they undergo significant reorientation, they are rapidly accreted. As a consequence, the fraction of sinks that undergo early and sustained reorientation is not large enough to generate a clear statistical signal in the full sample. We expect that increasing the resolution, thereby reducing the imposed sink-merging radius, should allow a detectable tendency toward perpendicular alignment in some filaments when restricting the statistical analysis to the first Myr of sink evolution. However, it remains uncertain whether such a signal would emerge in the global statistics, given that only a subset of filaments develop significant longitudinal flows. A detailed exploration of these effects is left for a forthcoming study.


V.2 3D perpendicular angle fraction for 2D perpendicular alignment detection
Throughout this work, we have shown that, while the distribution of is predominantly perpendicular at later times in the simulation for the full sink sample, its 2D projection appears closer to random. As discussed above, this arises from the fact that the angle distribution between two randomly oriented 3D vectors is intrinsically non-uniform and peaks near , whereas its 2D projection yields a uniform distribution. Consequently, detecting a perpendicular alignment in the cumulative histograms of the 2D projection requires an excess of angles near relative to the random expectation. To quantify this requirement, we carry out a Monte-Carlo forward modeling analysis to determine the minimum fraction of 3D angles in the range needed for the projected 2D cumulative distribution function (CDF) to be statistically distinguishable from a random distribution, thereby enabling the identification of a perpendicular alignment.
We define a sample of measurements composed of a mixture of two subsamples: one corresponding to a 3D random distribution (hereafter, null sample), and another corresponding to a perpendicular distribution, generated from 3D angles in the range . In this way, we can represent the CDF of the mixture () as a linear combination such that
| (1) |
To compare two CDFs, and , we employ the Kolmogorov-Smirnov (KS) statistic, defined as the maximum vertical separation between them. Formally,
| (2) |
We aim to compare the full (mixed) sample with the null (random) sample in order to determine the value of that maximizes their difference. Identifying these two samples as and in equation (2), and using equation (1), we have
| (3) |
Then,
| (4) |
with being the maximum difference between the 2D CDFs of the perpendicular and null samples.
In practice, we work with empirical CDFs (ECDFs), constructed from a finite sample of N measurements or events, which approximate the true underlying CDF. ECDFs exhibit sampling fluctuations that typically scale as (Vaart, 1998). Therefore, to detect a significant difference between two CDFs, the intrinsic noise in the ECDFs must exceed:
| (5) |
In this equation, is a constant that depends on the decision method. For the case of a single-sample KS test at level , the classical constant (Smirnov, 1948) is
| (6) |
Then, from equations (5) and (4),
| (7) |
does not have a known analytical form, but can be estimated empirically through Monte-Carlo experiments. To do so, we compute the angle between pairs of randomly oriented 3D vectors and define two samples: a null sample considering all angles, and a perpendicular sample restricted to angles between and . The generation of the 3D random vectors and their 2D projections was computed following Stephens et al. (2017). As expected, the larger the angle samples, the better the value of will be constrained. We then evaluate the maximum vertical separation between their CDFs in 2D obtaining
| (8) |
Then, from equation (7),
| (9) |
It is worth mentioning that this represents a lower limit on the required fraction of angles close to , since the null sample already has an intrinsic majority of these angles. Therefore, it should be understood as the excess of angles above the null distribution.
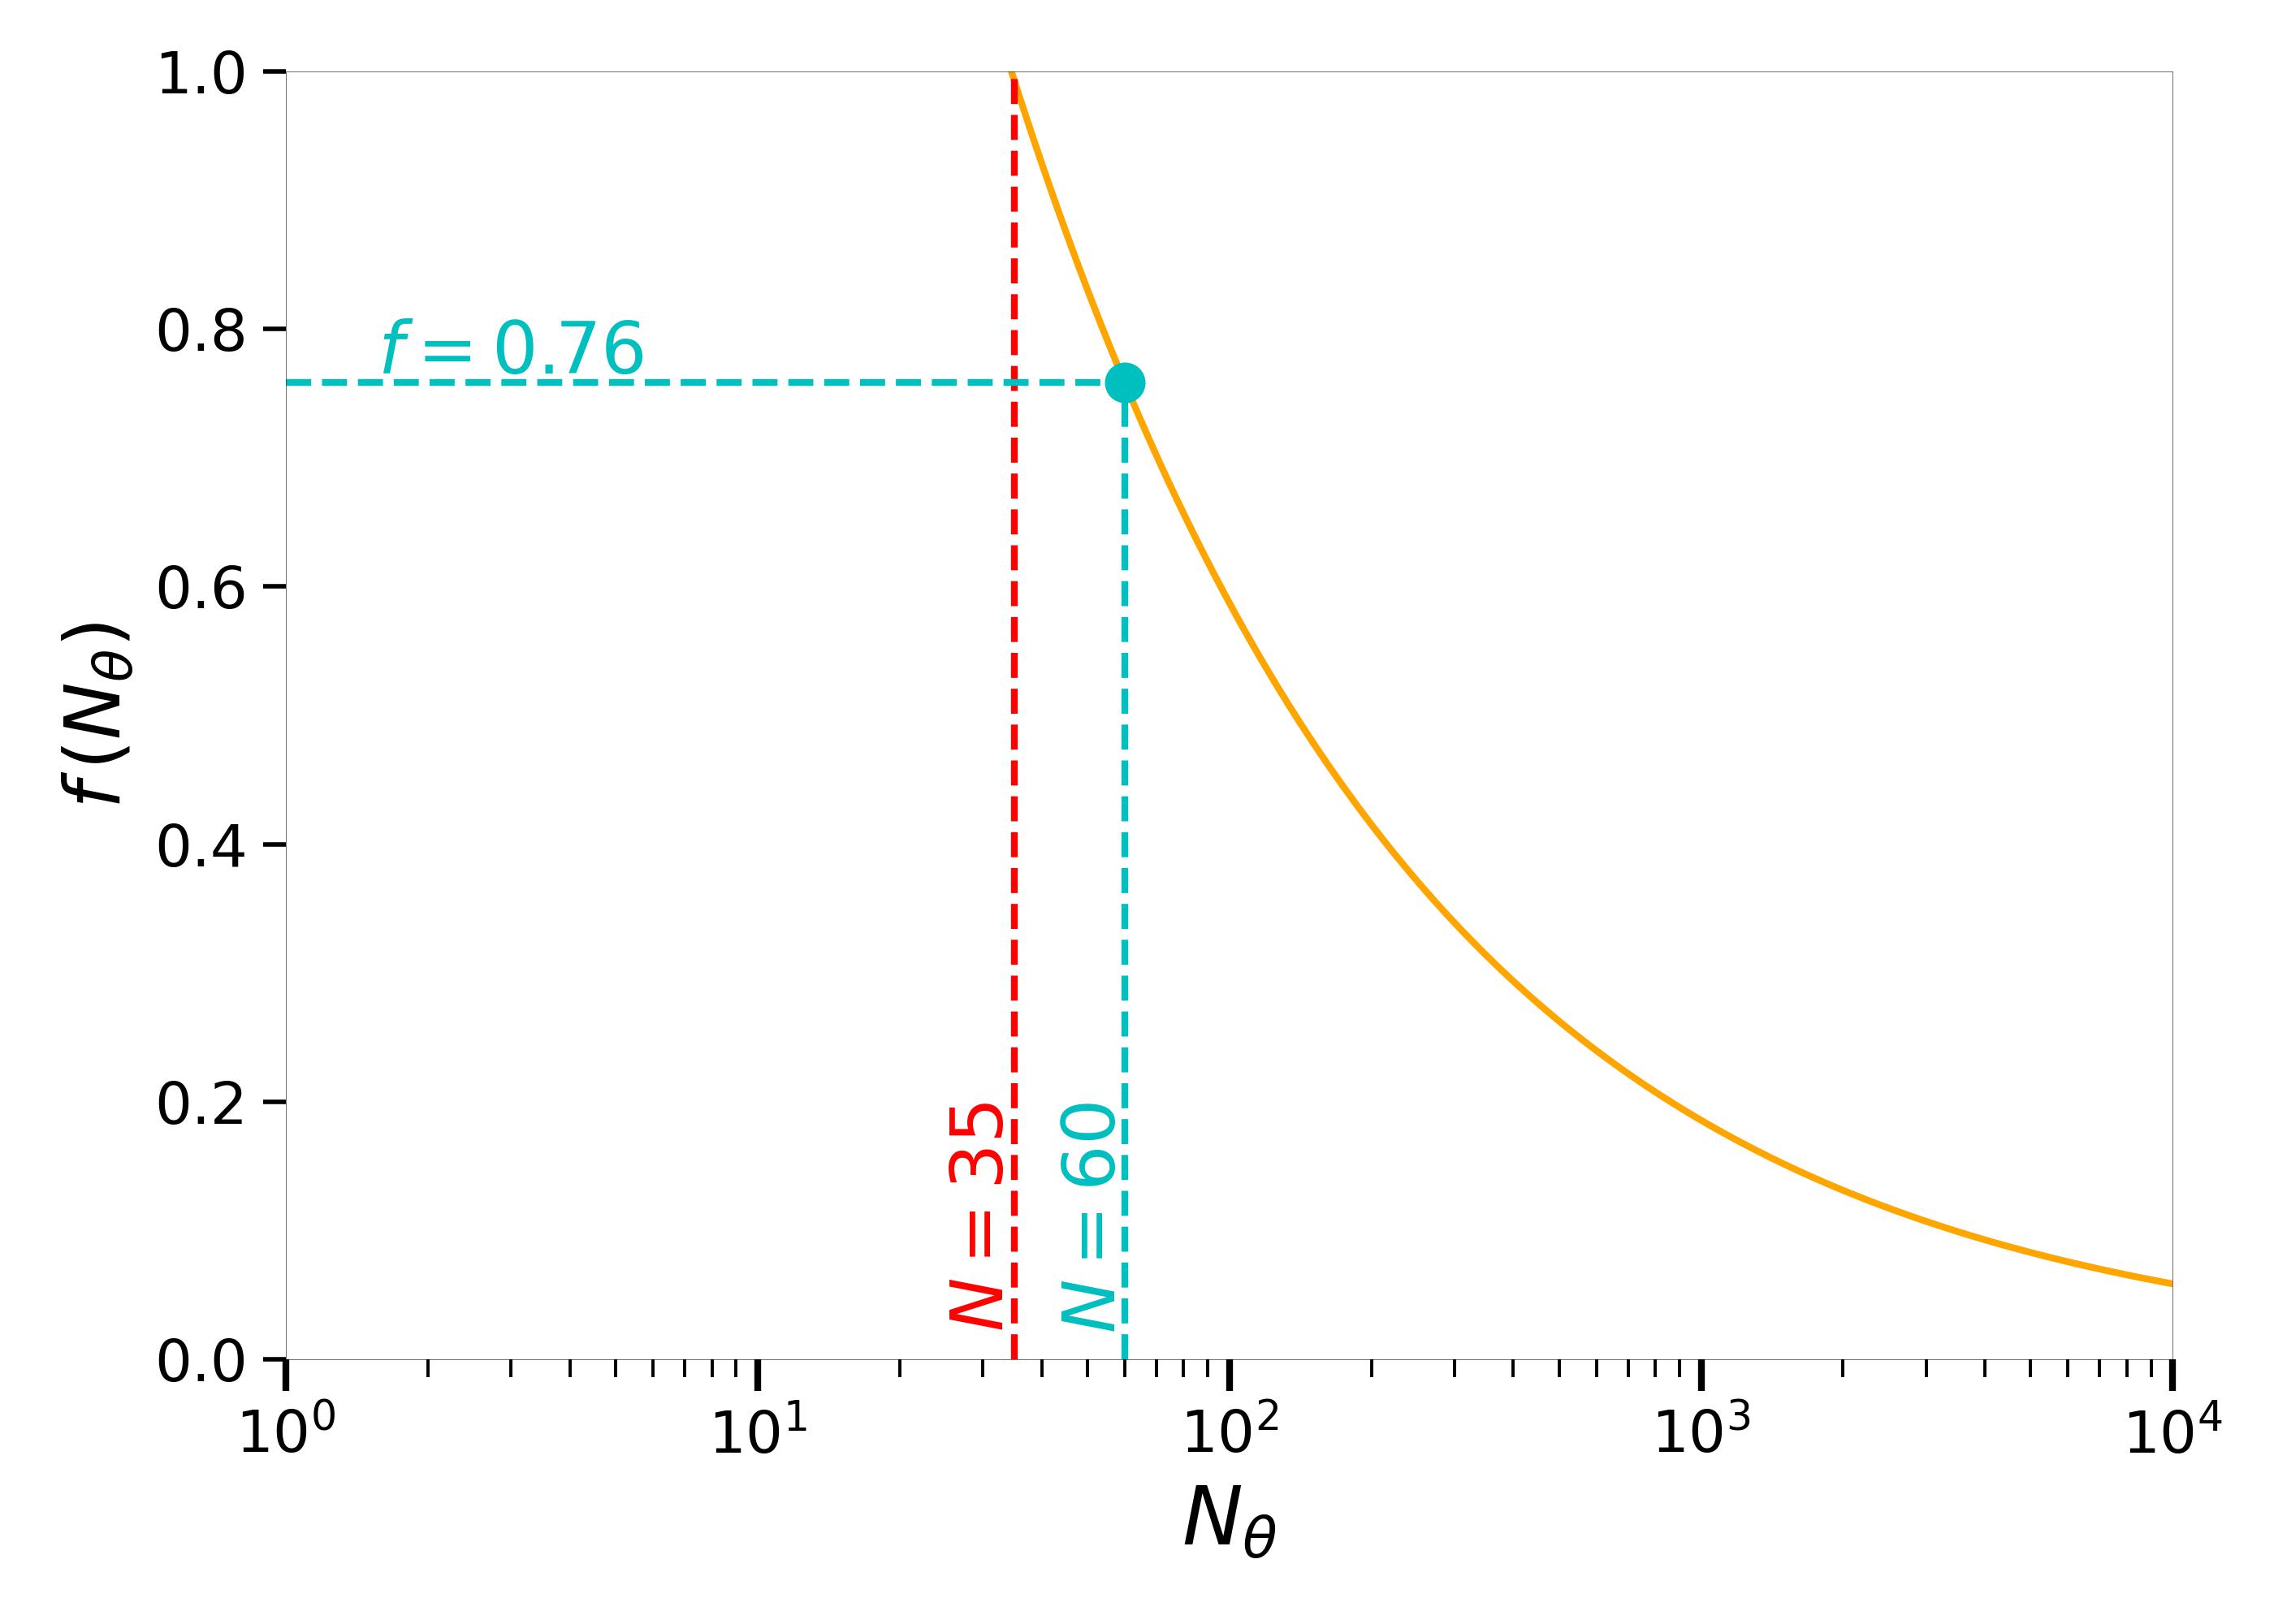
We can then apply this framework to observational data. For instance, Kong et al. (2019) report OFA measurements for approximately outflows, finding a distribution clearly dominated by perpendicular alignments. Setting in equation (9), we find that an excess of at least of 3D angles within and is required for the projected CDF to be statistically distinguishable from a random distribution. In the simulation analyzed here, at time Myr, there is a population of filament-associated sinks, of which fall within the range. However, substituting into equation (9), we find that we would need an excess of at least of angles in this range for the distribution of projected 2D angles to be statistically distinguishable from the random distribution. We suggest that this could explain why the cumulative histogram appears indistinguishable from a random distribution. Due to intrinsic noise, we cannot give a statistically significant conclusion for angle samples with , for which it would require that of the angles be between and to obtain a 2D CDF distinguishable from the random distribution. In Figure 14, we show the dependence of on . The dashed red vertical line represents the minimum number of measurements for which a statistically significant conclusion can be drawn. The value of is highlighted in cyan for comparison with Kong et al. (2019).
VI Caveats
Three main limitations of the present study should be acknowledged, which also point toward promising directions for future work. First, the numerical resolution of the simulation remains well above disk and protostellar scales. Consequently, the results presented here should be interpreted primarily in the context of large-scale filament dynamics, with sink particles more closely representing dense cores rather than individual protostars or disks. This limitation is also reflected in the adopted sink-merging criterion, which is required to maintain a feasible computational time step. Extending this analysis to higher-resolution simulations, capable of resolving smaller spatial scales and mitigating the impact of sink merging, constitutes a natural and necessary next step. This is currently a work in progress.
Second, the simulation does not include magnetic fields, which have been shown in previous studies to play an important role in establishing preferred outflow-filament alignments (Cortes et al., 2006; Matsumoto et al., 2006; Beuther et al., 2010; Hull et al., 2014; Lee et al., 2017; Galametz et al., 2018, 2020; Commerçon et al., 2022; Encalada et al., 2024; Huang et al., 2024). While the present work isolates the role of gravity and filament dynamics, the inclusion of magnetic fields represents a key extension that will allow a more comprehensive assessment of the physical mechanisms governing alignment. In addition, exploring the role of turbulence may help clarify how this ingredient either promote or suppress specific alignment distributions. Addressing these aspects in future studies will be essential for building a more complete and physically robust picture of outflow-filament alignment.
Finally, the inclusion of stellar feedback is expected to hinder the formation and long-term maintenance of longitudinal accretion flows, potentially limiting their ability to redistribute angular momentum efficiently. Under such conditions, it becomes less straightforward to assess whether the angular momentum reorientation timescales of the sinks are sufficiently short to operate before feedback disrupts the accretion flows. As we incorporate feedback processes into our simulations, we aim to examine this interplay in greater detail in future work.
VII Conclusions
We analyzed filaments in a simulation of molecular cloud formation in a warm, neutral medium, including decaying turbulence, gravity, cooling and heating, and sink formation. The 3D and projected 2D angles between sink angular momentum and filament orientation were measured over Myr, considering the full sink sample and those sinks formed in two individual filaments with distinct dynamics. We further examined the relation between predominantly perpendicular alignment and the development of longitudinal flows, the reorientation times of sink subsamples, and the fraction of 3D perpendicular angles required to distinguish a perpendicular distribution from a random one in 2D cumulative histograms.
Our conclusions can be summarized as follows:
-
•
During the first Myr after the formation of the first sink, the 3D distributions of angles between sink angular momentum and the local filament direction are consistent with randomness, showing no preferential orientation. At later times, a clear excess of angles closer to emerges in both the angle and its cosine, indicating a transition from an initially random configuration to a predominantly perpendicular alignment.
-
•
The evolution of the 2D angle distribution, projected onto the three coordinate planes, remained consistent with randomness throughout the analyzed period. Although an excess of 3D angles in the range is apparent in the cosine distribution, it is insufficient to distinguish the distribution from random in 2D cumulative histograms. Additionally, a sample-size-dependent relation was derived to quantify the minimum fraction of angles required for a perpendicular excess to be statistically detectable in 2D projections.
-
•
Tracking randomly selected sinks that survive nearly the entire simulation shows that during the first Myr, angles between their angular momentum and filament direction fluctuate randomly, this time being consistent with the timescales of mass accumulation and longitudinal filament collapse. At later times, these angles begin to oscillate toward values closer to , indicating a gradual shift toward perpendicular alignment.
-
•
Analysis of the orientation of SPH particle velocity vectors relative to the filament spine shows that at late times, when gravity likely dominates the dynamics of dense regions, an excess of angles near zero emerges, indicating velocities aligned with the filament axis. This suggests the development of longitudinal flows, coinciding with the appearance of a predominantly perpendicular distribution of angles between sink angular momentum and the filament axis.
-
•
The study of two individual filaments indicates that convergent flows toward the density peak are associated with a predominantly perpendicular distribution of angles between sink angular momentum and the filament axis, whereas weak or absent flows correspond to a more random distribution. Additionally, the occurrence of a predominantly parallel angle distribution in regions with unidirectional (non-convergent) flows warrants further investigation to clarify any potential connection.
-
•
Individual sink tracking indicates that the emergence of a predominantly perpendicular angle distribution arises from reorientation rather than from sinks forming initially with such orientations, implying a potentially long-term effect that could be incompatible with typical outflow lifetimes. However, due to the simulation’s sink merging criterion, sinks forming with near in regions already dominated by gravity may be undercounted, as they merge rapidly. Indeed, sinks that reorient to predominantly do so later in the simulation, coinciding with the development of longitudinal flows, yet they also have short lifetimes before merging. Reorientations can occur as quickly as Myr, suggesting that once gravity dominates filament dynamics, perpendicular orientations can emerge within timescales compatible with outflow lifetimes.
UA HPC;
References
- Filament Rotation in the California L1482 Cloud. ApJ 908 (1), pp. 86. External Links: Document, 2010.11211 Cited by: §I.
- The direction of outflows from filaments: constraints on core formation. A&A 487 (2), pp. 605–610. External Links: Document, 0806.0486 Cited by: Figure 1, §I, §I, §I, §III.2, §IV.1.1, §V.1.
- An ALMA study of hub-filament systems - I. On the clump mass concentration within the most massive cores. MNRAS 508 (2), pp. 2964–2978. External Links: Document, 2109.07489 Cited by: §I.
- From Filamentary Networks to Dense Cores in Molecular Clouds: Toward a New Paradigm for Star Formation. In Protostars and Planets VI, H. Beuther, R. S. Klessen, C. P. Dullemond, and T. Henning (Eds.), pp. 27–51. External Links: Document, 1312.6232 Cited by: §I.
- From filamentary clouds to prestellar cores to the stellar IMF: Initial highlights from the Herschel Gould Belt Survey. A&A 518, pp. L102. External Links: Document, 1005.2618 Cited by: §I.
- Molecular Outflows in Low- and High-Mass Star-forming Regions. In Protostars and Planets V, B. Reipurth, D. Jewitt, and K. Keil (Eds.), pp. 245. External Links: Document, astro-ph/0603071 Cited by: §I.
- On the structure of molecular clouds. MNRAS 427 (3), pp. 2562–2571. External Links: Document, 1209.3346 Cited by: §I.
- Filamentary Structure in the Orion Molecular Cloud. ApJ 312, pp. L45. External Links: Document Cited by: §I.
- Protostellar Outflows. ARA&A 54, pp. 491–528. External Links: Document Cited by: §V.1.
- Supersonic turbulence, filamentary accretion and the rapid assembly of massive stars and discs. MNRAS 373 (3), pp. 1091–1106. External Links: Document, astro-ph/0609428 Cited by: Figure 1, §I.
- The formation of a star cluster: predicting the properties of stars and brown dwarfs. MNRAS 339 (3), pp. 577–599. External Links: Document, astro-ph/0212380 Cited by: §II.
- ALMA Observations Reveal No Preferred Outflow-filament and Outflow-magnetic Field Orientations in Protoclusters. ApJ 890 (1), pp. 44. External Links: Document, 1912.13240 Cited by: §I.
- Magnetic Field Structure in a High-mass Outflow/Disk System. ApJ 724 (1), pp. L113–L117. External Links: Document, 1010.3635 Cited by: §VI.
- Velocity-coherent Filaments in NGC 1333: Evidence for Accretion Flow?. ApJ 891 (1), pp. 84. External Links: Document, 2002.11736 Cited by: §I.
- Graph-based interpretation of the molecular interstellar medium segmentation. MNRAS 454 (2), pp. 2067–2091. External Links: Document, 1510.04253 Cited by: §I.
- Discs and outflows in the early phases of massive star formation: Influence of magnetic fields and ambipolar diffusion. A&A 658, pp. A52. External Links: Document, 2109.10580 Cited by: §VI.
- Interferometric Mapping of Magnetic Fields: NGC 2071IR. ApJ 650 (1), pp. 246–251. External Links: Document, astro-ph/0607356 Cited by: §VI.
- Magnetic Fields Observed along the East–West Outflow of IRAS 16293-2422. ApJ 968 (2), pp. 101. External Links: Document, 2405.08118 Cited by: §VI.
- The CARMA-NRO Orion Survey: Protostellar Outflows, Energetics, and Filamentary Alignment. ApJ 896 (1), pp. 11. External Links: Document, 2004.03504 Cited by: §I.
- Comparing the statistics of interstellar turbulence in simulations and observations. Solenoidal versus compressive turbulence forcing. A&A 512, pp. A81. External Links: Document, 0905.1060 Cited by: §II.
- An observational correlation between magnetic field, angular momentum and fragmentation in the envelopes of Class 0 protostars?. A&A 644, pp. A47. External Links: Document, 2010.12466 Cited by: §VI.
- SMA observations of polarized dust emission in solar-type Class 0 protostars: Magnetic field properties at envelope scales. A&A 616, pp. A139. External Links: Document, 1804.05801 Cited by: §VI.
- Filaments in Simulations of Molecular Cloud Formation. ApJ 791 (2), pp. 124. External Links: Document, 1308.6298 Cited by: §I, §I, §IV.2.1.
- Why Are (Almost) All the Protostellar Outflows Aligned in Serpens Main?. ApJ 972 (1), pp. 5. External Links: Document, 2406.13084 Cited by: §I.
- The Musca cloud: A 6 pc-long velocity-coherent, sonic filament. A&A 587, pp. A97. External Links: Document, 1511.06370 Cited by: §I.
- An ALMA study of the Orion Integral Filament. I. Evidence for narrow fibers in a massive cloud. A&A 610, pp. A77. External Links: Document, 1801.01500 Cited by: §I.
- Cores, filaments, and bundles: hierarchical core formation in the L1495/B213 Taurus region. A&A 554, pp. A55. External Links: Document, 1303.2118 Cited by: §I.
- Sarracen: a Python package for analysis and visualization of smoothed particle hydrodynamics data. The Journal of Open Source Software 8 (86), pp. 5263. External Links: Document Cited by: Effect of gravity-driven longitudinal flows in filaments on angular momentum transport to embedded cores.
- Rotating Filament in Orion B: Do Cores Inherit Their Angular Momentum from Their Parent Filament?. ApJ 908 (1), pp. 92. External Links: Document, 2012.02442 Cited by: §I.
- On the Magnetic Field Properties of Protostellar Envelopes in Orion. ApJ 963 (1), pp. L31. External Links: Document, 2402.07267 Cited by: §VI.
- TADPOL: A 1.3 mm Survey of Dust Polarization in Star-forming Cores and Regions. ApJS 213 (1), pp. 13. External Links: Document, 1310.6653 Cited by: §VI.
- Matplotlib: A 2D Graphics Environment. Computing in Science and Engineering 9, pp. 90–95. External Links: Document Cited by: Effect of gravity-driven longitudinal flows in filaments on angular momentum transport to embedded cores.
- Filamentary Accretion Flows in the Embedded Serpens South Protocluster. ApJ 766 (2), pp. 115. External Links: Document, 1301.6792 Cited by: §I.
- Widespread Molecular Outflows in the Infrared Dark Cloud G28.37+0.07: Indications of Orthogonal Outflow-filament Alignment. ApJ 874 (1), pp. 104. External Links: Document, 1903.05273 Cited by: §I, Figure 14, §V.2.
- An Origin of Supersonic Motions in Interstellar Clouds. ApJ 564 (2), pp. L97–L100. External Links: Document, astro-ph/0112420 Cited by: §II.
- The Origins of Protostellar Core Angular Momenta. ApJ 876 (1), pp. 33. External Links: Document, 1903.09612 Cited by: §I.
- Synthetic Observations of Magnetic Fields in Protostellar Cores. ApJ 834 (2), pp. 201. External Links: Document, 1611.08530 Cited by: §VI.
- Alignment of Outflows with Magnetic Fields in Cloud Cores. ApJ 637 (2), pp. L105–L108. External Links: Document, astro-ph/0512581 Cited by: §VI.
- Plonk: Smoothed particle hydrodynamics analysis and visualization with Python. The Journal of Open Source Software 4 (44), pp. 1884. External Links: Document Cited by: Effect of gravity-driven longitudinal flows in filaments on angular momentum transport to embedded cores.
- Evolution of the Angular Momentum of Molecular Cloud Cores in Magnetized Molecular Filaments. arXiv e-prints, pp. arXiv:2312.16920. External Links: Document, 2312.16920 Cited by: §I.
- An Origin for the Angular Momentum of Molecular Cloud Cores: A Prediction from Filament Fragmentation. ApJ 881 (1), pp. 11. External Links: Document, 1905.08071 Cited by: §I.
- Evolution of the Angular Momentum of Molecular Cloud Cores Formed from Filament Fragmentation. ApJ 943 (2), pp. 76. External Links: Document, 2212.02070 Cited by: §I.
- Clouds, filaments, and protostars: The Herschel Hi-GAL Milky Way. A&A 518, pp. L100. External Links: Document, 1005.3317 Cited by: §I.
- Filamentary Structure of Star-forming Complexes. ApJ 700 (2), pp. 1609–1625. External Links: Document, 0906.2005 Cited by: §I.
- Herschel view of the Taurus B211/3 filament and striations: evidence of filamentary growth?. A&A 550, pp. A38. External Links: Document, 1211.6360 Cited by: §I.
- Scikit-learn: machine learning in Python. Journal of Machine Learning Research 12, pp. 2825–2830. Cited by: Effect of gravity-driven longitudinal flows in filaments on angular momentum transport to embedded cores.
- SDC13 infrared dark clouds: Longitudinally collapsing filaments?. A&A 561, pp. A83. External Links: Document, 1311.0203 Cited by: §I, §V.1.
- Planck intermediate results. XXXIII. Signature of the magnetic field geometry of interstellar filaments in dust polarization maps. A&A 586, pp. A136. External Links: Document, 1411.2271 Cited by: §I.
- A comparison between grid and particle methods on the statistics of driven, supersonic, isothermal turbulence. MNRAS 406 (3), pp. 1659–1674. External Links: Document, 1004.1446 Cited by: §II.
- Phantom: A Smoothed Particle Hydrodynamics and Magnetohydrodynamics Code for Astrophysics. PASA 35, pp. e031. External Links: Document, 1702.03930 Cited by: §II, Effect of gravity-driven longitudinal flows in filaments on angular momentum transport to embedded cores.
- splash: An Interactive Visualisation Tool for Smoothed Particle Hydrodynamics Simulations. PASA 24 (3), pp. 159–173. External Links: Document, 0709.0832 Cited by: §III.1.
- The Giant Molecular Cloud G148.24+00.41: gas properties, kinematics, and cluster formation at the nexus of filamentary flows. MNRAS 528 (2), pp. 2199–2219. External Links: Document, 2401.03202 Cited by: §I.
- Convergent filaments contracting towards an intermediate-mass pre-stellar core. MNRAS 505 (4), pp. 5183–5191. External Links: Document, 2105.04116 Cited by: §I.
- APLpy: Astronomical Plotting Library in Python. Note: Astrophysics Source Code Library External Links: 1208.017 Cited by: Effect of gravity-driven longitudinal flows in filaments on angular momentum transport to embedded cores.
- ALMA-IMF. XXI.: N2H+ kinematics in the G012.80 protocluster: Evidence for filament rotation and evolution. arXiv e-prints, pp. arXiv:2510.03447. External Links: Document, 2510.03447 Cited by: §I.
- A catalog of dark globular filaments.. ApJS 41, pp. 87–95. External Links: Document Cited by: §I.
- Table for Estimating the Goodness of Fit of Empirical Distributions. The Annals of Mathematical Statistics 19 (2), pp. 279 – 281. External Links: Document, Link Cited by: §V.2.
- The persistent cosmic web and its filamentary structure - I. Theory and implementation. MNRAS 414 (1), pp. 350–383. External Links: Document, 1009.4015 Cited by: §III.1.
- Alignment between Protostellar Outflows and Filamentary Structure. ApJ 846 (1), pp. 16. External Links: Document, 1707.08122 Cited by: §I, §IV.1.1, §V.2.
- Dynamics of cluster-forming hub-filament systems. The case of the high-mass star-forming complex Monoceros R2. A&A 629, pp. A81. External Links: Document, 1907.03524 Cited by: §V.1.
- A comparison between grid and particle methods on the small-scale dynamo in magnetized supersonic turbulence. MNRAS 461 (2), pp. 1260–1275. External Links: Document, 1605.08662 Cited by: §II.
- Is the dust-to-gas ratio constant in molecular clouds?. MNRAS 471 (1), pp. L52–L56. External Links: Document, 1706.05107 Cited by: §II.
- Formation and early evolution of circumstellar discs in turbulent molecular cloud cores. MNRAS 428 (2), pp. 1321–1334. External Links: Document, 1210.0526 Cited by: §I, §III.2.
- Empirical processes. In Asymptotic Statistics, Cambridge Series in Statistical and Probabilistic Mathematics, pp. 265–290. Cited by: §V.2.
- The numpy array: a structure for efficient numerical computation. Computing in Science & Engineering 13 (2), pp. 22–30. External Links: Document, http://aip.scitation.org/doi/pdf/10.1109/MCSE.2011.37, Link Cited by: Effect of gravity-driven longitudinal flows in filaments on angular momentum transport to embedded cores.
- Molecular Cloud Evolution. II. From Cloud Formation to the Early Stages of Star Formation in Decaying Conditions. ApJ 657 (2), pp. 870–883. External Links: Document, astro-ph/0608375 Cited by: §II.
- Global hierarchical collapse in molecular clouds. Towards a comprehensive scenario. MNRAS 490 (3), pp. 3061–3097. External Links: Document, 1903.11247 Cited by: §I.
- SciPy 1.0: Fundamental Algorithms for Scientific Computing in Python. Nature Methods 17, pp. 261–272. External Links: Document Cited by: Effect of gravity-driven longitudinal flows in filaments on angular momentum transport to embedded cores.
- Direct Observational Evidence of the Multi-scale, Dynamical Mass Accretion Toward a High-mass Star-forming Hub-filament System. ApJ 953 (1), pp. 40. External Links: Document, 2306.10332 Cited by: §I.
- Edge collapse and subsequent longitudinal accretion in filament S242. A&A 637, pp. A67. External Links: Document, 2004.04886 Cited by: §V.1.