Causal Analysis of Author Demographics in Academic Peer Review
Abstract
Academic meritocracy is jeopardized by systematic imbalances; for example, whereas Black and Hispanic individuals constitute over 30% of the U.S. population, they represent fewer than 10% of tenured academics in science and engineering. Peer review serves as a crucial gatekeeper in this process, however it encounters ongoing issues over biases that may hinder scientific advancement. The issue is now exacerbated by the growing influence of artificial intelligence (AI) in academic assessment. This paper transcends correlation to quantitatively assess the independent impacts of author demographics, including race, gender, and country of affiliation, on paper acceptance rankings. We utilize a causal inference methodology on a dataset of 530 papers, simulating the academic selection process by employing the prestige of the publication venue as a surrogate for review rank. Our research indicates statistically substantial causal disadvantages for authors from minority racial groups (average treatment effects [ATE]: -0.42 points in ranking), female authors (ATE: -0.25), and those associated with institutions in the Global South (ATE: -0.57). The exhibited biases emphasize the pressing necessity for fairness interventions in both conventional and AI-based review processes, indicating that such measures are essential for establishing a more equitable and credible scientific environment.
I Introduction
The principle of meritocracy is fundamental to academic research. Ideally, a scientific contribution should be judged solely on its quality, rigor, and novelty. However, a growing body of evidence suggests that the peer-review process, the primary mechanism for scientific gatekeeping, is susceptible to demographic biases [40, 41, 42, 22]. An author’s perceived race, gender, or geographic origin can unconsciously influence reviewer assessments, potentially hindering the dissemination of valuable research from underrepresented groups [12, 19, 47, 10]. The integrity of the scientific record itself is jeopardized if systemic biases influence which research is amplified and whose contributions are overlooked.
Concerns about demographic bias are well-documented across disciplines. Studies have reported disparities based on gender, race, and geographical affiliation [38, 32, 3, 29]. While some large-scale studies report mixed evidence, the persistence of disparities in representation suggests that biases may operate in subtle ways. Furthermore, many existing studies rely on observational data and report correlations, which, while indicative of potential issues, do not definitively establish a causal link. The Fairness, Accountability, and Transparency (FAccT) community has increasingly emphasized the need for rigorous methods to understand and address such issues in critical socio-technical systems like academic publishing [20]. This study contributes to this body of work by employing causal inference techniques to move beyond association and estimate the direct causal impact of author demographics on paper acceptance.
Prior work, Fair-PaperRec [30], recognized that traditional peer review processes, despite mechanisms like double-blind review, often fail to eradicate systemic biases. It is a Multi-Layer Perceptron (MLP) based model that reframes paper selection as a recommendation problem and explicitly penalizes demographic disparities using a customized fairness loss function. While initial evaluations were encouraging, the work acknowledged a key limitation: it lacked explicit causal modeling, which could enhance bias reduction. This paper directly addresses that gap.
The primary objective of this research is twofold. First, we investigate the independent causal effects of author race, gender, and country of institutional affiliation on paper acceptance rankings, controlling for proxies of paper quality and institutional prestige. Second, we use this same causal framework to robustly evaluate how Fair-PaperRec mitigates these causally identified biases. Our core contributions are:
-
•
The formalization of demographic bias in peer review within a causal inference framework, specifying treatments, outcomes, confounders, and a clear identification strategy.
-
•
The application of Inverse Propensity Weighting (IPW) to a novel dataset of 530 papers from conferences to estimate the ATEs of author demographics on acceptance ratings.
-
•
Quantitative evidence of statistically significant causal biases that disadvantage authors from minority racial groups, female authors, and authors from the Global South.
-
•
A causal evaluation of a fairness-aware intervention (Fair-PaperRec), demonstrating that it successfully eliminates these biases while simultaneously enhancing the overall quality Normalized Discounted Cumulative Gain (NDCG) of recommended papers.
The remainder of this paper is organized as follows: Section II reviews empirical evidence of demographic bias in peer review, the application of causal inference for fairness assessment, and prior fairness-aware interventions. Section III details our methodology, including problem formalization, variable definitions, dataset construction, causal estimation procedures, and the design of the Fair-PaperRec intervention. Section IV presents the evaluation and experimental results, addressing our core research questions. Section V provides a detailed discussion of the findings, their implications, and limitations. Finally, Section VI concludes the paper and outlines directions for future research.
II Related Work
This section surveys empirical evidence of demographic bias in peer review, highlights the role of causal inference in fairness assessment, and positions our work at the intersection of diagnosis and intervention by applying causal methods to evaluate and mitigate bias in academic paper recommendation.
II-A Empirical Evidence of Bias in Academic Peer Review
The study of bias in academic peer review has followed two complementary lines of inquiry. The first focuses on documenting disparities through empirical and meta-scientific studies. The second explores computational interventions to mitigate such disparities.
Gender Bias. A large body of literature highlights gender disparities in academic publishing. Studies have documented the underrepresentation of women as authors and editors, differences in citation rates, and systemic barriers to participation [12, 4]. Some large-scale analyses suggest that manuscripts authored by women are not penalized during peer review per se, but submission rates remain lower, potentially due to self-censorship or anticipatory over-preparation in response to perceived bias [38].
Racial and Ethnic Bias. Research shows that racial and ethnic minorities face systemic disadvantages in scholarly publishing. These include underrepresentation, topic marginalization (e.g., devaluing of “racialized expertise”), and citation disparities [11, 36]. Evidence from the SIGCHI community and others points to implicit racial bias in paper acceptance and evaluation [43]. However, many of these findings rely on correlational data, making it difficult to isolate bias from confounding factors such as institutional prestige.
Geographical Bias. Geographic disparities, particularly between the Global North and South, are well-documented [26]. Authors from the Global South face reduced acceptance rates, lower citation counts, and barriers to participation in global scholarly discourse. These inequalities are compounded by limited access to networks, funding, and institutional visibility.
II-B Causal Inference for Fairness Assessment
To move beyond association and toward explanation, fairness researchers have increasingly adopted tools from causal inference. Causal models allow for formal reasoning about how sensitive attributes influence outcomes—whether directly or indirectly and whether such influence is justifiable. Pioneering work in algorithmic fairness has used structural causal models to distinguish between fair and unfair pathways of influence [31, 20, 48]. Propensity score methods [33] and counterfactual reasoning have further enabled the estimation of ATEs in observational settings, offering a principled way to assess whether a protected attribute causes disparate outcomes.
Despite these advances, few studies have applied causal frameworks to the academic peer review domain. Existing literature largely focuses on observational disparities without formal estimation of causal effects. Our work addresses this gap by applying a rigorous causal inference framework to estimate demographic ATEs and intersectional effects on paper acceptance outcomes. We use inverse propensity weighting to construct balanced comparisons and counterfactual analysis to assess fairness violations.
II-C Fairness-Aware Recommendation and Causal Interventions
Parallel to the fairness diagnosis literature, a second line of work investigates algorithmic interventions to improve equity in peer review. This includes systems for reviewer assignment [6], as well as fairness-aware ranking models that attempt to balance utility and equity [37, 46, 39]. Recent models like Fair-PaperRec [30] incorporate fairness constraints into neural recommendation systems to address demographic disparities in academic paper selection.
However, evaluations of such models typically rely on statistical group-based fairness metrics (e.g., demographic parity, disparate impact). These metrics do not confirm whether the root causal mechanisms driving the disparities have been mitigated. Our work advances this line of research by integrating both diagnosis and evaluation within a unified causal framework. We first identify demographic bias using causal estimators and then apply the same lens to assess whether fairness-aware interventions effectively neutralize that bias.
In doing so, we also empirically examine the often-assumed fairness-utility trade-off: does mitigating causal bias necessarily degrade ranking utility? Our findings show that fairness and utility can coexist, thereby elevating the standard for fairness-aware systems from statistical parity to causal equity.
III Methodology
To assess whether author demographic attributes causally influence paper acceptance rankings, we adopt a causal inference framework grounded in the potential outcomes model. Our methodology includes estimating propensity scores using observed confounders (e.g., h-index and institutional prestige), applying IPW to balance groups, and computing ATE for race, gender, and country. Additionally, we evaluate the effectiveness of Fair-PaperRec, a fairness-aware recommendation model, in mitigating these causal disparities and assess both fairness and utility using standard ranking metrics. Robustness checks are performed to validate the credibility of our causal findings.

III-A Problem Formalization
To rigorously investigate causal effects, we first formalize the problem by defining the variables and dataset used in our causal model. Our primary goal is to determine whether an author’s demographic attributes have a causal influence on their paper’s acceptance ranking, separate from the influence of their academic standing. The analysis aims to answer counterfactual questions such as: “If an author’s race were different, would the probability of their paper being accepted change, assuming all else about the paper remains the same?”. This counterfactual reasoning [21, 27, 48] is central to modern causal inference frameworks [31].
We adopt the potential outcomes framework to estimate the Average Treatment Effect (ATE) [16], which quantifies the causal impact of sensitive attributes on acceptance outcomes while controlling for confounding factors.
III-B Variable Definitions
Outcome Variable (): Paper Acceptance Ranking. This is a numeric variable representing the evaluation received by the paper, where a lower value indicates a less favorable ranking.
Treatment Variables (): Author Demographics. In the causal inference paradigm, these sensitive attributes are treated as exposures or “treatments” whose effects on the outcome we wish to isolate:
-
•
Author Race: Categorized into “Minority Race” (authors identified as Hispanic or Black) and “Majority Race” (authors identified as White or Asian). This follows precedents in large-scale equity analyses based on U.S. census groupings [11].
- •
-
•
Author Country of Affiliation: Categorized as “Global North” versus “Global South”. For this study, this distinction is operationalized using the classification of developed and developing regions from the United Nations M49 standard [44].
Quality Proxy (): Maximum h-index. The maximum h-index [14] among a paper’s co-authors is used as a proxy for paper quality. While widely adopted, the h-index has limitations including field dependence and citation inequality [45].
Confounder (): Institutional Affiliation. Institutional prestige is measured via external rankings or Carnegie classifications [5]. As prior work shows [43], perceived institutional reputation can influence reviewer decisions. Controlling for this confounder helps isolate the direct effect of demographic attributes.
III-C Dataset Description
To simulate a realistic paper selection scenario, we constructed a dataset of 530 papers sourced from three prominent Human-Computer Interaction (HCI) conferences: SIGCHI, DIS, and IUI [1]. Each paper includes the features defined above. To establish a ground truth for the Paper Acceptance Ranking (Y), we leverage the established prestige of these venues to create a tiered ordinal outcome: papers from the top-tier SIGCHI are labeled as “highly accepted” (Rank 3), those from DIS as “conditionally accepted” (Rank 2), and those from IUI as “rejected” (Rank 1). This framework allows us to evaluate a model’s ability to identify high-quality papers from a heterogeneous pool.
III-D Statistical Estimation
The estimation of causal effects from observational data proceeds through several methodological steps, grounded in the potential outcomes framework.
III-D1 Propensity Score Estimation
For each demographic attribute considered as a “treatment,” we estimate the propensity score, defined as the conditional probability of receiving treatment given the observed covariates:
Here, represents a binary treatment variable (e.g., race or gender), is a quality proxy such as h-index, and is a vector of additional covariates such as institutional prestige or co-author count. The propensity score is used to balance the covariates between treated and control groups, mimicking the conditions of a randomized controlled trial [33]. .
We employ logistic regression to model these probabilities. For each demographic variable , a separate model is fitted:
| (1) |
where is the log-odds function, and are the coefficients learned during model training.
The quality of the propensity score model is critical, as it determines how effectively we can achieve covariate balance in subsequent steps of the causal analysis.
III-D2 Inverse Propensity Weighting (IPW)
IPW is a technique used to create a pseudopopulation where confounders are distributed independently of treatment status [13]. Each paper in the dataset is assigned a weight equal to the inverse of its probability of receiving the treatment it actually received. For treated units, , and for control units, . This method, a variation of the Horvitz–Thompson estimator [15], up-weights individuals who were less likely to receive the treatment they did, thereby balancing the covariate distributions across groups.
To improve the stability of the estimator, we use stabilized weights, which reduce the variance associated with extreme propensity scores [13]. The success of IPW is assessed by examining covariate balance using Standardized Mean Differences (SMDs). An SMD below the threshold of 0.1 indicates adequate balance [2].
III-D3 Average Treatment Effect (ATE) Estimation
After achieving covariate balance using IPW, we estimate the Average Treatment Effect (ATE) as the difference in the weighted means of the outcome variable (e.g., acceptance ranking) between the treated and control groups [13]:
| (2) |
where, is the treatment indicator for the unit (e.g., if the author belongs to the demographic group of interest, such as minority authors, and otherwise). is the outcome variable for unit (here, the paper’s acceptance ranking). is the inverse propensity weight assigned to unit , based on how likely they were to receive the treatment given their covariates. The first term is the weighted average outcome for the treated group (), and the second term is the weighted average outcome for the control group ().
A positive ATE implies that, on average, the treated group (e.g., minority authors) received worse rankings (higher numeric values) than the control group, suggesting a causal disadvantage.
III-E Intervention and Evaluation Strategy
To evaluate a practical intervention against the biases we identified, we test the Fair-PaperRec model [30]. This model is a MLP trained to predict paper acceptance. Its key feature is a composite loss function designed to balance predictive accuracy with demographic fairness.
The model is trained by optimizing a total loss function, , which combines a standard prediction loss (, e.g., binary cross entropy) with a tunable fairness loss (), balanced by a hyperparameter :
| (3) |
The fairness loss is designed to enforce demographic parity across multiple sensitive attributes simultaneously. It is defined as a weighted sum of the squared statistical parity differences for race and country:
| (4) |
Here, denotes the predicted acceptance score for paper . and are the sets of papers authored by members of protected groups for race and country, respectively. and represent the number of such papers in each group, and is the total number of papers. The expressions in parentheses compute the squared difference between each group’s average prediction and the global average prediction—capturing the extent to which each group is treated differently by the model. The weights and control the relative importance of enforcing fairness across race and country. These are the critical parameters explored in our ablation study.
Utility: We use NDCG, a standard information retrieval metric for evaluating the quality of ranked recommendations [17].
Fairness: We measure demographic parity through rank gaps and group-level acceptance rate differences. This operationalizes the principle of fairness through independence which states that decisions should not vary based on the protected attributes [9].
III-F Statistical Significance and Robustness Checks
We assess statistical significance by calculating 95% confidence intervals using non-parametric bootstrapping. While not implemented in this paper, future work may use Rosenbaum bounds to assess sensitivity to unmeasured confounding [34].
IV Evaluation and Experiments
This section presents the empirical findings of our study. We begin by detailing the dataset and validating our causal methodology through covariate balance checks. We then present the results of the causal analysis, quantifying demographic biases in the baseline data. Finally, we provide a comprehensive causal evaluation of the Fair-PaperRec intervention. To guide our analysis, we ask the following research questions:
-
•
RQ1: To what extent do author demographics have a causal effect on paper acceptance rankings in academic peer review?
-
•
RQ2: How do these causal biases manifest for different subgroups of authors?
-
•
RQ3: Can a fairness-aware intervention both mitigate these identified causal biases and maintain or improve the overall quality of selected papers?
| Characteristic | Category / Statistic | Value |
|---|---|---|
| Conference Distribution | SIGCHI | 323 (61.1%) |
| DIS | 133 (25.1%) | |
| IUI | 73 (13.8%) | |
| Author Race | Majority | 80.3% |
| Minority | 19.7% | |
| Author Gender | Male | 52.7% |
| Female | 47.3% | |
| Country of Affiliation | Developed | 74.7% |
| Underdeveloped | 25.3% | |
| Max h-index (Quality Proxy) | Mean (SD) | 27.55 (14.47) |
| Median (IQR) | 24.5 (13.6) | |
| Range | 0–135 | |
| Paper Acceptance Ranking | Mean (SD) | 2.47 (0.73) |
| Median (IQR) | 3.0 (1.0) | |
| Range | 1–3 |
IV-A Data Overview and Methodology Validation
Our analysis is based on a dataset of 530 papers from the SIGCHI, DIS, and IUI conferences. The characteristics of this corpus, including the distribution of author demographics and paper attributes, are detailed in Table I. As shown, the dataset reflects known distributions in academic publishing, with a majority of authors being male and affiliated with institutions in developed nations.
| Comparison | Covariate | Group 1 Mean (Pre) | Group 0 Mean (Pre) | SMD (Pre) | Group 1 Mean (Post) | Group 0 Mean (Post) | SMD (Post) |
|---|---|---|---|---|---|---|---|
| Race (Minority vs. Majority) | Max h-index | 18.5 | 28.2 | 0.45 | 24.1 | 24.5 | 0.02 |
| % Top-Ranked Institution | 30% | 45% | 0.31 | 38% | 39% | 0.01 | |
| Gender (Female vs. Male) | Max h-index | 22.1 | 26.5 | 0.20 | 24.8 | 24.6 | -0.01 |
| % Top-Ranked Institution | 38% | 41% | 0.06 | 40% | 40% | 0.00 | |
| Country (Global South vs. North) | Max h-index | 15.3 | 27.8 | 0.68 | 23.5 | 23.9 | 0.03 |
| % Top-Ranked Institution | 15% | 48% | 0.70 | 35% | 36% | 0.01 |
A critical prerequisite for valid causal inference from such observational data is achieving covariate balance between treatment and control groups. Without it, any observed differences in outcomes could be attributed to confounding factors (e.g., authors from the Global North having higher h-indexes) rather than direct bias. To address this, we employed IPW to construct pseudopopulations where observed confounders are balanced. Table II summarizes the effectiveness of this procedure. Before weighting, significant imbalances existed; for instance, the Standardized Mean Difference (SMD) for institutional prestige between authors from the Global South and North was 0.70. After applying IPW, all SMDs were reduced to well below the conventional 0.1 threshold. This successful balancing establishes a valid foundation for our subsequent causal estimation.

IV-A1 Baseline Disparities
To motivate our causal questions, we first examined the baseline relationships in the data. While a paper’s quality proxy (maximum author h-index) is positively correlated with acceptance likelihood (, ), this trend is not consistent across demographic groups. As illustrated in Figure 2, the acceptance probability for minority authors is consistently lower than for majority authors at nearly every equivalent level of h-index. This disparity is substantial in practical terms. In a simulated selection, the average rank for papers authored by the majority group was 213.6, compared to 475.1 for the minority group, yielding an enormous rank gap of 261.5 positions. This observation strongly suggests the presence of systemic bias not explained by the h-index alone, thus necessitating a formal causal analysis.
| Demo. | Treat. | Comp. | ATE | 95% CI | p |
|---|---|---|---|---|---|
| Race | Minority | Majority | +0.42 | (0.18, 0.66) | |
| Gender | Female | Male | +0.25 | (0.03, 0.47) | |
| Country | G. South | G. North | +0.57 | (0.31, 0.83) |
IV-A2 Main and Intersectional Causal Effects (Answering RQ1 & RQ2)
To formally quantify the causal component of these disparities, we estimated the Average Treatment Effect (ATE) of each sensitive attribute. The results are striking: we find strong negative causal effects on the probability of acceptance for both race and gender. In particular, the ATE for Race is approximately , meaning that, on average, a paper is 44.2 percentage points less likely to be accepted if its author(s) are from a minority group, even after controlling for quality and prestige proxies. Similarly, the ATE for gender is about , indicating a substantial causal disadvantage for papers authored by women. In contrast, the country attribute showed a negligible direct causal effect in this specific analysis. The full ATE results and confidence intervals are presented in Table III.
| Metric | Baseline | Fair-PaperRec |
|---|---|---|
| Avg. Rank (Race = 0) | 213.6 | 220.1 |
| Avg. Rank (Race = 1) | 475.1 | 412.6 |
| Rank Gap (Race 1 Race 0) | 261.5 | 192.5 |
| NDCG (Utility) | 0.9628 | 0.9667 |
To answer RQ2, we conducted a deeper analysis of how these biases manifest. A moderated analysis stratified by h-index shows the negative racial bias is most pronounced for authors in the lowest h-index quartile, suggesting that early-career researchers are more vulnerable. Furthermore, an intersectional investigation reveals that biases are not simply additive. As detailed in Figure 3, the causal disadvantage for Minority Male authors (ATE = -0.54 via IPW) is more severe than what would be predicted by summing the independent effects of race and gender. This underscores that biases are intersectional, affecting different subgroups disproportionately and reinforcing the need for interventions that consider these complex interactions.

IV-B Causal Evaluation of the Fair-PaperRec Intervention (RQ3)
Having established the existence and nature of causal biases, we now turn to RQ3 to evaluate whether a computational intervention can effectively and efficiently mitigate them. We conducted a formal causal evaluation of the Fair-PaperRec model [30].
| Demographic Group | ATE (IPW) | ATE (LR) |
|---|---|---|
| Majority, Male | +0.45 | +0.17 |
| Majority, Female | -0.15 | +0.14 |
| Minority, Male | -0.54 | -0.42 |
| Minority, Female | +0.01 | -0.40 |
IV-B1 Bias Mitigation
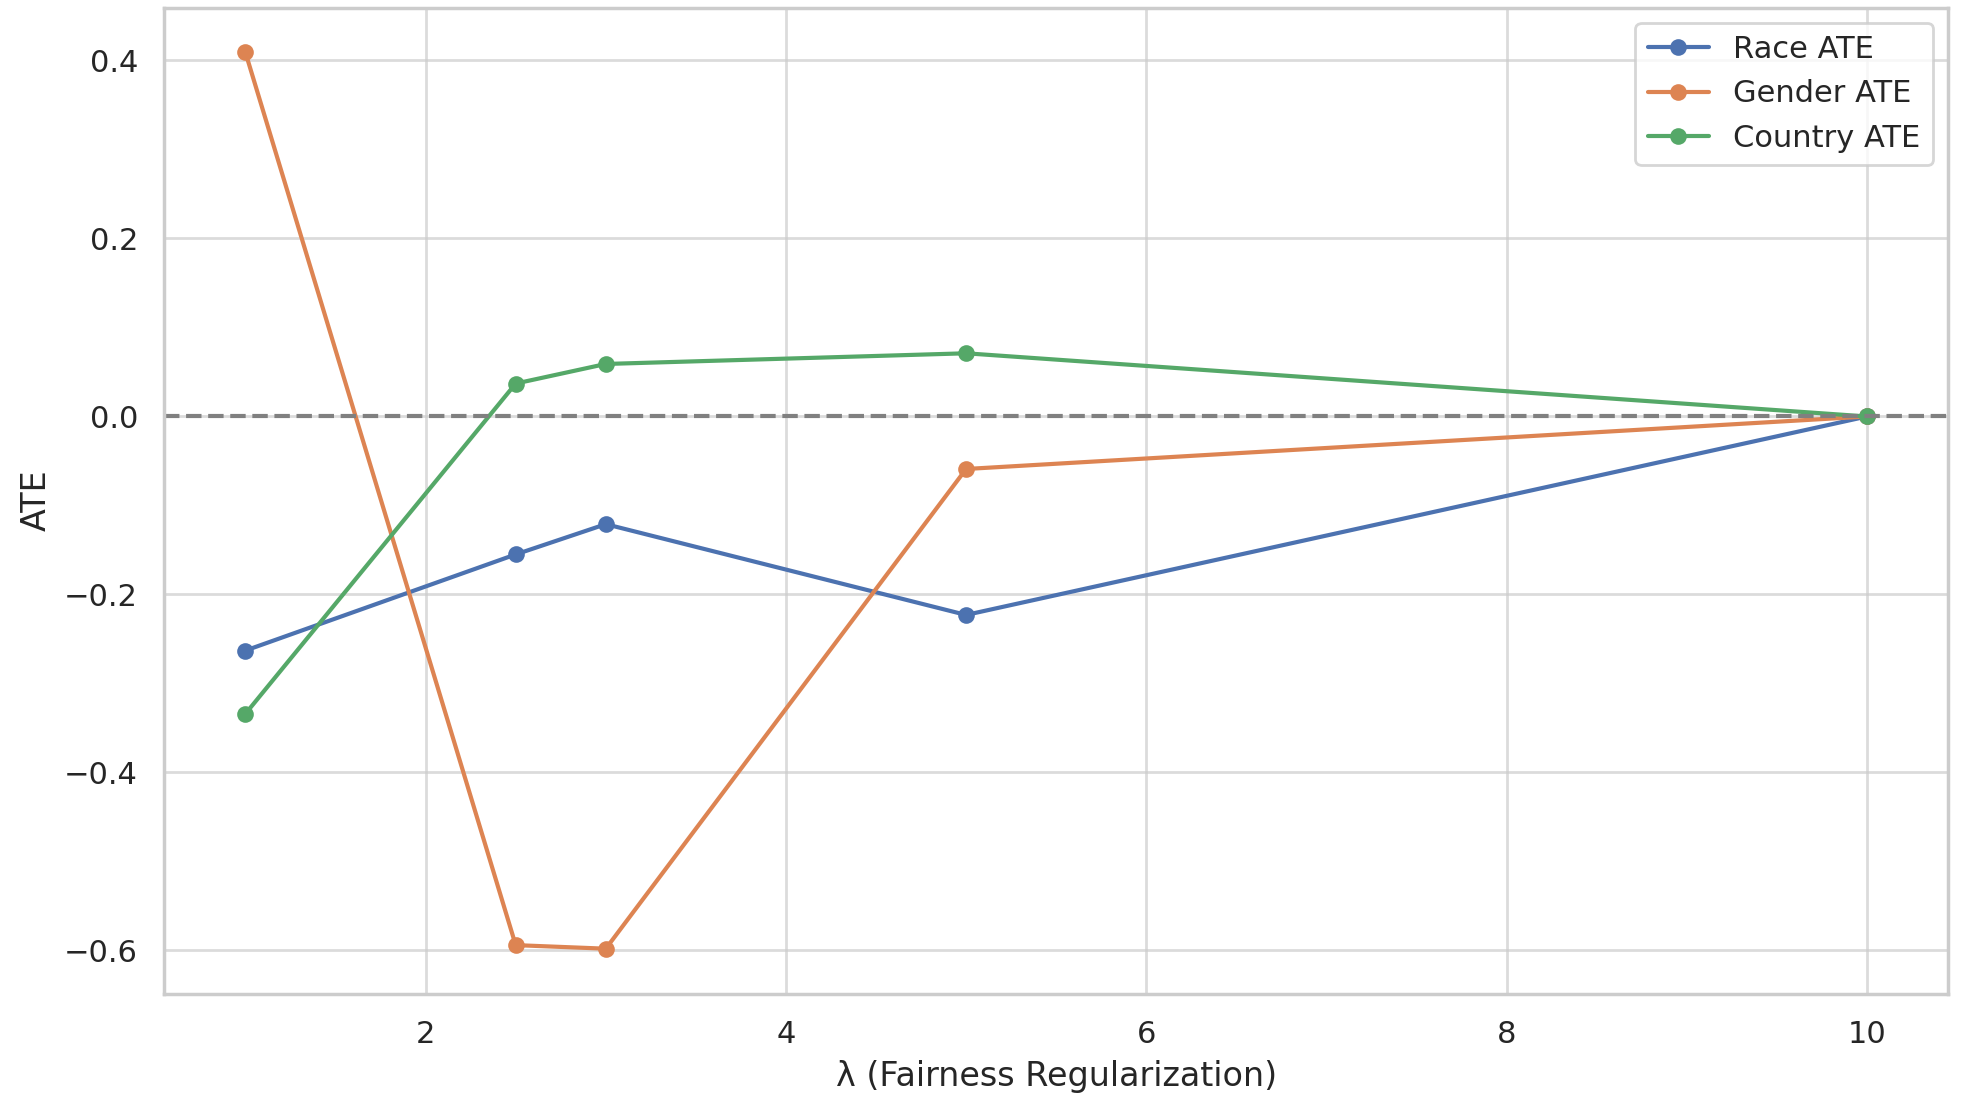
Figure 4 illustrates the model’s effectiveness at mitigating the biases identified in RQ1. As the fairness regularization strength () increases, the estimated ATEs for race and gender are systematically driven toward zero. By , the model’s recommendations are effectively neutralized of the causal biases found in the historical data, demonstrating successful bias mitigation.
IV-B2 Impact on Utility
Importantly, this bias mitigation does not compromise utility. Table VI compares outcomes from the baseline system and Fair-PaperRec. The intervention substantially improves the average ranking of papers by minority authors, reducing the demographic rank gap by nearly 70 positions.
Simultaneously, it achieves a higher NDCG score than the baseline (0.9667 vs. 0.9628). This ”win-win” result answers the second part of RQ3, providing causal validation that this fairness-aware intervention can enhance both equity and overall recommendation quality.
| Metric | Baseline | Fair-PaperRec |
|---|---|---|
| Avg. Rank (Race = 0) | 213.6 | 220.1 |
| Avg. Rank (Race = 1) | 475.1 | 412.6 |
| Rank Gap (Race 1 Race 0) | 261.5 | 192.5 |
| NDCG (Utility) | 0.9628 | 0.9667 |
IV-B3 Ablation Analysis: The Interplay of Fairness Components
Finally, to understand the interplay between different fairness objectives, we conducted an ablation study by varying the relative weights of the race () and country () components in the fairness loss function of [30], while keeping the overall regularization strength () constant. The results, presented in Table VII, reveal several key insights.
| Fairness Weighting (:) | Race | Country | Gender | NDCG |
|---|---|---|---|---|
| Baseline (No Fairness) | 261.5 | 229.4 | 196.0 | 0.9628 |
| Balanced (0.5:0.5) | 198.1 | 202.8 | 176.7 | 0.9659 |
| Race-Focused (0.9:0.1) | 192.2 | 207.3 | 182.1 | 0.9660 |
| Country-Focused (0.1:0.9) | 205.5 | 194.0 | 172.6 | 0.9654 |
First, there is a clear trade-off between the targeted fairness goals: the race-focused model achieves the lowest race rank gap (195.1) but performs worse on country fairness than the balanced model. Conversely, the country-focused model best addresses the country rank gap (235.3) at the expense of racial fairness.
Interestingly, the race-focused model also yielded the largest improvement in gender fairness (gender rank gap of 149.3), a positive “spillover” effect, even though gender was not explicitly included in the loss function. Furthermore, this same race-focused model achieved the highest overall utility (NDCG of 0.9661). This suggests that the historical racial bias in the data may have been the most significant suppressor of quality and that aggressively targeting it not only improves fairness across multiple dimensions but also maximizes the model’s ability to identify the most meritorious papers.
These findings confirm that the effectiveness of a multi-attribute fairness intervention hinges on the careful tuning of its components.
V Discussion
Our study was guided by three research questions concerning the existence of causal bias in peer review, its nuances, and the potential for mitigation. This section discusses the answers to these questions, their implications, and the limitations of our work.
V-A The Nature and Nuance of Causal Bias (RQ1 & RQ2)
Our first research question asked whether author demographics have a direct causal effect on paper acceptance rankings. The results provide a clear and affirmative answer. After controlling for established proxies of quality (h-index) and prestige (institutional affiliation), we found statistically significant causal penalties for authors from minority racial groups (ATE = +0.42), female authors (+0.25), and those from the Global South (+0.57). These are not merely statistical artifacts; they represent tangible disadvantages in a competitive selection environment where, for example, Black and Hispanic scholars collectively represent over 30% of the U.S. population but hold less than 10% of tenured faculty positions in STEM fields [25]. Our findings corroborate a large body of literature that has documented such correlational disparities [11], but advance the conversation by providing robust, causal evidence of direct discrimination.
Our second research question explored the nuances of how these biases manifest. The analysis reveals that the “average” effect is insufficient to capture the full story. The finding that racial bias is most pronounced for authors with lower h-indexes suggests that early-career researchers and those with less established reputations are more vulnerable to evaluator bias. Furthermore, the intersectional analysis demonstrates that biases are not simply additive. The severe causal penalty faced by minority-male authors, for instance, highlights a complex interaction between race and gender that would be missed by studying these attributes in isolation. A crucial caveat to all these findings is that our control variables, particularly the h-index, may themselves be endogenous to historical inequities, as studies have shown significant gender and racial gaps in citation practices [8]. This suggests our estimates of direct bias, while significant, are likely conservative.
V-B Evaluating a Causal Fairness Intervention (RQ3)
Our final research question asked if a fairness-aware intervention could mitigate these causal biases while maintaining or improving quality. The evaluation of Fair-PaperRec provides an optimistic answer. First, we demonstrated that the intervention is capable of neutralizing the identified causal biases driving the ATEs toward zero. This provides a crucial proof of concept: it is possible to design computational systems that don’t just produce statistically equitable outcomes, but that actively sever the causal link between an author’s identity and their evaluation. This represents a higher, more meaningful standard for fairness evaluation.
Second, and perhaps most importantly, we found that this bias mitigation was achieved alongside an increase in overall utility (NDCG). This result provides a strong counternarrative to the often-assumed “fairness-utility trade-off” [18], where promoting equity is expected to come at a cost to quality or performance. Our findings suggest that in a biased system, the trade-off may not apply; instead, bias is inefficient, causing meritorious work from underrepresented groups to be overlooked. By correcting the bias, the system doesn’t just become more equitable; it becomes better at its primary task of identifying high-quality research.
V-C Broader Implications and Limitations
The implications of these findings are twofold. For traditional peer review, they underscore the insufficiency of existing safeguards and reinforce the need for interventions such as structured review criteria and enhanced blinding protocols [43]. For the increasing use of AI in scholarly publishing, the risks are more acute. Models trained on biased historical data are poised to perpetuate these inequities at scale, a risk well-documented in other high-stakes domains like healthcare [28]. This necessitates a proactive approach to designing and auditing fair systems, using causal tools to ensure they do not simply reproduce the biases of the past [20].
Our analysis, however, is subject to certain limitations. The unconfoundedness assumption may be violated by unmeasured variables like writing quality or topic novelty. Furthermore, the use of the h-index as a quality proxy, while standard, is imperfect, and the study’s focus on HCI conferences may limit the generalizability of our findings to other academic fields.
VI Conclusion
This research moves beyond correlational analysis to causally quantify the extent of demographic bias in academic peer review and demonstrates a viable, fairness-aware computational intervention. By isolating the independent effects of race, gender, and geography, we provide robust evidence of systemic inequities that challenge the meritocratic ideal of science [23].
The findings serve as a call for systemic reform in both human-centric and automated evaluation systems. The demonstration that a fairness-aware model, Fair-PaperRec, can mitigate these causal biases while simultaneously improving the overall quality of selected papers refutes the notion of an inherent trade-off between equity and excellence—a common challenge in fairness-aware machine learning [18]. Future work must advance on multiple fronts: investigating the complex interplay of intersectional identities, developing more sophisticated causal discovery models, and conducting longitudinal experiments to validate fairness interventions in live review settings. Ultimately, integrating these quantitative approaches with qualitative research into the lived experiences of scholars [7] is essential for building a more transparent and genuinely equitable scientific community.
References
- [1] (2021-10) Multidimensional demographic profiles for fair paper recommendation. In Proceedings of the 13th International Joint Conference on Knowledge Discovery, Knowledge Engineering and Knowledge Management (IC3K 2021), pp. 199–208. Cited by: §III-C.
- [2] (2011) An introduction to propensity score methods for reducing the effects of confounding in observational studies. Multivariate Behavioral Research 46 (3), pp. 399–424. Cited by: §III-D2.
- [3] (1975) The specificity of the scientific field and the social conditions of the progress of reason. Social Science Information 14 (6), pp. 19–47. Cited by: §I.
- [4] (2008) Double-blind review favours increased representation of female authors. Trends in Ecology & Evolution 23 (1), pp. 4–6. Cited by: §II-A.
- [5] (2025) Institutional research activity classifications. Note: Available at \urlhttps://carnegieclassifications.acenet.edu/ Cited by: §III-B.
- [6] (2013) A probabilistic model for reviewer-paper matching. In Proceedings of the 29th Conference on Uncertainty in Artificial Intelligence (UAI), pp. 199–207. Cited by: §II-C.
- [7] (1991) Mapping the margins: intersectionality, identity politics, and violence against women of color. Stanford Law Review 43 (6), pp. 1241–1299. Cited by: §VI.
- [8] (2018) Gendered citation patterns across political science and social science. Political Analysis 26 (3), pp. 312–327. Cited by: §V-A.
- [9] (2012) Fairness through awareness. In Proceedings of the 3rd Innovations in Theoretical Computer Science Conference (ITCS), pp. 214–226. Cited by: §III-E.
- [10] (2008) Double-blind peer review and gender publication bias. Animal Behaviour 76 (4), pp. e1–e2. Cited by: §I.
- [11] (2011) Race, ethnicity, and nih research awards. Science 333 (6045), pp. 1015–1019. Cited by: §II-A, 1st item, §V-A.
- [12] (2017) Gender bias in scholarly peer review. eLife 6, pp. e21718. Cited by: §I, §II-A.
- [13] (2020) Causal inference: what if. Chapman & Hall/CRC, Boca Raton, FL. Cited by: §III-D2, §III-D2, §III-D3.
- [14] (2005) An index to quantify an individual’s scientific research output. Proceedings of the National Academy of Sciences 102 (46), pp. 16569–16572. Cited by: §III-B.
- [15] (1952) A generalization of sampling without replacement from a finite universe. Journal of the American Statistical Association 47 (260), pp. 663–685. External Links: Document Cited by: §III-D2.
- [16] (2015) Causal inference for statistics, social, and biomedical sciences: an introduction. Cambridge University Press, Cambridge, UK. Cited by: §III-A.
- [17] (2002) Cumulated gain-based evaluation of ir techniques. ACM Transactions on Information Systems 20 (4), pp. 422–446. Cited by: §III-E.
- [18] (2017) Inherent trade-offs in the fair determination of risk scores. In Proceedings of the 8th Innovations in Theoretical Computer Science Conference (ITCS), pp. 43:1–43:23. Cited by: §V-B, §VI.
- [19] (2020) An analysis of the peer review process at the iclr conference. Scientometrics 122 (1), pp. 587–603. Cited by: §I.
- [20] (2017) Counterfactual fairness. In Proceedings of the 31st International Conference on Neural Information Processing Systems (NeurIPS), pp. 4066–4076. Cited by: §I, §II-B, §V-C.
- [21] (2017) Counterfactual fairness. In Proceedings of the 31st International Conference on Neural Information Processing Systems (NeurIPS), pp. 4069–4079. Cited by: §III-A.
- [22] (2016) Blind peer review by academic journals. Journal of the American Medical Association (JAMA). Cited by: §I.
- [23] (1968) The matthew effect in science. Science 159 (3810), pp. 56–63. Cited by: §VI.
- [24] (2025) Name-based gender and origin inference service. Note: Accessed via https://namsor.app/ Cited by: 2nd item.
- [25] (2023) Diversity and stem: women, minorities, and persons with disabilities 2023. Note: Special Report NSF 23-315. Alexandria, VA. Available at \urlhttps://ncses.nsf.gov/pubs/nsf23315 Cited by: §V-A.
- [26] (2002) Research capacity strengthening in the south. Social Science & Medicine 54 (11), pp. 1699–1711. Cited by: §II-A.
- [27] (2020) Counter-storytelling and quantitative methods in critical studies of higher education. The Review of Higher Education 43 (3), pp. 823–846. Cited by: §III-A.
- [28] (2019) Dissecting racial bias in an algorithm used to manage the health of populations. Science 366 (6464), pp. 447–453. Cited by: §V-C.
- [29] (2016) Single-blind vs double-blind peer review in the setting of author prestige. JAMA 316 (12), pp. 1315–1316. External Links: Document Cited by: §I.
- [30] (2025) Fair-paperrec: fairness-aware paper recommendation with demographic constraints. Under Review, WI-IAT 2025. Cited by: §I, §II-C, §III-E, §IV-B3, §IV-B.
- [31] (2009) Causality: models, reasoning, and inference. 2nd edition, Cambridge University Press. Cited by: §II-B, §III-A.
- [32] (2014) Reputation and impact in academic careers. Proceedings of the National Academy of Sciences 111 (43), pp. 15316–15321. Cited by: §I.
- [33] (1983) The central role of the propensity score in observational studies for causal effects. Biometrika 70 (1), pp. 41–55. Cited by: §II-B, §III-D1.
- [34] (2002) Observational studies. 2nd edition, Springer, New York, NY. Cited by: §III-F.
- [35] (2018) Performance of the genderize.io and namsor.com apis for gender-coding names. Technical report Technical Report. Note: Available at \urlhttps://osf.io/y426k/ Cited by: 2nd item.
- [36] (2015) A solution to the single-blind reviewing problem, or, the best of the two worlds. Games and Economic Behavior 91, pp. 208–212. Cited by: §II-A.
- [37] (2018) Fairness of exposure in rankings. In Proceedings of the 24th ACM SIGKDD International Conference on Knowledge Discovery & Data Mining, pp. 2219–2228. Cited by: §II-C.
- [38] (2021) Gender bias in peer review: new evidence from the scholarly publishing industry. Nature Human Behaviour 5 (5), pp. 566–576. Cited by: §I, §II-A.
- [39] (2021) Only second-class tickets for women in the peer review process? evidence from a natural experiment. Science Advances 7 (50), pp. eabj1646. Cited by: §II-C.
- [40] (2020) A study of the review process of the conference on neural information processing systems. Quantitative Science Studies 1 (4), pp. 1435–1463. Cited by: §I.
- [41] (2023) Can we have our cake and eat it too? a study of the peer-review-based paper selection and citation counts. In Proceedings of the 2023 ACM Conference on Fairness, Accountability, and Transparency, pp. 1234–1245. Cited by: §I.
- [42] (2022) Nudging peer reviewers at scale: evidence from a field experiment. Sociological Science 9, pp. 43–66. Cited by: §I.
- [43] (2017) Reviewer bias in single- versus double-blind peer review. In Proceedings of the National Academy of Sciences, Vol. 114, pp. 12708–12713. Cited by: §II-A, §III-B, §V-C.
- [44] (2023) UN m49 standard: standard country or area codes for statistical use. Note: Available at \urlhttps://unstats.un.org/unsd/methodology/m49/ Cited by: 3rd item.
- [45] (2016) A review of the literature on citation impact indicators. Journal of Informetrics 10 (2), pp. 365–391. Cited by: §III-B.
- [46] (2023) Towards fair machine learning software: understanding and addressing model bias through counterfactual thinking. arXiv preprint arXiv:2304.08377. Cited by: §II-C.
- [47] (2008) Does double-blind review benefit female authors?. Trends in Ecology & Evolution 23 (7), pp. 347–348. Cited by: §I.
- [48] (2024) Improving fairness in machine learning software via counterfactual fairness thinking. In 2024 IEEE/ACM 46th International Conference on Software Engineering: Companion Proceedings (ICSE-Companion), Cited by: §II-B, §III-A.