Frustrated supermolecules: the high-pressure phases of crystalline methane
Abstract
Methane is the simplest hydrocarbon, yet it exhibits an extraordinarily complicated series of crystal phases. Notably, the non-plastic phases have large unit cells with nearly, but not quite cubic symmetry. Furthermore, although non-polar molecules interact very weakly, their reorganisation across phase transitions is very sluggish. Here, we demonstrate that these complex structures can be understood as simple packing of near-spherical supermolecular clusters of methane molecules: the departure from cubic symmetry arising from the non-spherical nature of the molecules. We use molecular dynamics based on density functional theory calculations to simulate the finite-temperature crystal structures of methane, finding that the complex Phase A is based around a 13-molecule regular icosahedron, with 8 additional molecules forming the 21-molecule unit cell. Similarly, Phase B is based on a body-centred cubic packing of 17-molecule Z16 polyhedra, with the remaining 12 molecules per cell in tetrahedral interstices. We demonstrate that the favored intermolecular separation depends sensitively on molecular orientation, leading to hindered rotation and suppressed entropy. The structures are determined by a trade-off between efficient packing and entropy.
I Introduction
Methane is the smallest hydrocarbon and as such is widespread both on Earth and throughout extraterrestrial environments [36]. Despite being a simple and fundamental system, there is still a considerable gap in our understanding of methane’s solid phases, which exist at low temperatures and high pressures.
In the low pressure limit, the enthalpy () is effectively synonymous with internal energy, and cohesion in methane arises from dispersion forces. With an enthalpy of vaporisation of 10 kJ/mol (about 100 meV per molecule), these interactions are relatively weak. By contrast, at 5 GPa each molecule occupies about 30 Å3, so the PV term is close to 1 eV. Thus, the density contribution is an order of magnitude greater than the dispersion energy. At these pressures, the energy contribution is overwhelmingly dominated by short-range steric repulsion, and minimising the enthalpy can be thought of as finding efficient packing of tetrahedral molecules. At room temperature, entropic effects are also significant in determining phase stability, since the six molecular degrees of freedom yield up to meV.
The current phase diagram has an “onion-ring” form [6, 39]. Upon cooling from the high-pressure melt, or compression at room temperature, four solid phases have been identified. Their phase boundaries all have a positive slope (), indicating that the high-temperature phases are also favoured at lower pressures.
The first phase to which methane crystallizes on cooling or pressurization is called Phase I and has been determined [32] to be cubic, closed-packed space group , Strukturbericht A1. The tetrahedral point group symmetry of the molecule is inconsistent with the cubic close-packed structure. The symmetry is restored by rotational motion which results in a plastic crystal [31, 32].
On increasing pressure, methane transitions from Phase I to Phase A [6], which has a 21 molecule rhombohedral unit cell [28]. The structure of this phase has been extensively studied using both X-ray single-crystal and neutron powder diffraction, which gave a full structural solution for Phase A including hydrogen positions in the space group [26]. The rhombohedral cell is very close to cubic () and was reported as a distorted close packed structure. A distinguishing feature of Phase A is that the C–H bonds do not point toward one another and all hydrogen positions are well ordered. Despite the description as close packing, Phase A cannot be related to the cubic cell of Phase I.
With further compression, Phase A undergoes a slow transition to a cubic Phase B [7, 38]. To date, structural studies on Phase B have identified the space group and determined the arrangement of the carbon sublattice [27]. However, a complete structural solution, including hydrogen positions, remains unresolved. The conventional unit cell of Phase B contains 58 molecules, with carbon atoms arranged similarly to -Mn, across four distinct crystallographic sites consistent with the A12 Strukturbericht designation.
The transition between methane A and B has been extensively studied using Raman spectroscopy, both in hydrogenous [40, 6] and in deuterated methane [33]. The two phases are readily distinguished by the splitting of vibrational modes and by their distinct pressure-dependent evolution of the Raman spectra. The sluggish nature of the transformation implies significant hysteresis and uncertainty about the exact transformation pressure.
At even higher pressures, methane transforms to yet another phase, called HP [6, 20]. A recent study combining X-ray measurements and ab initio calculations found Phase HP to be stable between 20 and 73 GPa, and determined it to be a rhombohedral distortion of Phase B (space group ), with the unit cell containing 87 molecules (29 molecules in the primitive cell) [11].
Ab initio structure search methods can determine possible minimum enthalpy ground state structures. However, such methods cannot detect structures with rotating molecules which have entropic stabilisation, such as the experimentally reported Phase I.
Ab initio, Born-Oppenheimer molecular dynamics (BOMD) offers a powerful route to identify symmetry-breaking and capture finite-temperature behaviour that static DFT inherently omits: molecular rotation, anharmonic vibrations, and entropy-driven stabilisation. BOMD has already provided key insights into the role of molecular rotation and reorientation in solid hydrogen’s phase diagram, including calculation of non-harmonic Raman [22, 24, 25, 16, 15, 29, 2], as well as rotational melting in solid nitrogen [21]. Motivated by these successes, we employ extensive BOMD simulations of crystalline methane across relevant pressures and temperatures.
Molecular dynamics is also crucial in identifying the effective shape of a molecule: for example, rotations can cause a linear molecule such as N2 to behave and pack as a disk or a sphere [21]. Furthermore, rotating molecules can pack into “supermolecules”, most notably the icosahedral (H [1, 8, 12]. This, in turn, is a component of density-driven packing in weakly bound or hard-sphere systems. [18, 35, 34, 9]
The philosophical approach to interpreting experiments is to assign the structure as the highest symmetry not ruled out by the data. By contrast, BOMD samples structures with no symmetry: symmetry emerges only as a time- and space-averaged property. More recently, we have advocated that the candidates for the crystal structure should be the low enthalpy and stable structures found in calculations. Such a structure should be ruled out if it is inconsistent with the data, but not on the grounds that a “simpler” structure fits the data. Here, we pay attention to the relationship between calculation and data, leaving aside the experimentalist’s interpretation.
In this paper, we quantify the role of rotational entropy in stabilising Phases I, A, and B; elucidate the origin of kinetic hysteresis in the AB transition; and reconcile static DFT predictions with experimental diffraction and spectroscopic data.
II Methods
II.1 Molecular Dynamics
We performed several BOMD simulations for methane phases I, A, B, and HP at 300 K. The many-body electronic problem is solved using density functional theory (DFT) within the plane-wave pseudopotential approach, as implemented in CASTEP [13]. The PBE [30] is used as the approximate exchange-correlation potential. This is consistent with other DFT studies of methane and hydrocarbons under pressure [11, 19, 14]. Selected configurations were recalculated with rSCAN [4] and BLYP [5, 23], and the key results are independent of the functional. For the BOMD simulations, we used CASTEP’s “MS_PBE” ultrasoft pseudopotentials with a 390 eV energy cutoff. In all cases, we chose a timestep of 0.5 fs, some 20 times smaller than the shortest vibrational periods (C–H stretches).
For each phase, the specific supercell sizes, pressure conditions, and ensemble choices are detailed in the corresponding Results subsections, where we tailor the setup to the experimentally relevant stability fields. In all simulations, we monitor radial distribution functions (RDFs) and mean squared displacements (MSDs) to characterize structural order and atomic mobility. We also carried out static calculations for methane, which are consistent with previous work [11].
II.2 X-ray and Neutron Diffraction Patterns
Molecular dynamics simulations do not enforce symmetry, so rather than go through some intermediate model structure, we determine the diffraction patterns directly from the simulation in the space group[2]. We used the BOMD trajectory to create an effective “unit cell” with atoms superposed from 50 independent snapshots. This gives us a direct sampling of the thermal broadening and the fractional occupation of particular C–H directions. This 42000-atom cell was then run through GSAS [37] to generate the corresponding X-ray and neutron diffraction patterns. Provided the system is ergodic (i.e. time and space averages are equivalent), such patterns are suitable for direct comparison with experiment and, importantly, have no assumed symmetry.
II.3 Rotational Free Energy
The contribution to the free energy from rotational degrees of freedom is not conceptually straightforward. In classical physics, the freely rotating molecule has lowered free energy due to high entropy from equally sampling the solid angle . In quantum physics, it is the free rotor ground state which samples all solid angles. As a single quantum rotor state it has no entropy, rather obtaining its low free energy from its low kinetic energy. The equivalence of these pictures is demonstrated in Hindered Rotor Theory. [16, 15] Neither of these rotor free energies has a direct relationship to the phonon free energy routinely calculated from perturbation theory, assuming the motion to be harmonic. However, rotating molecules usually have a shallow minimum in their potential energy surface, so lattice dynamics calculations are often fortuitously accurate.
To quantify the degree of orientational disorder for each molecule in our BOMD simulations, we compute unit vectors along the four C–H bonds (). From their time series, we build the joint orientational probability density function (PDF) on the unit sphere and compute the associated Shannon entropy,
| (1) |
where is the solid angle per bin. is then normalised by so that . The sum runs over equal-area binned data. can be considered as a fraction of the maximum possible entropy for two angular degrees of freedom.
We use the per-molecule entropy to determine groups of atoms which are symmetry-related. It also allows us to distinguish between ordered and (partially) disordered sites.
To further aid identification of rotating molecules in the BOMD trajectories, we created a spherical heatmap of the directions from , shown as a Mollweide projection, oriented such that one bond lies at the centre of the projection.
II.4 Crystal Structure and Symmetry Analysis
Any snapshot taken from BOMD calculation will have no symmetry. Over a long simulation, symmetry may emerge from the average positions of the atoms. However, the atoms are identical, and with methane, this can be problematic if the molecules reorient or rotate. Since the molecules do not diffuse, taking the average position of the carbon atoms is fine, but the mean position of a hydrogen in a rotating methane is in the centre of the carbon, which is not helpful.
We begin construction of the crystal symmetry by time averaging C-atom positions. For each molecule , the H-atoms are then assigned based on the corresponding . The symmetry of the structure is obtained using Spglib [3]. Together with previously-defined this allows us to identify symmetry-equivalent molecules and to determine the highest symmetry group consistent with the diffraction pattern.
III Results
The MSDs become flat on a picosecond timescale, indicating non-diffusive crystalline behaviour without any C–H bond breaking (Fig. 1). Carbon atoms show low mobility, while hydrogen atoms display higher MSDs, consistent with molecules that either reorient or rotate. The C-C RDFs are a proxy for intermolecular spacings and for all phases they exhibit a well-defined first peak that drops to zero, confirming solid-like order with well-defined coordination numbers (Fig. 1).


III.1 Phase I
Phase I is widely reported as having the cubic close-packed structure . Static structure searches cannot find this structure because cubic close packing is incompatible with the point-group symmetry of the methane molecule. The closest approximant is a phase of symmetry with , which is competitive below 5 GPa. [11]
Spherical molecules in this structure could adopt the face-centred cubic () structure if , and this would be consistent with experiment. Therefore, we used with as our initial condition for Phase I molecular dynamics. We performed BOMD on a conventional supercell with 32 molecules (160 atoms), at 7 GPa and 300 K. We ran the simulation for a total of 15 ps.
The structure remains solid, with reorienting but non-diffusive CH4 molecules retaining their integrity and oscillating about their original positions. Fig. 1 shows that the carbons have a low MSD of about 0.2 Å2, while hydrogens have an MSD converging to about 2.5 Å2. This is consistent with large-amplitude rotational motion of molecules with a C–H bond length of 1.09 Å, rather than with translational diffusion or rigid orientational locking.


The orientational probability density in Fig. 2 exhibits distinct maxima and clearly avoided directions, incompatible with an isotropic free-rotor model. The corresponding rotational entropy per molecule is about 80% of the maximum classical value , directly quantifying the degree of rotational hindering. Thus, the methane molecules in Phase I are neither rigidly locked nor freely rotors; they move freely while strongly avoiding the eight (111)-type orientations. The free energy landscape is unusual, being largely flat, but with discrete peaks.
Despite this anisotropic instantaneous orientational distribution, the RDFs and ADFs for all carbons lie on top of one another and coincide with the ensemble-averaged curves, confirming that the time-averaged carbon positions form an lattice. The stress tensor becomes hydrostatic at (see the Supplementary Material for supporting analysis), and the trajectory shows a stable solid with no intermolecular proton transfer.
The structure found in static searches is a plausible low-temperature orientationally ordered approximant, but at 300 K its free energy is exceeded by that of the orientationally disordered, hindered-rotor phase. Static enthalpy rankings alone are therefore insufficient to predict the observed Phase I; inclusion of rotational degrees of freedom and their entropy is essential for capturing its stability.
III.2 Phase A


III.2.1 Phase A Simulations
Phase A is regarded as a very unusual structure, insofar as it has a near-cubic primitive unit cell (rhombohedral angle between 89 and 90o), with 21 molecules but with molecular positions having symmetry without any obvious relationship to a cubic structure. Constrained DFT structure searches based on 21 molecules per unit cell and enforced symmetry are able to find the experimentally reported structure [26]. However, static DFT calculations find this phase to be unstable with respect to rotation of the molecules: unless symmetry is enforced, there is a symmetry breaking on relaxation to a triclinic structure (named A-), which has substantially lower enthalpy than . In all cases the unit cell is remarkably close to a cube, angles are still between 89 and 90o and the cell lengths within 0.5% of equality.
Furthermore, unconstrained structure searches [11] revealed several structures with enthalpy even lower than the A- structure in the pressure range where Phase A is located. These structures will be discussed in section Low Temperature Structures.
For BOMD, we used the primitive cell containing 105 atoms, large enough that the two nearest-neighbour shells are fully independent molecules. Given the importance of steric effects and the fast-decaying nature of van der Waals interactions, we expect and observe this system size to be adequate to overcome orientational frustration. We ran two different simulations in the NVT ensemble: in one case using a triclinic unit cell, based on the calculated A- minimum enthalpy structure, and the other with a rhombohedral cell, as per experiment. We ran both BOMD simulations in the NVT ensemble for 12 ps. Where applicable, the same simulation settings as for Phase I, were chosen. We initiated both structures via static relaxation at 7 GPa. The final pressure, taking into account the kinetic contribution, was around 8 GPa. To test finite size effects, we then repeated the simulation with a supercell containing 840 atoms. All three simulations had equivalent radial and angular distribution functions, and produced equivalent simulated diffraction patterns (see SM). We conclude that our results are independent of system size or supercell shape.
The molecular orientation shows frequent reorientation, such that after about 2 ps, molecule orientations are uncorrelated with initial conditions. After a long run, the average position of individual hydrogen atoms is in the middle of the molecule as discussed in the Methods section.
III.2.2 Phase A Structure
The radial distribution function shows a very well-defined first peak, so we can easily assign coordination numbers to each molecule and generate the ADF (Figs. 1 and 3). On relaxation of the structure, this near-neighbour peak comprises 25 inequivalent “bonds” between various neighbour pairs, with a range of lengths between 3.1 and 4.2 Å . No other pairs are found less than 5 Å apart.
We created averaged structures from the average molecular positions and tested their symmetry using SPGLIB. Surprisingly, this is , higher than either the initial cells or the experimentally reported values.
In the initial structure setting, there were three molecules on Wyckoff 1a sites, i.e. on the body diagonal, and three molecules on each of the six independent 3b sites. The emergent inversion symmetry which creates is about one of the 1a () sites, which becomes 1b in . Inversion links the other two 1a sites, which become 2c in , and pairs up the 3b () sites into 6f () sites.
The RDF and ADF (Fig. 3) demonstrate both the different environments of the molecules at different sites and the similarity of those at symmetry equivalent Wyckoff sites (see SM). Notably, all sites linked by the inversion symmetry to get have indistinguishable RDF and PDF.
The MSD (Fig. 1) is consistent with either rotating or reorientating molecules, but the entropy gives deeper insight into the different molecular behaviours. The PDF indicates that only the 1b molecule rotates nearly-freely (), other molecules have a strongly preferred orientation, but reorient between the 12 permutations of the hydrogen atoms on a picosecond timescale.
We note that the 1b site is the inversion centre, and so this molecule cannot be ordered without breaking symmetry. This 1b site has a very simple RDF and ADF, the single C–C peak indicates a shell of 12 neighbours, and angles of 63, 115 and 180o reveal it to be the central site in an icosahedron.
The 6f2 and 6f3 molecules, which form the icosahedron, are oriented such that they have C–H bonds pointing directly away from the central 1b site. We propose that this facilitates the rotation of the central molecule. The fivefold symmetry means the icosahedron cannot be incorporated into any space group, so the 6f2 and 6f3 sites are symmetrically inequivalent, although their RDF, ADF and entropy are similar. Indeed the 6f2 and 6f3 sites have very close near-neighbours outside the octahedron, and show low rotation and entropy, whereas the 6f1 site has near-neighbour distances similar to 1b, and exhibits high .
The shortest intermolecular spacings are between the 2c and 6f1 sites. Taken together, these eight molecules form a distorted cube centred on the origin. A cube is not an efficient packing, even when distorted, but this seems to be compensated for by the very short intermolecular separations facilitated by the favorable orientations. If one thinks of these as “bonds”, their low enthalpy is primarily due to the shortness of the distance contributing to low volume structures.
The structure found in the simulations is extremely close to that reported experimentally; the icosahedral supermolecule is present, if unnoticed. All diffraction peaks are in the same place in simulation and experiment and correspond to either or , the maximum possible symmetry for an octahedron in a cube. The X-ray single-crystal data analysis, considering carbon atoms only, obtained a better fit to the intensities with R symmetry while the time-averaged simulation is close to (with finite sampling, any computed average is strictly .). However the molecular positions in the two models are extremely close. The neutron powder data was analysed using three models, all different from the simulation, and the best fit being with molecules orientationally ordered. The sample was somewhat textured , so the neutron data are thus less emphatic than are the x-ray data [27]. The most notable difference is that, in (), the three molecules along the (111) rotation axis were assumed to be all pointing in the same direction [27]. In one of these molecules is the rotating one at the centre of the icosahedron, and in simulation another rotates to become symmetry-related to the third as 2c. An illustration of this is given in SM. The experimental proposal for orientational order came from the best-fit to possible fixed molecular orientations with symmetry, the MD shows another possibility where one molecule rotates. We note that the dynamic reorientation observed in the simulation simply permutes the hydrogen atoms, so has no impact on the diffraction analysis.
| Cell | Angles (∘) | Symmetry | Volume (Å3) | |
| triclinic | 89.30, 89.67, 89.27 | 643 | ||
| rhombohedral | 88.88 | 645 | ||
| Expt. | 89.5 | 616 | ||
| Site | Coordinates | Entropy | Coordination | rmin(Å) |
| 1b | 0.50 0.50 0.50 | 0.76 | 12 | 3.36 |
| 2c | 0.12 0.12 0.12 | 0.58 | 13 | 3.12 |
| 6f1 | 0.36 0.45 0.12 | 0.67 | 14 | 3.12 |
| 6f2 | 0.64 0.13 0.01 | 0.58 | 13 | 3.39 |
| 6f3 | 0.63 0.76 0.23 | 0.59 | 13 | 3.25 |
III.2.3 Phase A Simulated Diffraction Patterns
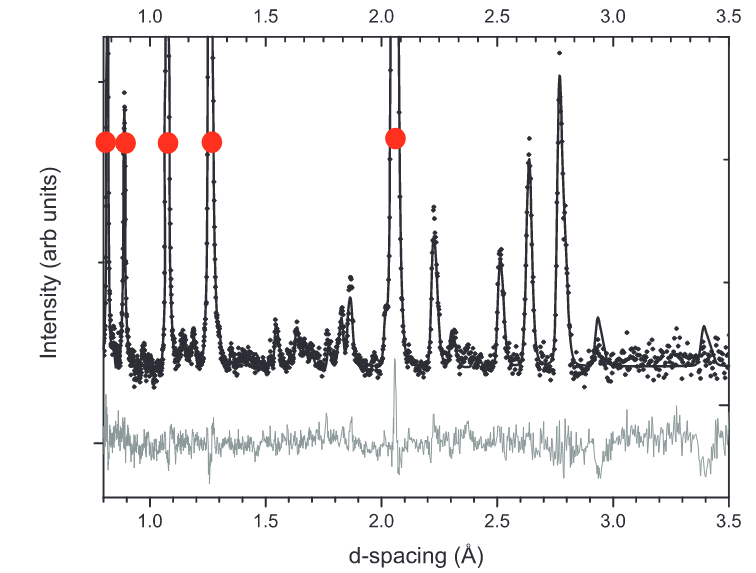
We simulated time-of-flight (TOF) neutron diffraction patterns for each candidate phase using 50 frames from the BOMD simulation, which is enough to converge the pattern. Results are presented in Fig. 4 (see SM for convergence tests and additional simulated patterns).
The cells are all close to cubic, which allows us to index the strong reflections into groups (see SM). The small rhombohedral distortion splits these groups into well-defined peaks. The agreement with the experimental data is good, given that there are no systematic absences: all peaks have non-zero intensity in theory, and the simulation gives very low intensity to those not observed in experiment.
Our best reconciliation of the simulation and experimental data is thus that phase A has a degree of orientational disorder of the molecules - a conclusion that is in accord with thermodynamic expectation given that phase A transforms on cooling. The icosahedral supermolecule necessitates a reduction of symmetry from cubic to , although the associated distortions from cubic are small. X-ray diffraction spot intensities [27] imply symmetry : the breaking of centrosymmetry is not explained by the simulations. It could arise from particular molecular orientations; methane does not have inversion symmetry, so requires disorder at the 1b site. The X-ray data was fitted considering the carbon atoms only; ultimately, the final resolution of this question will require neutron single crystal data.


III.3 Phase B and HP


Phase B has been reported to have the A12 -Mn structure, with cubic symmetry. This structure has 58 molecules in the unit cell, on four symmetry-inequivalent molecular sites (Wyckoff 2a, 8c, 24g1 and 24g2) with coordination ranging from 12 to 16 [10]. All these sites have symmetry or lower, so a methane molecule can be placed there without breaking symmetry. However, all structures found in constrained DFT structure searches have imaginary phonons associated with rotation on molecules on the 24g1 sites.
The HP phase observed on compressing Phase B is a small rhombohedral distortion from cubic -Mn, to . Although this structure has high enthalpy compared to structures discussed in Low Temperature Structures, a combination of low ZPE and high entropy act to stabilise it at high temperatures [11], and it is the most stable structure at 300 K and 25 GPa, according to quasiharmonic DFT calculation.
For the BOMD, we use a 290 atom quasicubic supercell of Methane HP, at 20 GPa as our initial configuration, with a rhombohedral cell with angle.
We ran BOMD simulations first in the NVT ensemble for 10 ps, for equilibration. The system then evolved for 15 ps in the NPT ensemble. We used the Parrinello–Rahman barostat, allowing cell shape changes. The resulting MSD is shown in Fig. 1. As for Methane I and A, the hydrogen MSD tends to the 2.5 Å2 value expected for hydrogen reorientations, however, this limit is only reached after 30 ps: the reorientation is an order of magnitude slower than phases I and A. An analysis of the mean hydrogen positions and the PDF in Fig. 5 shows a preferred axis of rotation for the 24g2 site: consequently, the hydrogen MSD reaches 2 Å2 within 5 ps as three of the four C–H bonds exchange positions, but the final reorientations take an order of magnitude longer.
We have also monitored the evolution of lattice parameters during the 20 ps NPT simulation (see SM). The ensemble-averaged lattice parameters with time are cubic, in agreement with experiment for Phase B.
| Site | Coordinates | Entropy | Coordination | rrange(Å) |
|---|---|---|---|---|
| 2a | 0 0 0 | 0.51 | 16 | 3.8 |
| 8c | 0.317 | 0.67 | 16 | 3.63-4.12 |
| 24g-1 | 0.087 0.931 0.713 | 0.69 | 13 | 3.3-4.02 |
| 24g-2 | 0.145 0.145 0.528 | 0.44 | 12 | 3.11-4.11 |
III.3.1 Phase B and HP Structure Molecular Orientations
Phase B and HP have essentially identical molecular positions, differing only in the molecular orientation. A notable feature of Phase B (and HP) are the two Z16 Frank–Kasper (FK) supermoleculal clusters, typical of Laves phases. These contains 17 molecules, centred on the 2a sites, with the neighbours on 24g2 and 8c sites. The C–H bonds of the central molecule point directly towards the 8c sites, while each 24g2 molecule has a C–H bond pointing towards the centre. As we saw in the dimer calculations, this implies a relatively long intermolecular distance compared with the shortest distances on the surface of the cluster. These supermolecules are arranged in a structure. The central site has symmetry, and that molecule has strong preferred orientation, as do the 24g2.
The orientation plot for Phase B (Fig. 5) shows a clear difference between the various sites. Significant rotation is observed for the 24g1 sites and the 8c sites (S=0.681) while the other sites remain firmly in their preferred orientation, (S=0.474).
The Z16 supermolecule is a feature in all of these -Mn type structures (Phase B, HP and the fixed-molecule structure). The difference can be attributed to the 24g1 molecules. In those sites, one of the C–H bonds is fixed, there are several behaviours for the remaining three:
-
•
Molecules are fixed in directions obeying the symmetry. This is possible, but high energy and not seen in BOMD, even on average.
-
•
Molecules are freely rotating. This also allows symmetry, but is not observed.
-
•
Molecules are disordered, oriented in one of two directions: This is Phase B: symmetry is recovered on average by the disorder.
-
•
Molecules are ordered, alternating between four symmetry-breaking states.: This is Phase HP. The ordering to breaks the 24g1 sites into four 6c sites.
III.3.2 Bond Enthalpies, Energies and Frustration
In order to understand the physics of the structures, we consider the enthalpy of methane to be made up of contributions from neighbouring bonds. This is possible because, in all structures, there is a clear separation between the shell of nearest neighbours and the second neighbour shell. We consider enthalpy rather than energy because the different bondlengths significantly affect the density.
We calculated the energy of a methane dimer (Fig. 6) with different orientations. At the observed separations, all “bonds” are repulsive. For a given a separation, there is a large energy difference between more and less favourable orientation. For example, at 3.3 Å there is a 90meV difference between the lowest energy arrangement, with molecules pointing away from each other, and a similar arrangement with one molecule pointing towards its neighbour. The arrangement with both molecules pointing at each other is 350meV less stable. Differences between staggered and eclipsed arrangements are small.
Calculating and dividing by the bonds per cell, we find that each bond has approximately 100meV enthalpy contribution from density. Shorter bonds are assigned lower enthalpy and the main way that bonds can be shortened is by favourable orientation of the molecules. However, it is impossible to be favourably oriented with respect to all 12-16 neighbouring molecules, and we can expect all bonds to have similar energy, so there is frustration and a range of bondlengths.

| Symmetry | Atoms | Name | Phase | P (GPa) | T (K) | Notes | Enthalpy (eV/atom) |
|---|---|---|---|---|---|---|---|
| 145 | -Mn | B | 20 | 0 | PBE | -6341.09617 | |
| relaxed | 145 | d--Mn | B | 20 | 0 | PBE | -6342.35000 |
| MD | 145 | d--Mn | B | 20 | 70 | PBE/0.1 ps | -6342.55259 |
| R3 | 145 | HP-phase | HP | 20 | 0 | PBE | -6342.81853 |
III.3.3 Phase B Simulated Diffraction Patterns
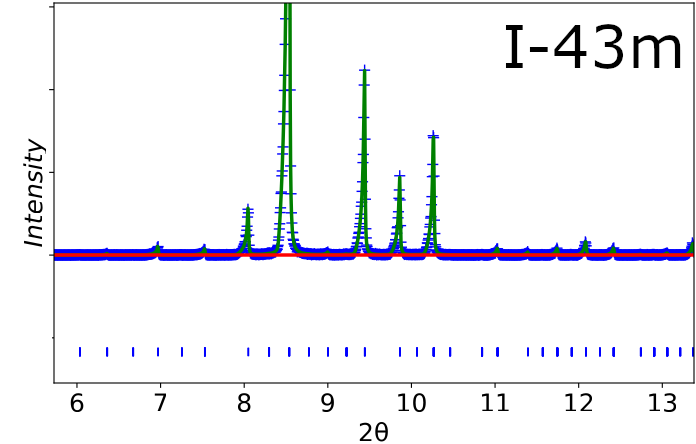
To assess which candidate structures are consistent with the reported Phase B diffraction data, we simulated powder X-ray diffraction patterns directly from BOMD trajectories, following the same workflow as for Phase A. We compare the generated patterns to the experimental X-ray pattern measured at 8 GPa and 300 K [27].
Figure 7 shows a restricted interval chosen because it contains several reflections that are particularly sensitive to the underlying carbon sublattice in methane Phase B. Alongside the (A12, -Mn type) model, we include two low-symmetry candidate structures previously proposed as low-temperature alternatives [38], and , simulated here under the same finite-temperature BOMD protocol.
Within this range, the model reproduces the experimental pattern significantly better than either low-symmetry candidate. In particular, it captures the observed peak positions and their grouping in a way that is consistent with a near-cubic cell, whereas the and candidates produce additional features and intensity redistribution that are not supported by the data (see Low Temperature Structures for simulation details). These discrepancies are not subtle: they appear as distinct extra reflections or peak splittings in the simulated patterns that would be readily detectable in the measured trace over the same angular range.


III.4 Supermolecules: Quasicubic phases with odd molecule counts
Although Phase A does not have cubic symmetry, the rhombohedral angle is only about 1∘ away from 90. Phase B is cubic, but with a large prime number of molecules in the unit cell, and distorts by 1-2∘ to rhombohedral in the HP phase. These features can be resolved by considering supermolecular clusters.
Phase A has a 13 atom supermolecular cluster: the 1b atom has 12 neighbours in an icosahedral arrangement. Molecules on the surface of the icosahedron have C–H bonds pointing directly away from the central site, consequently intermolecular distance from the centre are smaller than those on the surface, which facilitates packing 12 neighbours.
Phase B, has a 17 molecule cluster with symmetry centred on the a site which points directly at the four c sites. The 12 neighbours on the g2 site have C–H bonds pointing to the centre. Consequently, the intermolecular distances from the centre are longer than those on the surface, which facilitates packing 16 neighbours.
In Phase A, the supermolecules form a cubic lattice while the remaining eight molecules (2c and 6f1) forming a distorted cube. One can then approximate Methane-A as supermolecules in the Strukturbericht B2 (CsCl) structure, with a nearly regular icosahedron of 13 molecules at the cube centre, and a distorted cube of 8 molecules at the corner. The is the highest symmetry which can be obtained with a regular icosahedron in a cube: a threefold axis along (111) and an inversion centre. The cube distorts into with the two molecules on the threefold axis being different from those on the 6f1 site.
Turning now to Phase B, we see that the 2a site has 16 near neighbours. This forms a 17 molecule cluster with symmetry centred on the 1a site and its 16 neighbours. Such a structure is “topologically close packed” and is a well-known efficient packing with two different sized atoms. Unlike the Laves phases, in Methane B all molecules are the same type: the a range of bondlengths introduces different sizes. All intermolecular distances involving the central Z16 molecule have a C–H bond pointing directly along them; consequently, these distances are longer than the ones between Z16-surface molecules. The central molecule is effectively bigger, which facilitates packing with the higher coordination number.
The Z16 polyhedron can be visualised as four triangles and four hexagons, capped with an additional molecule. The C–H bonds point to the cap of the hexagons. Furthermore, the Z16 clusters are organised on a structure (A2). The remaining 12 molecules (g2 sites) form a network of corner-sharing tetrahedra in the 12 tetrahedral interstices of the lattice .
Thus the mysterious 21 molecule Phase A is revealed as 13+8: the B2 structure with Me13Me8. The 29-molecule cell is revealed as 17+12: the A2 structure with Me17 with 12 filled tetrahedral interstitial sites. Curiously, the small distortions from cubic in Phase A are because the supermolecule in incompatible with cubic symmetry, whereas in Phase HP it is the interstitial molecules which are unstable in their high-symmetry configuration.
The near-spherical supermolecular objects are shown in figure 8.
III.5 Low Temperature Structures
Extensive structure searches [19, 14, 11] identify a set of zero-temperature stable structures that differ from those observed experimentally at finite temperatures. These calculations were initially done with PBE, but we have verified that the stability is independent of exchange-correlation functional, and whether the runs are done with or without van der Waals corrections.
By contrast, the lowest enthalpy structures have much more homogeneity in intermolecular spacing. In and all the molecules in the unit cell are symmetry-equivalent. In every molecule has four closest neighbours calculated at 2.743 Å(50GPa), arranged in a tetrahedron such that the C–H bond points away from the neighbours, but with a variety of dihedral angles. By contrast each molecule in has one nearest neighbour at 2.626 Å, with further neighbours at 2.745, 2.834, 2.839, and 2.910. The significantly shorter distance in is associated with eclipsed dihedral angles. This complexity arises from the wide range of enthalpies (bondlengths) for bonds with similar energy, and the impossibility of orienting molecules favourably with respect to all their neighbours.
Static lattice DFT finds lowest enthalpy for a structure below 5 GPa and a (the SnBr4 structure) between 5-40GPa. However, lattice dynamics calculations demonstrate that zero point energy is already enough to destabilize the structure with respect to at 25 GPa. At room temperature the HP structure, becomes stable. Lattice dynamics does not properly describe rotational behaviour, but this indicates the importance of entropy in determining stability.
We have investigated these phases, with further BOMD simulations of and CH4 supercells with 60 and 64 molecules respectively, as detailed in SM table. In this case, simulations were done at 20 GPa and the MSD of the simulations at K is shown in SM. After 15 ps, we increased the temperature of to 750 K and ran it for an extra 12 ps. The MSD of the final ps is shown in SM.
While the displacement of carbon seems small in both structures, a closer look at the trajectory reveals a change in symmetry in both cases. In the case of , the average carbon positions symmetrise to a sublattice (tolerance of 0.05 Å). The shift in atomic positions is clearly seen in SM. The larger displacements of carbons in methane do not result in a change to a high symmetry position, although the molecules reorient so as to exchange their hydrogen positions. On heating still further, to 750 K, the carbons will adopt a structure and we interpret this observation as a transition to a phase-I-like plastic phase within the constraints of the chosen BOMD cell. There are qualitative differences in between and . In both cases, both C and H start vibrating about their initial positions, and it takes about 2 ps for the molecules to reorient significantly. At that point, the monoclinic phase will become plastic in another 2–4 ps, much slower than the rhombohedral .
IV Discussion and Conclusions
We have combined extensive static DFT calculations with Born–Oppenheimer molecular dynamics (BOMD). The central outcome is that methane’s “complex” high-pressure phases are best understood as entropy-stabilised, frustrated packings of near-spherical multimolecule building blocks (supermolecules), rather than as straightforward orientational orderings of single CH4 molecules on a simple lattice.
Our novel ADF/Mollweide analysis reveals a range of molecular motions. In Phase I the molecules rotate freely, but strongly avoid certain directions. In Phase A we find a free rotor and rapid rotation between all 12 permutations. In phase B we find cases where one bond becomes locked, with rapid rotation around to the remaining three permutations. Also in Phase B, the molecules oscillate between two different orientations, as well as the multiple permutations.
In general, the rotations are facilitated by temperature and suppressed by pressure, giving rise to an onion-ring type phase diagram in good agreement with experiment. Curiously, the most stable zero-Kelvin DFT structures are completely different from the finite temperature ones. Calculations of rotational entropy precise and extensive enough to determine phase boundaries proved impossible with BOMD. The quasiharmonic approximation is clearly inappropriate for non-oscillating states, however low barriers to rotation are correlated with low curvature of the potential, so a phonon approximation can give qualitatively correct trends.
It is interesting that the observed classical “exchange” of hydrogen positions gives the correct structure, which indicates that a full quantum treatment of the protons is not required to understand the structures. Curiously, classical states have low free energy due to their high entropy, whereas the lowest energy quantum free rotor (J=0) is stabilised by low kinetic energy.
We also reconcile the long-standing mismatch between (i) low-temperature, minimum-enthalpy structures from structure searching and (ii) the experimentally observed finite-temperature phases of crystalline methane.
In Phase I, BOMD stabilises the experimentally observed carbon lattice via the high rotational entropy: (), with time-averaged cubic symmetry. Unusually, rather than hopping between well-defined orientations, the molecule rotates freely but does not access certain forbidden directions.
The symmetry of the methane molecule does not allow a simple orientational ordering on an lattice, subject to the general rule of steric hindrance: that hydrogen atoms should avoid one another. This leads to orientational frustration, for which the period-doubling/symmetry-breaking structure appears to be a good compromise which may be stable at low pressure and very low temperatures.
The complex structures of phases A and B have multiple different methane sites: this occurs to accommodate the wide range of bondlengths arising from different orientations.
Phase A is revealed as having R symmetry enabled by molecular orientation at the inversion centre. The icosahedral supermolecules pack in a simple cubic arrangement, very slightly distort due to the incompatibility of the icosahedral and cubic symmetry. We demonstrate that this structure is fully consistent with previous experimental data, even though it differs from previous interpretations of that data.
Phase B has cubic symmetry, based on a bcc stacking of Z16 supermolecules, the remaining molecules are in tetrahedral interstitial sites of bcc, disordered between two possible orientations. The HP phase forms when these ‘interstitial’ molecules order.
The different sites serve to allow space for some molecules to rotate at T, P conditions where rotation is severely hindered. Phase stability can thereby be attributed to some molecules having high entropy from rotation, while others have low enthalpy from preferential orientation. The sequence of transitions with decreasing T can then be understood as reducing the fraction of high entropy sites while increasing the fraction of short, low-enthalpy bonds.
The observed sluggishness of the transformations is also easily understood, since A and B are both large unit cells with incompatible numbers of atoms per cell. Under such circumstances, no simple transformation mechanism will exist and the transition can only proceed via nucleation and recrystallisation. This constraint does not seem to apply to the B-HP transition, which involves cessation of rotation in some of the sites in , but no major rearrangement of the molecular centres beyond a small martensitic distortion along one of the four (111) axes. While there is no major energy barrier between the phases, it is likely that in an experiment HP will contain many symmetry-related orientational domains. If these domains are smaller than the X-ray correlation length, they can lead to preferential suppression of the intensity of some diffraction peaks [17] which could be misinterpreted as disorder in the occupation of hydrogen sites.
To summarise, we have demonstrated that the DFT and experimental descriptions of high-pressure methane are consistent, once the weaknesses of each approach are properly accounted for. Specifically, naive structure searching plus quasiharmonic free energy calculation with DFT neglects the rotational entropy which is key to creating the onion-ring phase diagram. Conversely, diffraction averages over many unit cells and misses local correlations (e.g. C–H bonds not pointing at each other), and X-ray diffraction is unable to convincingly locate the hydrogen positions. The complex rearrangements required to transform between phases make determination of phase boundaries challenging: in experiment there is hysteresis and in calculation huge supercells are required to be compatible with two phases.
The major conceptual conclusion is that high-pressure methane is organised by packings of supermolecules. Phase A is built from a 13-molecule icosahedral cluster plus an 8-molecule cube-like motif (21=13+8), and Phase B/HP from a 17-molecule Z16 Frank–Kasper cluster plus 12 additional molecules in tetrahedral interstices (29=17+12 in the primitive setting). In this language, the “complex” phases reduce to familiar cubic Strukturbericht archetypes (B2/CsCl-like and A2/bcc-like) of clusters. The phase stability is controlled by a balance between site-resolved orientational entropy and accommodation of a range of bondlengths.
The explanation of the near-cubic structures highlights the advantages of describing the structures in terms of their multimolecular building blocks, in addition to symmetry analysis. It is likely that such an approach will be fruitful in other systems.
Supplementary Material
See the Supplementary Material for additional figures and simulation details.
Acknowledgements.
This work was supported by the ERC Advanced Grant HECATE, and by EPSRC via an eCSE award to MK. We thank ARCHER2 for access to computational resources. For the purpose of open access, the author has applied a Creative Commons Attribution (CC BY) licence to any Author Accepted Manuscript version arising from this submission.Author Declarations
Conflict of Interest
The authors have no conflicts to disclose.
Data Availability
The data that support the findings of this study will be deposited in the University of Edinburgh DataShare repository and made publicly available upon acceptance. During peer review, the data are available from the corresponding authors upon request.
References
- [1] (2018) Icosahedral () 13 supermolecule. Physical Review Materials 2 (9), pp. 093601. Cited by: §I.
- [2] (2020) Structures of solid hydrogen at 300 k. Physical Review B 101 (9), pp. 094104. Cited by: §I, §II.2.
- [3] (2024) Spglib: a software library for crystal symmetry search. Sci. Technol. Adv. Mater., Meth. 4 (1), pp. 2384822–2384836. External Links: Document, Link Cited by: §II.4.
- [4] (2019-04) Regularized scan functional. The Journal of Chemical Physics 150 (16), pp. 161101. External Links: ISSN 0021-9606, Document, Link Cited by: §II.1.
- [5] (1988-09) Density-functional exchange-energy approximation with correct asymptotic behavior. Phys. Rev. A 38, pp. 3098–3100. External Links: Document, Link Cited by: §II.1.
- [6] (1997-06) High-pressure infrared study of solid methane: phase diagram up to 30 gpa. Phys. Rev. B 55, pp. 14800–14809. External Links: Document, Link Cited by: §I, §I, §I, §I.
- [7] (1995-07) High pressure crystal phases of solid probed by fourier transform infrared spectroscopy. The Journal of Chemical Physics 103 (4), pp. 1353–1360. External Links: ISSN 0021-9606, Document, Link Cited by: §I.
- [8] (2018-01) Formation of -rich iodine-hydrogen compounds at high pressure. Phys. Rev. B 97, pp. 024111. External Links: Document, Link Cited by: §I.
- [9] (2020) Spontaneous crystallization in systems of binary hard sphere colloids. Physical Review Letters 124 (21), pp. 218003. Cited by: §I.
- [10] (1927) The crystal structure of -manganese. Proceedings of the Royal Society of London. Series A, Containing Papers of a Mathematical and Physical Character 115 (771), pp. 456–471. Cited by: §III.3.
- [11] (2021) Structural and vibrational properties of methane up to 71 gpa. Physical Review B 104 (18), pp. 184105. Cited by: §I, §II.1, §II.1, §III.1, §III.2.1, §III.3, §III.5.
- [12] (2025) Emergence of an icosahedral () 13 cluster inside a pure silica faujasite. The Journal of Physical Chemistry C 129 (14), pp. 7031–7039. Cited by: §I.
- [13] (2005) First principles methods using castep. Zeitschrift für Kristallographie - Crystalline Materials 220 (5-6), pp. 567–570. External Links: Link, Document Cited by: §II.1.
- [14] (2019) High pressure hydrocarbons revisited: from van der waals compounds to diamond. Geosciences 9 (5). External Links: Link, ISSN 2076-3263, Document Cited by: §II.1, §III.5.
- [15] (2022) Calculating the raman signal beyond perturbation theory for a diatomic molecular crystal. Computational Materials Science 210, pp. 111400. Cited by: §I, §II.3.
- [16] (2020) Raman signal from a hindered hydrogen rotor. Phys. Rev. B 102 (6), pp. 064102. Cited by: §I, §II.3.
- [17] (1993) Phase-transition-induced defect formation in iii-v semiconductors. Physical review letters 70 (6), pp. 814. Cited by: §IV.
- [18] (1993) The stability of the ab 13 crystal in a binary hard sphere system. Molecular physics 79 (1), pp. 105–120. Cited by: §I.
- [19] (2010-10) Dissociation of methane under high pressure. The Journal of Chemical Physics 133 (14), pp. 144508. External Links: ISSN 0021-9606, Document, Link Cited by: §II.1, §III.5.
- [20] (2008) Phase changes of solid methane under high pressure up to 86 gpa at room temperature. Chemical Physics Letters 454 (4-6), pp. 212–217. Cited by: §I.
- [21] (2024) Understanding solid nitrogen through molecular dynamics simulations with a machine-learning potential. Physical Review B 110 (18), pp. 184107. Cited by: §I, §I.
- [22] (1997) Solid molecular hydrogen: the broken symmetry phase. Physical review letters 78 (14), pp. 2783. Cited by: §I.
- [23] (1988-01) Development of the colle-salvetti correlation-energy formula into a functional of the electron density. Phys. Rev. B 37, pp. 785–789. External Links: Document, Link Cited by: §II.1.
- [24] (2013) Identification of high-pressure phases iii and iv in hydrogen: simulating raman spectra using molecular dynamics. Physical Review B—Condensed Matter and Materials Physics 87 (17), pp. 174110. Cited by: §I.
- [25] (2017) Infrared peak splitting from phonon localization in solid hydrogen. Physical review letters 118 (14), pp. 145701. Cited by: §I.
- [26] (2010-08) The distorted close-packed crystal structure of methane A. The Journal of Chemical Physics 133 (6), pp. 064504. External Links: ISSN 0021-9606, Document, Link Cited by: §I, Figure 4, §III.2.1.
- [27] (2014-12) The crystal structure of methane B at 8 GPa – an -mn arrangement of molecules. The Journal of Chemical Physics 141 (23), pp. 234313. External Links: ISSN 0021-9606, Document, Link Cited by: §I, Figure 7, §III.2.2, §III.2.3, §III.3.3, Table 1.
- [28] (1999) Structural studies of solid methane at high pressures. Chemical physics letters 302 (3-4), pp. 359–362. Cited by: §I.
- [29] (2020) Quantitative rotational to librational transition in dense and . The Journal of Physical Chemistry Letters 11 (16), pp. 6626–6631. Cited by: §I.
- [30] (1996-10) Generalized gradient approximation made simple. Phys. Rev. Lett. 77, pp. 3865–3868. External Links: Document, Link Cited by: §II.1.
- [31] (1970) A neutron diffraction study on solid methane in i. Physics Letters A 31 (5), pp. 253–254. External Links: ISSN 0375-9601, Document, Link Cited by: §I.
- [32] (1972) Structure and phase transitions of solid heavy methane (). The Journal of Chemical Physics 56 (6), pp. 2597–2609. Cited by: §I.
- [33] (2019) The effect of deuteration on the optical spectra of compressed methane. AIP Advances 9 (4). Cited by: §I.
- [34] (2005) Stability of the binary colloidal crystals ab 2 and ab 13. Physical Review E—Statistical, Nonlinear, and Soft Matter Physics 72 (3), pp. 031407. Cited by: §I.
- [35] (2001) Binary hard-sphere crystals with the cesium chloride structure. Physical Review E 64 (5), pp. 051403. Cited by: §I.
- [36] (2013) The molecular universe. Reviews of Modern Physics 85 (3), pp. 1021–1081. Cited by: §I.
- [37] (2001) EXPGUI, a graphical user interface for gsas. Applied Crystallography 34 (2), pp. 210–213. Cited by: §II.2.
- [38] (2002) X-ray diffraction measurements for solid methane at high pressures. Journal of Physics: Condensed Matter 14 (44), pp. 10675. Cited by: §I, Figure 7, §III.3.3.
- [39] (2025-11) Revisiting the phase diagram of methane. Phys. Rev. Lett., pp. –. External Links: Document, Link Cited by: §I.
- [40] (1995) High-pressure raman study of dense methane: and . Journal of Raman Spectroscopy 26 (10), pp. 963–967. Cited by: §I.