The MAMA-MIA Challenge: Advancing Generalizability and Fairness in Breast MRI Tumor Segmentation and Treatment Response Prediction
Abstract
Breast cancer is the most frequently diagnosed malignancy among women worldwide and a leading cause of cancer-related mortality. Dynamic contrast-enhanced magnetic resonance imaging plays a central role in tumor characterization and treatment monitoring, particularly in patients receiving neoadjuvant chemotherapy. However, existing artificial intelligence models for breast magnetic resonance imaging are often developed using single-center data and evaluated using aggregate performance metrics, limiting their generalizability and obscuring potential performance disparities across demographic subgroups. The MAMA-MIA Challenge was designed to address these limitations by introducing a large-scale benchmark that jointly evaluates primary tumor segmentation and prediction of pathologic complete response using pre-treatment magnetic resonance imaging only. The training cohort comprised 1,506 patients from multiple institutions in the United States, while evaluation was conducted on an external test set of 574 patients from three independent European centers to assess cross-continental and cross-institutional generalization. A unified scoring framework combined predictive performance with subgroup consistency across age, menopausal status, and breast density. Twenty-six international teams participated in the final evaluation phase. Results demonstrate substantial performance variability under external testing and reveal trade-offs between overall accuracy and subgroup fairness. The challenge provides standardized datasets, evaluation protocols, and public resources to promote the development of robust and equitable artificial intelligence systems for breast cancer imaging.
Magnetic resonance imaging, segmentation, pathologic complete response, benchmark, breast cancer, fairness, neoadjuvant chemotherapy.
1 Introduction
Breast cancer is the most frequently diagnosed cancer among women worldwide, with 2.3 million new cases reported in 2022 and persistent disparities in outcomes across regions and populations [1, 2]. Dynamic contrast-enhanced magnetic resonance imaging (DCE-MRI) plays a central role in tumor characterization and treatment monitoring, particularly in the neoadjuvant chemotherapy (NAC) setting [3, 4]. Pathological complete response (pCR) following NAC is a well-established surrogate marker of favorable long-term outcomes, motivating increasing interest in imaging-based pCR prediction from pre-treatment MRI [5].
Artificial intelligence (AI) methods have demonstrated strong potential for automating breast tumor segmentation and predicting treatment response from DCE-MRI [4, 6, 7]. However, most studies rely on single-center or homogeneous datasets, limiting generalization across imaging vendors, acquisition protocols, and geographic regions [8]. In addition, demographic and biological heterogeneity, including age, menopausal status, and breast density, influences MRI appearance and tumor conspicuity, yet is rarely considered during model evaluation. As a result, aggregate performance metrics may mask clinically relevant subgroup disparities, raising concerns regarding robustness, fairness, and clinical safety [9, 10].
To address these limitations, we introduce the MAMA-MIA Challenge, a large-scale benchmark for breast cancer analysis using DCE-MRI. The benchmark jointly evaluates (i) primary tumor segmentation and (ii) prediction of pathological complete response using pre-treatment imaging only. Models are trained on a large multi-institutional United States cohort and evaluated on an external European test set from three independent centers, enabling assessment of cross-continental and cross-institutional generalization. The evaluation framework further quantifies performance consistency across clinically relevant subgroups, explicitly incorporating fairness alongside predictive accuracy.
This work makes the following contributions:
-
•
A large-scale benchmark for breast DCE-MRI jointly evaluating tumor segmentation and pCR prediction.
-
•
A fairness-aware evaluation protocol assessing performance consistency across age, menopausal status, and breast density.
-
•
A comprehensive comparative analysis of submitted methods, identifying trends in model design, generalization behavior, and accuracy–fairness trade-offs.
-
•
A standardized and reproducible community resource including datasets, evaluation code, and reporting guidelines.
2 Related Work
We review prior work on breast tumor segmentation and pCR prediction from DCE-MRI, as well as recent advances in generalizability and fairness evaluation in medical imaging AI [4, 8]. We focus on representative approaches and benchmark limitations motivating standardized, subgroup-aware evaluation [11, 9, 12].
2.1 Breast Tumor Segmentation in DCE-MRI
Automatic tumor segmentation in DCE-MRI has transitioned from classical image-processing methods to deep learning–based approaches, particularly convolutional neural networks derived from the U-Net architecture [13, 14, 15, 7]. While reported performance has improved, many studies rely on limited single-center datasets and heterogeneous evaluation protocols, hindering reproducibility and assessment of cross-institutional generalization [11, 16].
2.2 Treatment Response Prediction from Breast MRI
Predicting pCR following NAC has been widely studied using radiomics-based models and, more recently, deep learning approaches [19, 20, 21, 8]. Although promising results have been reported, many studies lack rigorous external validation and instead rely on internal cross-validation, potentially overestimating generalizability [22, 11].
Moreover, demographic and biological factors influencing treatment response are often unevenly distributed across datasets, yet their impact on model performance is rarely analyzed systematically [23]. This limits insight into potential subgroup disparities and clinical reliability.
2.3 Generalizability and Fairness in Medical Imaging AI
Performance degradation under domain shift is well documented across medical imaging tasks [16, 24]. Several multi-center benchmarks have been proposed to promote robust model development [25, 26, 27]. In parallel, growing evidence shows that AI systems may exhibit systematic performance disparities across demographic groups [9, 28, 29].
However, fairness-aware evaluation remains uncommon in large-scale benchmarks, particularly in breast MRI. To date, no standardized benchmark has jointly evaluated tumor segmentation and treatment response prediction under explicit cross-institutional and subgroup-level assessment. This gap motivates the framework introduced in this work.
3 Methodology
This section describes (i) the benchmark design, (ii) task definitions and evaluation protocol, and (iii) a structured summary of participating methods.
3.1 Benchmark Overview
We define a benchmark framework for advancing computational methods in breast cancer analysis using dynamic contrast-enhanced magnetic resonance imaging (DCE-MRI). Participants were tasked with addressing two complementary objectives: (i) automatic segmentation of the primary breast tumor (Task 1) and (ii) prediction of pathologic complete response (pCR) to neoadjuvant chemotherapy (Task 2).
Model development and training relied on the publicly available MAMA-MIA dataset [6], which comprises large-scale, multi-center breast DCE-MRI data collected across 25 institutions in the United States with expert annotations. Submitted methods were evaluated on private validation and test datasets acquired from three independent European clinical centers in Spain, Poland and Lithuania. This design is to enable systematic assessment of cross-institutional generalizability and supports the analysis of performance disparities across clinically relevant demographic subgroups prone to exhibit systematic biases in breast imaging [30].
To this end, Table 1 summarizes the composition and key characteristics of the training, validation, and test cohorts.
| MAMA-MIA Dataset | Training | Validation / Testing | Total | |||||||
|---|---|---|---|---|---|---|---|---|---|---|
| Collection | NACT | ISPY1 | ISPY2 | DUKE | Sum | GUMED | KAUNO | HCB | Sum | Train+Val+Test |
| \rowcolorgray!5 Country | USA | USA | USA | USA | Poland | Lithuania | Spain | |||
| Year | 2002–06 | 2010–16 | 2000–14 | 1995–02 | 2010–20 | 2010–20 | 2010–20 | |||
| Clinical variables | ||||||||||
| \rowcolorgray!5 pCR Yes/No/N.A. | 11/53/0 | 49/118/4 | 316/664/0 | 64/216/11 | 440/1051/15 | 11/19/– | 71/161/– | 78/234/– | 160/414/– | 600/1465/15 |
| Tumor subtype Lum / TN / HER2enr HER2pure / N.A. | 21 / 11 / 8 6 / 18 | 67 / 45 / 25 29 / 5 | 536 / 358 / 86 0 / 0 | 123 / 85 / 50 30 / 3 | 747 / 499 / 169 65 / 26 | 11 / 9 / 3 7 / – | 95 / 71 / 39 27 / – | 209 / 43 / 49 11 / – | 315 / 123 / 91 45 / – | 1062 / 622 / 260 110 / 26 |
| \rowcolorgray!5 Age group 40/40–49/50–59 60–69/70/N.A. | 13/25/18 6/2/0 | 35/62/56 18/0/0 | 208/300/317 134/18/3 | 61/104/74 41/11/0 | 317/491/465 199/31/3 | 7/9/6 7/1/– | 21/51/54 61/45/– | 22/57/86 87/60/– | 50/117/146 155/106/– | 367/608/611 354/137/3 |
| Menopausal status Pre/Post/N.A. | 0/0/64 | 0/0/171 | 512/296/172 | 166/124/1 | 678/420/408 | 17/13/– | 73/159/– | 109/203/– | 199/375/– | 877/795/408 |
| Imaging variables | ||||||||||
| \rowcolorgray!5 Acq. Plane Axial/Sagittal | 0/64 | 0/171 | 980/0 | 291/0 | 1271/235 | 30/0 | 225/7 | 312/0 | 567/7 | 1838/242 |
| Field strength (T) 1.5/3.0 | 64/0 | 171/0 | 715/265 | 136/155 | 1086/420 | 30/0 | 27/205 | 283/29 | 340/234 | 1426/654 |
| \rowcolorgray!5 Fat suppressed Yes/No | 64/0 | 170/1 | 976/4 | 290/1 | 1500/6 | 30/0 | 232/0 | 312/0 | 574/0 | 2074/6 |
| Manufacturer Siemens/GE Philips | 0/64/0 | 44/115/12 | 252/611/117 | 115/176/0 | 411/966/129 | 30/0/0 | 27/0/205 | 96/216/0 | 153/216/205 | 564/1182/334 |
| \rowcolorgray!5 Slice thickness (mm) 1/1–1.49/1.5–1.99 2–2.49/2.5 | 0/0/0 64/0 | 0/0/5 83/83 | 11/163/8 695/103 | 0/283/4 3/1 | 11/446/17 845/187 | 0/30/0 0/0 | 27/0/196 9/0 | 0/2/36 272/2 | 27/32/232 281/2 | 38/478/249 1126/189 |
| Pixel spacing (mm) 0.5/0.5–0.99 1–1.49 | 2/62/0 | 15/150/6 | 2/939/39 | 0/274/17 | 19/1425/62 | 0/1/29 | 8/224/0 | 0/306/6 | 8/531/35 | 27/1956/97 |
| \rowcolorgray!5 Echo time (ms) 1–1.99/2–2.99 3 | 0/0/64 | 1/1/169 | 244/338/398 | 115/176/0 | 360/515/631 | 30/0/0 | 20/205/7 | 98/208/6 | 148/413/13 | 508/928/644 |
| Repetition time (ms) 3–3.99/4–4.99 5–5.99/6 | 0/0 0/64 | 0/0 1/170 | 1/226 218/535 | 32/116 116/27 | 33/342 335/796 | 30/0 0/0 | 0/223 2/7 | 0/269 34/9 | 30/492 36/16 | 63/834 371/812 |
| \rowcolorgray!5 Image size [x, y, z] Median | [256,256,60] | [256,256,60] | [512,512,80] | [512,512,170] | [512,512,80] | [352,352,160] | [528,528,187] | [512,512,82] | [512,512,112] | [512, 512, 80] |
| \rowcolorgray!5 Mean | [264,264,59] | [278,278,63] | [481,481,105] | [479,479,169] | [449,449,111] | [352,352,166] | [525,525,190] | [485,485,88] | [494,494,134] | [461,461,117] |
| \rowcolorgray!5 Std | [44,44,2] | [72,72,28] | [69,69,41] | [49,49,22] | [99,99,48] | [0,2,10] | [71,71,20] | [40,40,24] | [66,66,54] | [94,94,51] |
| Subjects | 64 | 171 | 980 | 291 | 1506 | 30 | 232 | 312 | 574 | 2080 |
3.1.1 Training Dataset
The training cohort was based on the publicly available MAMA-MIA dataset [6], which was respectively built for this purpose and encompassess a multi-center resource comprising 1,506 patients with pre-treatment T1-weighted DCE breast MRI examinations. As detailed in [6], the MAMA-MIA dataset aggregates and harmonizes data from multiple TCIA [31] collections, including ISPY-1 [32], ISPY-2 [33], NACT [34], and DUKE [35].
Expert annotations are provided for the training data, including voxel-wise primary tumor segmentation masks and bounding boxes indicating the affected breast. Relevant clinical metadata, such as age, menopausal status, and tumor subtype, are available for training to support subgroup analysis and bias-aware model development. This metadata is withheld at test time to ensure that evaluation relies exclusively on imaging data.
The training dataset further exhibits substantial heterogeneity in acquisition parameters. Data were acquired from multiple vendors (GE, Siemens, Philips) and field strengths (1.5T and 3T), reflecting substantial acquisition heterogeneity.
In addition to the MAMA-MIA dataset, participants were permitted to use any publicly available datasets released under CC-BY-NC or more permissive licenses for model training.
3.1.2 Validation and Testing Datasets
The validation and test datasets are private and consist of 574 fat-suppressed DCE-MRI examinations collected from three European clinical centers: Medical University of Gdansk (GUMED, Poland; 30 cases), Kauno Klinikos (KAUNO, Lithuania; 232 cases), and Hospital Clínic Barcelona (HCB, Spain; 312 cases).
Imaging was predominantly acquired in the axial plane (98.8%), with a small proportion in the sagittal plane (1.2%). Scans were obtained using 1.5T (59.2%) and 3T (40.8%) systems across multiple vendors, including Siemens (26.7%), GE (37.6%), and Philips (35.7%).
The dataset was split into a validation set of 58 cases and a held-out test set of 516 cases. Splitting was stratified by center, age, breast density, and menopausal status to ensure well-balanced representation in test and validation across these clinically relevant subgroups.
3.2 Annotation Protocol
3.2.1 Training Dataset
For the training data, the primary tumor was annotated on the first post-contrast DCE-MRI volume as follows. An initial automatic segmentation was generated using a baseline nnU-Net model [14] and subsequently refined through expert radiologist review. During this review, manual corrections were performed by a panel of 16 expert clinicians from 10 institutions across Europe, Asia, and Africa. Further details regarding annotation guidelines and quality control procedures are provided in the respective MAMA-MIA dataset publication [6].
3.2.2 Validation and Testing Datasets
Primary tumor segmentations for the validation and test datasets were produced by four expert clinicians from the corresponding clinical centers (GUMED, KAUNO, and HCB). Expert segmentations were performed using a collaborative annotation platform with semi-automatic tools to ensure consistency.
3.3 Data Preprocessing
All training, validation, and test cases underwent standardized preprocessing to ensure consistent data handling across sites. Raw DICOM files were converted to NIfTI format using the pycad library [36]. Dataset harmonization included quality control to remove scans with artifacts or incomplete sequences, extraction of relevant metadata, and enforcement of a uniform naming convention and folder structure [6].
Image orientation was standardized to preserve anatomical consistency: sagittal acquisitions were reoriented to the posterior–superior–right (PSR) coordinate system, and axial acquisitions to the left–anterior–superior (LAS) system. No additional preprocessing steps, such as intensity normalization, bias field correction, or voxel resampling, were enforced at the benchmark level. This design choice avoids introducing assumptions that may favor specific modeling strategies and allows participants to apply task-specific preprocessing tailored to their methods.
3.4 Benchmark Setup
All submissions were evaluated automatically using a standardized Python-based evaluation pipeline executed within a containerized environment on the CodaBench platform [37]. Participants were required to submit a single .zip archive containing source code and any required model weights, following a predefined submission template to ensure reproducibility and fair comparison.
The MAMA-MIA benchmark challenge was organized in multiple phases. An initial Sanity-Check phase was used to validate submission formatting and code execution. This was followed by a validation phase, during which teams were limited to one submission per day, with a maximum of 15 submissions per team, to mitigate overfitting. The benchmark concluded with a final test phase, in which performance was assessed on a held-out test set and only a single submission per team was permitted. All evaluations were executed locally on a Linux system equipped with an NVIDIA GeForce RTX 3090 GPU with 24 GB of memory.
The benchmark challenge was initially introduced in conjunction with the MICCAI 2025 conference [38], where it was hosted as part of the 2nd Deep-Breath Workshop [39]. The challenge website, documentation, and resources are publicly available at https://www.ub.edu/mama-mia, and the benchmark remains active on the CodaBench platform111https://www.codabench.org/competitions/7425/.
3.5 Evaluation
Participants were encouraged to participate in both tasks: primary tumor segmentation (Task 1) and pathologic complete response (pCR) prediction (Task 2). Although the tasks differ in nature, both were evaluated using a unified scoring framework that jointly accounts for predictive performance and algorithmic fairness across clinically relevant demographic subgroups.
3.5.1 Unified Scoring Framework
For each task, submissions were ranked using a composite score that integrates task-specific predictive performance with fairness:
| (1) |
where denotes the performance score, the fairness score, and controls the trade-off between the two. In this benchmark, we set , assigning equal importance to predictive accuracy and fairness.
Fairness was evaluated across a shared set of demographic variables:
| (2) |
For each fairness variable , let denote the set of subgroups induced by .
| (3a) | ||||
| (3b) | ||||
| (3c) | ||||
This formulation incentivizes models to achieve consistent performance across subgroups of fairness variables rather than optimizing for average accuracy alone.
3.5.2 Task 1: Primary Tumor Segmentation
Segmentation performance was assessed using two complementary metrics: the Dice Similarity Coefficient (DSC) and the normalized Hausdorff Distance (NormHD). The performance score is defined as:
| (4a) | ||||
| DSC | (4b) | |||
| NormHD | (4c) | |||
where are the total number of evaluated cases, and denote the predicted and ground-truth segmentations for case , respectively, and mm.
Additionally, for a given performance metric , we denote by the average value of computed over all samples belonging to subgroup , defined in Equation 3. The disparity associated with fairness variable is then computed as,
| (5a) | ||||
| The fairness score for segmentation over all fairness variables is computed as: | ||||
| (5b) | ||||
Empty segmentations were handled by assigning a DSC of 0 and a Hausdorff Distance of , accounting for incorrect or missing predictions in bilateral breast images. The value of was derived from the maximum distance observed in the automatic segmentation baseline.
3.5.3 Task 2: Pathologic Complete Response Prediction
Classification performance was evaluated using Balanced Accuracy (BA), defined as:
| TPR | (6a) | |||
| TNR | (6b) | |||
| (6c) | ||||
where and denote the sets of positive and negative samples, respectively. The classification fairness score was defined using an Equalized Odds–based criterion. For each variable :
| (7a) | ||||
| (7b) | ||||
| (7c) | ||||
| (7d) | ||||
This formulation rewards classifiers that maintain consistent error rates across demographic subgroups. Submissions producing constant predictions (e.g., all zeros or all ones) were considered invalid and excluded from evaluation.
3.6 Baselines
For Task 1 (primary tumor segmentation), the baseline model was a 3D nnUNet trained on the 1,506 DCE-MRI volumes with expert annotations from the MAMA-MIA dataset[6]. Given nnUNet’s widespread adoption in medical image segmentation benchmarks, this baseline provides a strong reference point while encouraging participants to explore novel architectures and learning strategies.
For Task 2 (pCR prediction), the baseline was a random classifier assigning labels uniformly at random. This model establishes a lower bound on performance and allows participants to quantify the added value of their imaging-driven predictive models.
3.7 Participating Methods
A total of 26 teams from 14 countries submitted valid entries to the final test phase of the benchmark. This section provides a structured overview of the participating methods for each task, with the goal of characterizing the methodological space explored by the community rather than exhaustively describing individual implementations. For each task, we summarize common design choices and methodological trends, followed by concise technical descriptions of the top-ranked approaches. Detailed architectural, preprocessing, and training configurations are reported in Tables 2 and 3.
|
❶ |
❷ FME |
❸ |
❹ |
❺ |
|||||||||||
| Preprocessing Strategy | |||||||||||||||
| resample |
|
|
|
|
|
||||||||||
| crop or pad | × | × | breast bbox | breast bbox |
|
||||||||||
| reorient | × | × | × | RAS | RAS | ||||||||||
| intensity clipping | × | × |
|
|
× | ||||||||||
| normalize | z-score | z-score | z-score | min-max |
|
||||||||||
| Training Strategy | |||||||||||||||
| DCE phases | p0, p1, p2 | s1 | p0, p1, p2 | p0, p1, px | p0, p1, p2 | ||||||||||
| network |
|
|
|
3D ViT | 3D UNet | ||||||||||
| pretrained | ✓ | × | × | ✓ | × | ||||||||||
| optimizer | SGD | SGD | SGD | AdamW | AdamW | ||||||||||
| batch size | 3 | 2 | 3 | 8 | 1 | ||||||||||
| loss | Soft Dice | CE + Dice | CE + Dice | CE + Dice | Focal | ||||||||||
| epochs / iterations | 10K | 1000 | 1000 | 30K | 200 | ||||||||||
| Inference Strategy | |||||||||||||||
| ensemble | 5-fold | 5-fold | n/a | 2 folds (space limit) | n/a | ||||||||||
| post-processing | breast bbox |
|
n/a | n/a | breast bbox |
3.7.1 Task 1: Primary Tumor Segmentation
The primary tumor segmentation task attracted a diverse set of approaches that, nevertheless, shared several common design principles. A comparative summary of the top five segmentation methods is provided in Table 2. All approaches employ fully three-dimensional architectures operating directly on volumetric DCE-MRI data, reflecting the importance of spatial context for accurate tumor delineation. Input standardization through resampling and intensity normalization was consistently adopted, while voxel spacing, interpolation strategies, and normalization schemes varied across teams.
Most methods incorporated multiple DCE phases as input channels, typically including the pre-contrast and one or more early post-contrast acquisitions, in order to capture tumor enhancement dynamics. Architecturally, the majority of approaches were based on nnU-Net variants, including residual encoder configurations, while one method explored a 3D Vision Transformer backbone. Inference strategies frequently relied on ensembling across cross-validation folds, and several methods applied lightweight post-processing steps to suppress anatomically implausible segmentations.
❶
MIC: The MIC team proposed a residual-encoder nnU-Net with large-scale self-supervised pretraining on external DCE-MRI data [40]. A masked autoencoding strategy was used to pretrain on public DCE-MRI volumes, followed by fine-tuning on the MAMA-MIA dataset [6]. Multi-phase input and five-fold ensembling were combined with breast-bounding-box post-processing to improve robustness and subgroup consistency. Further details are reported in [41].
❷
FME The FME team adopted a robustness-oriented strategy based on a single subtraction image (first post-contrast minus pre-contrast) to reduce sensitivity to acquisition variability. A five-fold ensemble of 3D residual-encoder nnU-Nets was trained, complemented by axis flipping test time augmentation and largest connected component filtering. This design prioritized generalization and stability across unseen centers.
❸
ViCOROB The ViCOROB team, as described in [42], employed a residual-encoder architecture using three representative DCE phases selected to preserve early enhancement kinetics [17]. Breast-level cropping focused on the tumor-containing region, eliminating contralateral interference and improving signal-to-noise ratio. To enhance robustness across multi-center data, percentile-based intensity clipping, isotropic resampling, and z-score normalization were applied to standardize inputs.
❹
Martel Lab The Martel Lab introduced a joint learning framework that simultaneously performs tumor segmentation and pCR prediction using a shared encoder. A 3D Vision Transformer[43] pretrained on large-scale medical imaging data [44] was combined with temporal attention modules to model contrast enhancement dynamics across multiple DCE phases within an end-to-end multi-task architecture.
❺
AIH-MAMA The AIH-MAMA team applied FairMedSeg [45], a fairness-aware segmentation framework that integrates subgroup performance divergence directly into the training objective. Clinically relevant subgroups were identified using DivExplorer [46], and sample reweighting was used to mitigate performance disparities without requiring subgroup metadata at inference time [47].
|
① |
② FME |
③ |
|||||||
| Preprocessing | |||||||||
| resample | varying per model |
|
|||||||
| crop / pad | lesion bbox | lesion bbox | × | ||||||
| reorient | × | × | × | ||||||
| clip | × | × | × | ||||||
| normalize | z-score | z-score | z-score | ||||||
| Training Strategy | |||||||||
| DCE phases |
|
p0, p1, p2 | p0, p1, p2 | ||||||
| network |
|
|
|
||||||
| pretrained | × | ✓ | × | ||||||
| optimizer | AdamW | AdamW |
|
||||||
| batch size | 48 | [16, 32] |
|
||||||
| loss | CE + NT-Xent | BCE |
|
||||||
| epochs | 200 | 25 |
|
||||||
| Inference Strategy | |||||||||
| ensemble | 2 models |
|
-
•
AI Strollers combined two models: a segmentation model for feature extraction (black) and a pCR prediction model (gray).
3.7.2 Task 2: Pathologic Complete Response Prediction
For the pCR prediction task, participating methods explored complementary strategies for modeling treatment response from pre-treatment DCE-MRI. Table 3 summarizes the key technical characteristics of the top three classification approaches. All methods formulated pCR prediction as a supervised binary classification problem, but differed substantially in how imaging information was represented and exploited.
Two approaches adopted lesion-centered, end-to-end 3D classification pipelines, extracting fixed-size regions-of-interest around the primary tumor. These methods varied in their handling of temporal information, either treating multiple post-contrast phases as separate input channels or using phase selection and augmentation strategies. In contrast, one approach decoupled segmentation and classification by reusing deep features extracted from a pretrained segmentation network.
①
pimed-lab The pimed-lab team formulated pCR prediction as a lesion-centered 3D classification task and adopted a hybrid supervision strategy combining self-supervised learning through a 3D SimCLR [48] objective early in training, gradually transitioning to supervised learning once robust features had been learned. Two 3D convolutional architectures [49, 50] were trained and ensembled to improve feature learning and generalization under limited labeled data.
②
FME The FME team employed pretrained 3D video classification architectures [51] operating on lesion-centered multi-phase DCE-MRI inputs. Hyperparameters were optimized using Ray Tune [52] via cross-validation, and model selection explicitly considered a composite score balancing predictive performance and subgroup fairness. A large ensemble and test time augmentation were used at inference to improve robustness.
③
AI Strollers The AI Strollers team proposed a modular pipeline in which deep features were extracted from a pretrained segmentation network based on parameter-efficient SegRestNet [15]. These features were subsequently used to train an XGBoost classifier [53], decoupling voxel-level segmentation learning from patient-level response prediction.

4 Results
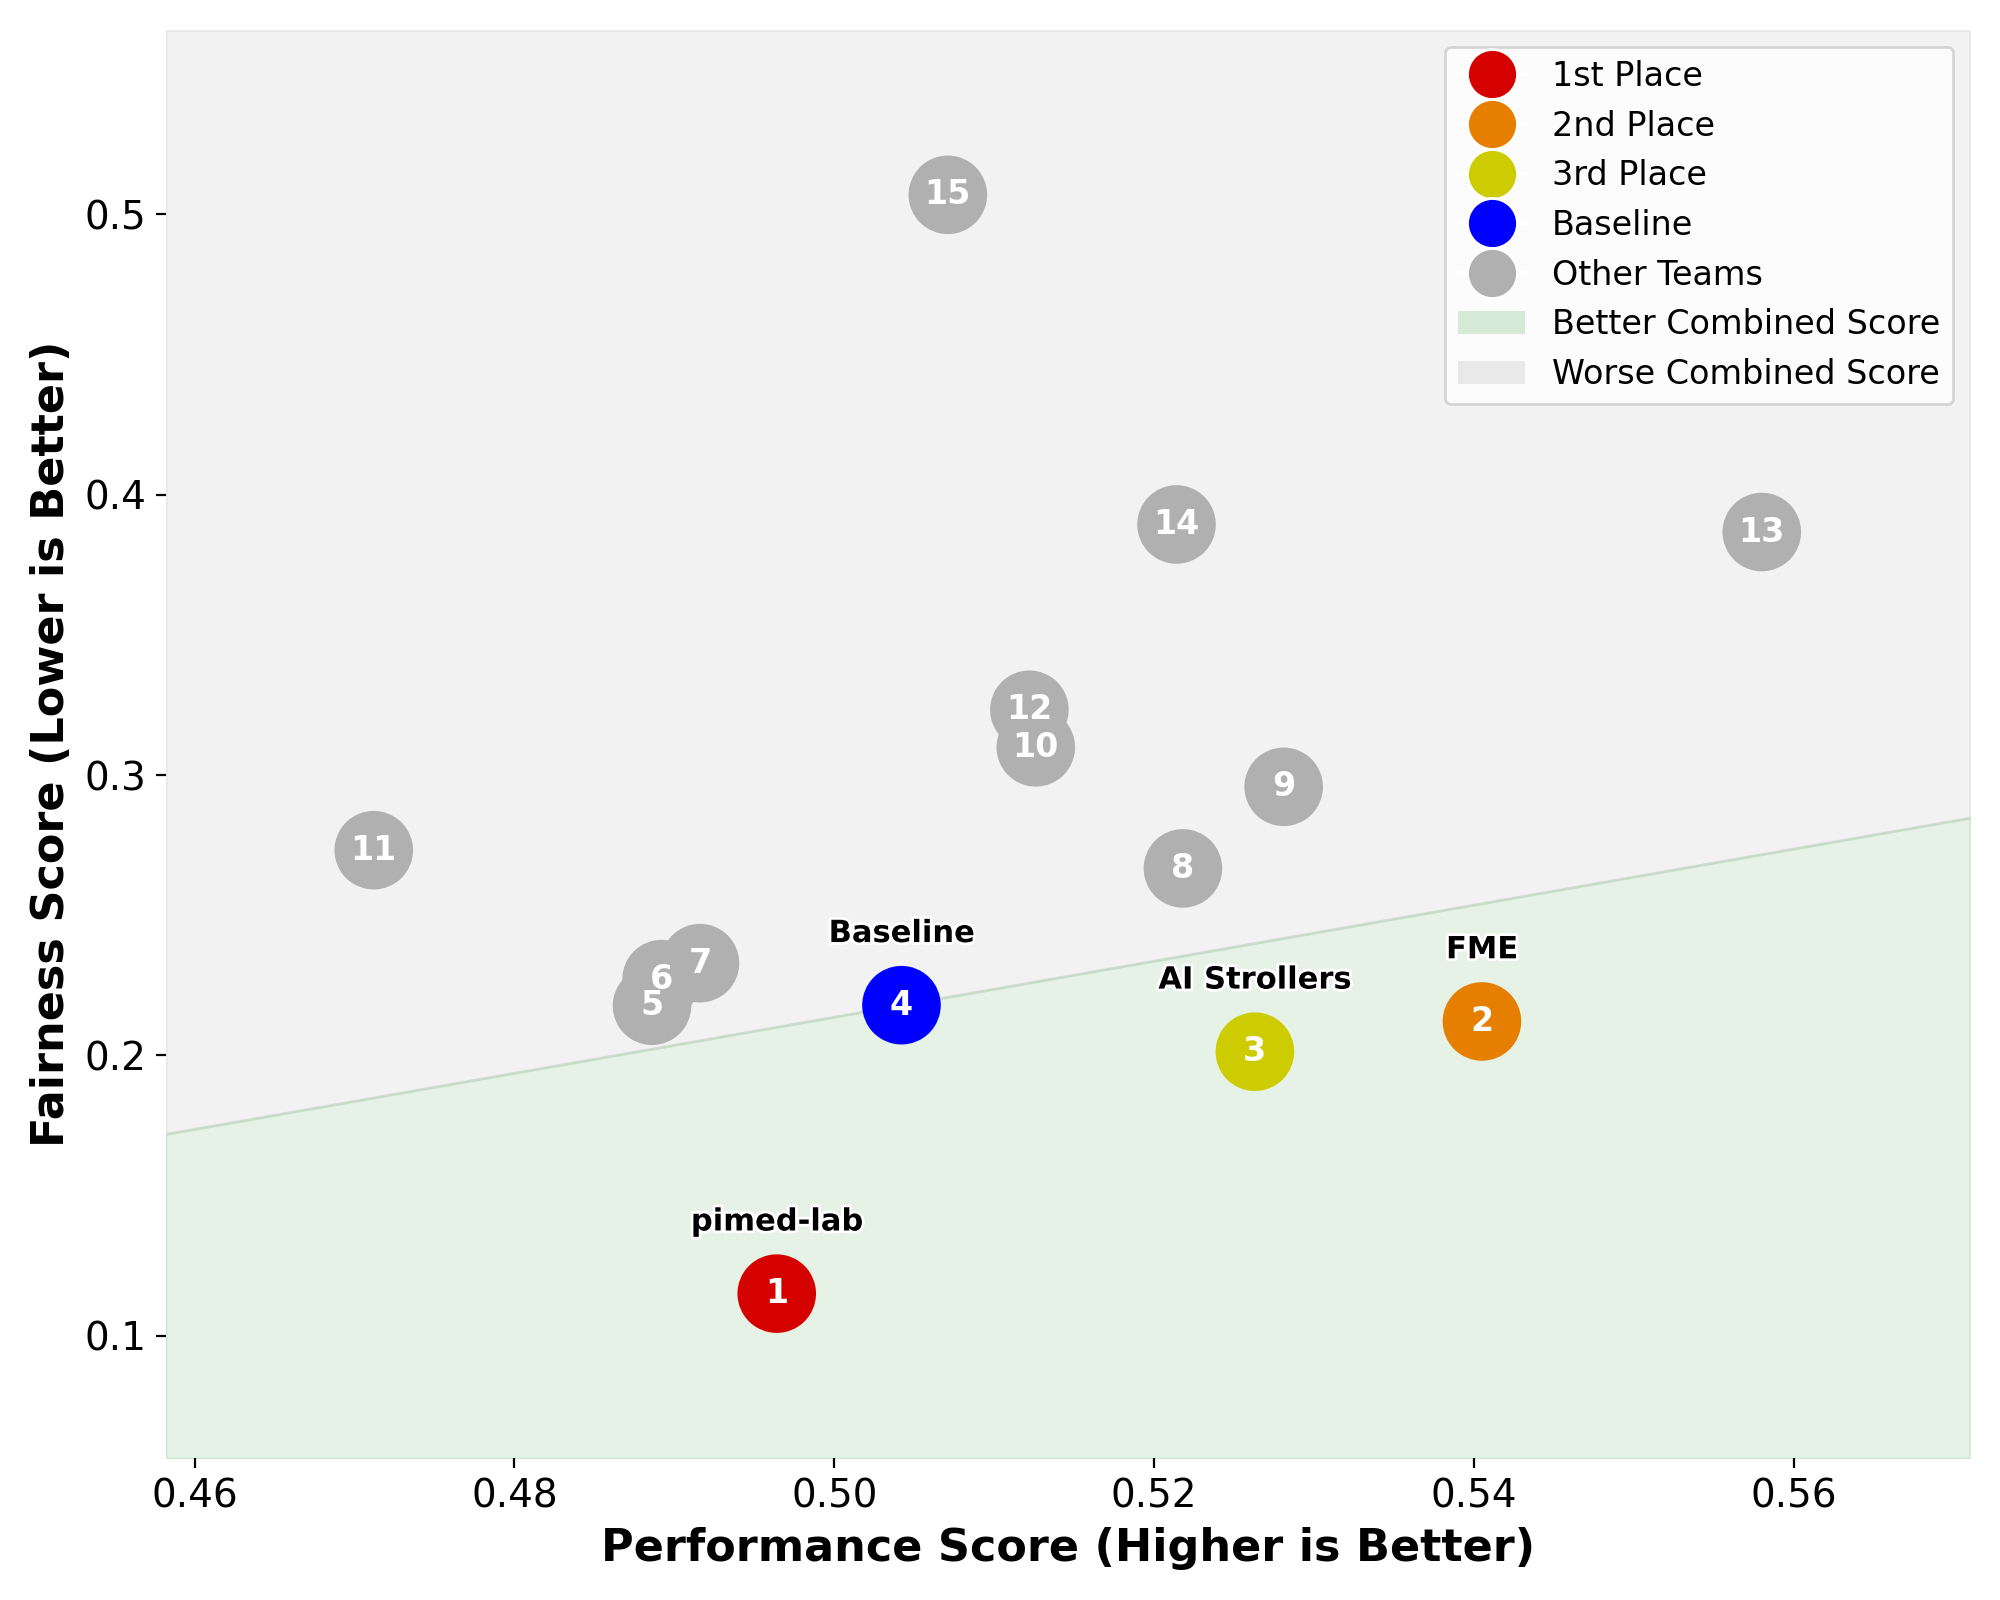
This section presents and analyzes the results obtained by the participating teams. As shown in Figure 1, 12 teams outperformed the baseline in both fairness and performance for Task 1 (1(a)). In Task 2 (1(b)), only three teams demonstrated improvements over the baseline; all three improved fairness, while only two also achieved higher-than-baseline performance. The results for each task are presented in the following dedicated subsections.
| Rank | Team | Combined Score | Fairness Score | Performance Score | DSC | NormHD |
|---|---|---|---|---|---|---|
| 1 | MIC | |||||
| 2 | FME | |||||
| 3 | ViCOROB | |||||
| 4 | Martel Lab | |||||
| 5 | AIH-Mama | * | ||||
| 6 | HWT@YCH | |||||
| 7 | Flamingo | * | ||||
| 8 | CALADAN | * | ||||
| 9 | bigAI | * | ||||
| 10 | Shangqi,Gao@CAM | |||||
| 11 | GK_KI | |||||
| 12 | Jeff | * | ||||
| 13 | Baseline | |||||
| 14 | Dynamo | * | * | |||
| 15 | PM | * | * | |||
| 16 | AEHRC-MIA | * | * | |||
| 17 | AI Strollers | * | ||||
| 18 | MedImgLab_Unipa | |||||
| 19 | FPixel | |||||
| 20 | BWS-KNU | |||||
| 21 | CIG@Illinois |
-
*
DSC and NormHD not statistically different from the baseline according to a paired -test. All other values are significantly different ().
4.1 Task 1: Primary Tumor Segmentation
Table 4 summarizes final rankings. The top five teams improved over the baseline by 0.43–4.89% DSC, with concurrent fairness gains (), indicating consistent performance improvements across subgroups.
Qualitative analysis (Fig. 7) shows strong performance for well-circumscribed mass lesions, while failures are concentrated in small, non-mass, low-contrast tumors and implant-associated artifacts. These cases exhibit high inter-method variability, indicating sensitivity to ambiguous morphology.
This variability is consistent with the analysis shown in Figure 3, which indicates that smaller tumors achieve lower average DSC compared to moderate and large tumors. Notably, the performance gap between the top five and bottom five methods is largest for small tumors, suggesting that top-performing approaches yield the greatest relative improvements in this particularly challenging regime. Tumor size also influences performance across centers. Overall DSC varies by center, with the highest performance observed for GUM, followed by KAU and HCB, as shown in Figure 2. This trend may be partly explained by differences in tumor size distributions across centers: centers with a higher proportion of small tumors, most notably KAU and HCB, tend to exhibit lower DSC.
Finally, the fairness analysis shown in Figure 4 demonstrates that the top five teams consistently achieved higher average DSC than the bottom five across all subgroups. Performance was largely comparable across subgroups defined by breast density, age, and menopausal status, with no systematic subgroup-specific differences observed. This suggests a high degree of fairness and robustness in the analyzed methods with respect to these patient characteristics.


4.2 Task 2: Pathologic Complete Response Prediction
Table 5 summarizes the final rankings for pCR prediction. The top three teams achieved combined scores of 0.6907, 0.6642, and 0.6625, compared to 0.6431 for the baseline model. Notably, top three submissions did not substantially outperform the baseline in performance score alone.
Only one team (PM) achieved performance significantly different from random prediction (), while FME showed marginal significance (). All other methods were statistically indistinguishable from random performance (), underscoring the intrinsic difficulty of pCR prediction from pre-treatment MRI.
Clear performance–fairness trade-offs were observed. While PM obtained the highest performance score (0.5580), it exhibited the largest fairness gap (0.3867), resulting in a lower combined score (rank 13). In contrast, the top-ranked teams achieved competitive performance with substantially improved fairness, indicating more balanced subgroup behavior.
In all submissions, recall for the pCR class was generally low (Figure 5), suggesting conservative prediction strategies and limited sensitivity to complete responders. This likely reflects both class imbalance and the inherent heterogeneity of treatment response patterns.
Analysis of the calibration curves for the top three methods (Figure 6) reveals limited separation in the predicted probabilities, which are predominantly clustered around the overall class prevalence. Although there are slight differences in the dispersion of predicted probabilities across methods, all curves lie below the diagonal reference line, suggesting systematic overconfidence in their predictions.
Overall, Task 2 results demonstrate that fairness-aware evaluation significantly altered leaderboard rankings, favoring models with balanced subgroup performance rather than isolated performance gains. The findings highlight the complexity of pCR prediction and the need for more robust modeling strategies and richer feature integration.


| Rank | Team | Combined Score | Fairness Score | Performance Score |
|---|---|---|---|---|
| 1 | pimed-lab | 0.6907 | 0.1150 | 0.4964 |
| 2 | FME | 0.6642 | 0.2121 | 0.5405+ |
| 3 | AI Strollers | 0.6625 | 0.2013 | 0.5263 |
| 4 | Baseline | 0.6431 | 0.2179 | 0.5042 |
| 5 | BWS-KNU | 0.6355 | 0.2177 | 0.4886 |
| 6 | Martel Lab | 0.6310 | 0.2272 | 0.4892 |
| 7 | Flamingo | 0.6293 | 0.2329 | 0.4916 |
| 8 | AEHRC-MIA | 0.6275 | 0.2667 | 0.5218 |
| 9 | Jeff | 0.6162 | 0.2958 | 0.5281 |
| 10 | MIC | 0.6013 | 0.3099 | 0.5126 |
| 11 | CALADAN | 0.5990 | 0.2732 | 0.4712 |
| 12 | HWT@YCH | 0.5945 | 0.3233 | 0.5122 |
| 13 | PM | 0.5856 | 0.3867 | 0.5580* |
| 14 | ViCOROB | 0.5660 | 0.3894 | 0.5214 |
| 15 | bigAI | 0.5001 | 0.5070 | 0.5071 |
-
*
Balanced accuracy significantly higher than a random classifier based on 1000 random simulations ().
-
+
Marginally higher than random ().
-
All other methods showed no statistically significant difference from random ().

5 Discussion and Future Work
Moving beyond single-institution studies, the MAMA-MIA Challenge was designed as a real-world stress test for AI in breast MRI, explicitly evaluating generalization to unseen clinical sites and consistency across patient subgroups. We synthesize outcomes across primary tumor segmentation and pretreatment pCR prediction, analyzing performance trends, failure modes, and fairness behavior. As MAMA-MIA evolves from a one-time competition into a standardized benchmark with unified accuracy–fairness evaluation, we discuss implications for evaluation, clinical translation, and future research aimed at improving robustness and clinical relevance.
5.1 Robustness of Primary Tumor Segmentation
Primary tumor segmentation attracted 20 valid submissions to the final test phase, reflecting both its clinical relevance and methodological maturity. Under cross-continental evaluation, most top-performing methods improved over the nnU-Net [14, 6] baseline in both accuracy and subgroup consistency, indicating that contemporary 3D pipelines generalize reasonably well to unseen centers and heterogeneous acquisition protocols.
Methodologically, submissions showed strong convergence toward robustness-oriented design choices. All top five methods relied on fully 3D architectures, predominantly nnU-Net variants, with one exception adopting a 3D Vision Transformer backbone (Table II). Ensemble-based inference was employed by four of the top five teams, together with standardized resampling and intensity normalization, highlighting the importance of variance reduction under cross-center deployment. With respect to input representation, four of the five top-ranked methods incorporated multiple DCE phases to explicitly model contrast enhancement dynamics, whereas only one method (e.g., FME) relied exclusively on a single subtraction image. While both strategies yielded competitive performance, no input design consistently mitigated failures in small, non-mass, or low-contrast lesions, suggesting that current gains stem from incremental robustness improvements rather than fundamentally distinct paradigms.
Performance varied with tumor size (Fig. 3), with small tumors remaining challenging even for top-performing methods and accounting for the largest gap between top- and bottom-ranked teams (mean DSC delta 0.38 between averaged top 5 and bottom 5). Stability increased with tumor size both within and across performance tiers (e.g., mean DSC delta 0.12 for large tumors), indicating that leaderboard separation is largely driven by a method’s ability to handle small, fragmented, or visually ambiguous lesions rather than larger cases.
Qualitative analysis (Fig. 7) corroborates these failure modes, including non-mass enhancement, weak lesion–background contrast, implant-related artifacts, and small or fragmented lesions. Substantial inter-method variability in such cases highlights model design trade-offs and the limitations of voxel-level overlap metrics in capturing clinically relevant uncertainty. Together, these findings indicate readiness for multi-center deployment in common scenarios, while motivating uncertainty-aware or interactive strategies for challenging lesions.
5.2 Challenges in Pretreatment pCR Prediction
In contrast, pretreatment pCR prediction from baseline DCE-MRI proved substantially more challenging. Across 14 submissions, performance gains over the random baseline were marginal, rarely statistically significant, and often driven by fairness rather than discriminative accuracy (Table 5). Most models struggled with class imbalance and asymmetric recall, frequently defaulting to majority-class predictions while failing to reliably identify true pCR cases. Calibration analysis (Figure 6) revealed limited probability separation and systematic overconfidence, suggesting reliance on weak imaging cues rather than robust response-related biomarkers.
Participating approaches included lesion-centered end-to-end classifiers and pipelines leveraging segmentation-derived features, yet no clear relationship emerged between segmentation quality and pCR performance. Accurate tumor delineation did not translate into reliable response prediction, indicating that the primary limitation lies in response representation learning rather than segmentation. While one team (AI Strollers) reused Task 1 features within an XGBoost classifier, the top three submissions on Task 2 generally addressed segmentation and response prediction as separate modeling problems, without employing a unified multi-task framework with shared feature representations. This separation suggests that improvements in joint representation learning across tasks may offer a more promising direction than optimizing each task independently.
In the absence of longitudinal imaging (e.g., pre-, mid-, and post-therapy), temporal information was restricted to contrast dynamics within DCE acquisition. All top-ranked methods incorporated multiple contrast phases (Table 3), but differed in modeling strategy: two applied end-to-end deep learning to multi-phase inputs, while one used segmentation-derived features followed by a separate classifier, resulting in only implicit temporal modeling.
Overall, a substantial gap remains between the perceived maturity of imaging-based pCR prediction and its readiness for clinical deployment. Despite encouraging results in isolated or single-center studies [54, 11, 55, 8, 22, 19], pretreatment prediction from baseline DCE-MRI alone proved unreliable in the multi-center setting. While fairness-aware evaluation promotes equitable behavior, improved equity cannot compensate for insufficient discriminative signal at pretreatment time. Progress will likely require moving beyond binary outcome supervision toward continuous targets (e.g., tumor shrinkage or time-to-recovery) and incorporating longitudinal, contextual, and uncertainty-aware modeling strategies.
5.3 On Subgroup Fairness as Challenge Objective
Participating teams varied in how explicitly fairness was addressed during model development, with most submissions optimizing predictive performance and assessing fairness post-hoc through benchmark evaluation. A notable exception was the work from participant AIH-MAMA (FairMedSeg), which explicitly integrated subgroup fairness into their segmentation objective by penalizing performance gaps between subgroups during training. Other teams such as FME and MIC adopted robustness-oriented strategies, such as subtraction-based inputs or large-scale self-supervised pretraining and augmentation, thereby indirectly promoting more consistent performance across subgroups.
Considering the pCR prediction, the results indicate that fairness considerations are meaningful primarily once a minimum level of predictive performance is achieved. As illustrated in Fig. 1(b), low-performing models may appear particularly fair due to uniformly low predictions across subgroups, whereas fairness becomes a relevant and discriminative criterion only among models with competitive performance. This suggests that future benchmark editions are to consider adaptive weighting schemes in which fairness is emphasized more strongly the higher the performance of a downstream task model, thus aligning fairness incentives with clinical utility.
In this regard, the impact of the fairness weighting parameter further highlights the normative nature of weighting the importance of subgroup fairness. As exemplified in Fig. 8, leaderboard rankings for both tasks change substantially as varies, reflecting the question of tradeoff and prioritization between predictive accuracy and subgroup fairness. For pCR prediction, setting (i.e., ignoring fairness) results in participant PM moving from rank 13 out of 15 to rank 1, while only one (FME) of the top three teams at remains in the top tier. Even modest increases in lead to substantial reordering: at , 6 out of 15 teams change rank, and at , 13 out of 15 teams are affected. In contrast, segmentation rankings exhibit greater stability under changes in , with the top three teams preserved across the full range, although lower-ranked positions still shift (e.g., 8 out of 23 teams change rank at ).
Taken together, these findings emphasize that fairness-aware benchmarking does not yield a single "correct" ranking, but instead exposes trade-offs that depend on institutional values, regulatory expectations, and clinical risk tolerance. By making these trade-offs explicit and adjustable, MAMA-MIA provides a transparent framework for interrogating how fairness objectives interact with performance across tasks of differing maturity.
We further note limitations of basing subgroup fairness on the differences between the means of performance metrics, as averaging subgroup performance can obscure relevant variability. For instance, models with similar mean fairness scores can exhibit substantially different, and likely undesirable, variability across subgroups. Moreover, mean-based across subgroups gaps can, in principle, be reduced by degrading performance in the highest-performing subgroup rather than by improving underperforming ones. This motivates future consideration of incorporating maximum-performance-based and variance–based measures to provide complementary insight into the robustness and reliability of reported fairness measures, particularly under heterogeneous subgroup sizes or outcome prevalence.
An additional challenge arises when a fairness variable also carries genuine predictive signal. Variables such as age [56] and menopausal status [57] can be, potentially causally, correlated with response to neoadjuvant therapy, whereby subgroup performance differences may not indicate algorithmic bias, but can instead reflect true differences in outcome prevalence, risk distribution, data imbalance, or subgroup-specific levels of clinical uncertainty with different achievable performance ceilings. Enforcing strict invariance of fairness attributes with predictive value across subgroups can, therefore, potentially suppress clinically meaningful information. Furthermore, when subgroup fairness becomes a model optimization objective, AI alignment dynamics can arise, in which a model can silently degrade performance in well-performing (privileged) groups rather than improving outcomes for underperforming subgroups, underscoring the need to carefully preassess and audit fairness interventions.
5.3.1 Modality Expansion and Knowledge Integration
Future progress in imaging-based response prediction will likely require rethinking both prediction targets and available inputs. Moving beyond binary pCR labels toward continuous measures such as tumor volume change, residual burden, or time-to-response may reduce label noise and enhance clinically meaningful pattern recognition.
Richer imaging representations are also needed. Temporal encoders could explicitly model contrast uptake and washout dynamics, while complementary modalities such as T2-weighted and diffusion-weighted MRI may improve characterization of tumor cellularity and microstructure. Expanding analysis beyond the primary tumor to include peritumoral tissue, background parenchymal enhancement, and multifocal disease may better capture host–tumor interactions. Generative approaches could further support fairness-aware and multi-scanner augmentation [58, 59].
Integration of treatment-specific variables (e.g., regimen, dosage), molecular subtype, and proliferation markers (e.g., Ki-67 [60]) is essential to contextualize imaging findings. Radiology–pathology bridging objectives [61] may further promote biologically grounded representations transferable to response prediction.
5.3.2 Enhancement of Modeling Approaches
Future work should explore tighter coupling between segmentation and response prediction, including joint and uncertainty-aware frameworks that propagate voxel-level uncertainty into downstream confidence estimates. Biophysically informed or treatment-aware modeling [62] may further link expected imaging changes to therapy mechanisms.
Two teams explicitly leveraged large-scale self-supervised (SSL) pretraining strategies. Martel Lab employed a broadly pretrained backbone, while the MIC team pretrained a residual-encoder nnU-Net using masked autoencoding on 4,799 external DCE-MRI volumes. The remaining submissions relied primarily on supervised training from scratch or ImageNet-style initialization, without incorporating large-scale medical vision foundation models. Notably, even with modality-specific large-scale SSL, consistent improvements in pCR prediction were not observed, suggesting that representation scale alone may be insufficient.
Continual and federated learning strategies [63] will be necessary to enable cross-institutional improvement while preserving privacy, aligning with MAMA-MIA’s goal of evaluating real-world clinical impact.
6 Conclusion
This work introduced the MAMA-MIA benchmark, a large-scale, multi-center framework designed to jointly evaluate generalization and subgroup fairness in breast MRI tumor segmentation and pretreatment pCR prediction. While automated tumor segmentation demonstrated robust performance and consistent generalization across unseen clinical sites, pretreatment pCR prediction from baseline DCE-MRI showed only marginal gains over baseline under realistic cross-center evaluation. These findings challenge the notion that pCR prediction can be solved with imaging-data alone, as had been suggested by multiple reports in the literature.
Highlighting the gap between apparent methodological progress and clinical readiness, the MAMA-MIA benchmark is designed as living resource tracking the field’s progress in treatment response prediction while simultaneously evolving with new data and evaluation paradigms towards deploying AI solutions in breast imaging that are not only accurate, but also robust, reliable, equitable, and clinically meaningful.
7 Acknowledgements
This project has received funding from the European Union’s Horizon 2020 research and innovation programmes under grant agreement No 952103 (EUCanImage) and No 101057699 (RadioVal). Also, this work was partially supported by the project FUTURE-ES (PID2021-126724OB-I00) and project AIMED (PID2023-146786OB-I00) from the Ministry of Science and Innovation of Spain. K.K. holds a RyC fellowship grant (RYC2024-048256-I).
Team Martel Lab (M. A., T.X., and A.M.) are supported by the Canada Foundation for Innovation (40206), and the Ontario Research Fund. Computational resources were provided in part by the Digital Research Alliance of Canada (alliancecan.ca). Team ViCOROB (H.A., J.C.V. and R.M.) funded by the projects VICTORIA, “PID2021-123390OB-C21” and IMPACT, “PID2024-157201OB-C21” from the Ministerio de Ciencia, Innovación y Universidades of Spain, and the PhD grant IFUdG2024 from the University of Girona. Team pimed-lab (D.S., J.H.L. and M.R.) is supported by the National Cancer Institute of the National Institutes of Health under Award Number R37CA260346. Team AIH-MAMA (E.P., L.V., E.P., M.A.Z.) is partly supported by the ANR-BMBF TRAIN (ANR-22-FAI1-0003-02). We would like to thank all team members who helped during the benchmark: Daniele Falcetta (AIH-MAMA), Vincenzo Marciano’ (AIH-MAMA), Tania Cerquitelli (AIH-MAMA), Elena Baralis (AIH-MAMA).
References
- [1] World Health Organization, “Breast cancer: Global patterns of incidence, mortality, and survival,” https://www.who.int/news-room/fact-sheets/detail/breast-cancer, 2024, accessed: 2025-04-27.
- [2] H. Sung et al., “Global cancer statistics 2020: GLOBOCAN estimates of incidence and mortality worldwide for 36 cancers in 185 countries,” CA: a cancer journal for clinicians, vol. 71, no. 3, pp. 209–249, 2021.
- [3] R. M. Mann, N. Cho, and L. Moy, “Breast MRI: state of the art,” Radiology, vol. 292, no. 3, pp. 520–536, 2019.
- [4] N. Hylton and et al., “Locally advanced breast cancer: MR imaging for prediction of response to neoadjuvant chemotherapy—results from ACRIN 6657/I-SPY trial,” Radiology, vol. 279, no. 1, pp. 44–55, 2016.
- [5] A. Pennisi, T. Kieber-Emmons, I. Makhoul, and L. Hutchins, “Relevance of pathological complete response after neoadjuvant therapy for breast cancer,” Breast cancer: basic and clinical research, vol. 10, pp. BCBCR–S33 163, 2016.
- [6] L. Garrucho et al., “A large-scale multicenter breast cancer dce-mri benchmark dataset with expert segmentations,” Scientific Data, vol. 12, no. 1, p. 453, 2025.
- [7] J. Zhang et al., “A robust and efficient ai assistant for breast tumor segmentation from dce-mri via a spatial-temporal framework,” Patterns, vol. 4, no. 9, 2023.
- [8] N. Khan, R. Adam, P. Huang, T. Maldjian, and T. Q. Duong, “Deep learning prediction of pathologic complete response in breast cancer using mri and other clinical data: a systematic review,” Tomography, vol. 8, no. 6, pp. 2784–2795, 2022.
- [9] R. J. Chen et al., “Algorithmic fairness in artificial intelligence for medicine and healthcare,” Nature biomedical engineering, vol. 7, no. 6, pp. 719–742, 2023.
- [10] K. Lekadir et al., “Future-ai: international consensus guideline for trustworthy and deployable artificial intelligence in healthcare,” bmj, vol. 388, 2025.
- [11] W. Li et al., “Breast multiparametric mri for prediction of neoadjuvant chemotherapy response in breast cancer: the bmmr2 challenge,” Radiology: Imaging Cancer, vol. 6, no. 1, p. e230033, 2024.
- [12] Y. Yang, H. Zhang, J. W. Gichoya, D. Katabi, and M. Ghassemi, “The limits of fair medical imaging ai in real-world generalization,” Nature Medicine, vol. 30, no. 10, pp. 2838–2848, 2024.
- [13] O. Ronneberger, P. Fischer, and T. Brox, “U-net: Convolutional networks for biomedical image segmentation,” in International Conference on Medical image computing and computer-assisted intervention. Springer, 2015, pp. 234–241.
- [14] F. Isensee, P. F. Jaeger, S. A. A. Kohl, J. Petersen, and K. H. Maier-Hein, “nnu-net: a self-configuring method for deep learning-based biomedical image segmentation,” Nature Methods, vol. 18, no. 2, pp. 203–211, 2021. [Online]. Available: https://doi.org/10.1038/s41592-020-01008-z
- [15] A. Myronenko, “3d mri brain tumor segmentation using autoencoder regularization,” in International MICCAI brainlesion workshop. Springer, 2018, pp. 311–320.
- [16] J. Wang et al., “Generalizing to unseen domains: A survey on domain generalization,” IEEE Transactions on Knowledge and Data Engineering, pp. 1–1, 2022.
- [17] S. Eskreis-Winkler et al., “Breast mri background parenchymal enhancement categorization using deep learning: Outperforming the radiologist,” Journal of Magnetic Resonance Imaging, vol. 56, no. 4, pp. 1068–1076, Oct 2022, epub 2022 Feb 15.
- [18] A. Burton et al., “Mammographic density and ageing: a collaborative pooled analysis of cross-sectional data from 22 countries worldwide,” PLoS medicine, vol. 14, no. 6, p. e1002335, 2017.
- [19] E. J. Sutton et al., “A machine learning model that classifies breast cancer pathologic complete response on mri post-neoadjuvant chemotherapy,” Breast Cancer Research, vol. 22, pp. 1–11, 2020.
- [20] X. Li, C. Li, H. Wang, L. Jiang, and M. Chen, “Comparison of radiomics-based machine-learning classifiers for the pretreatment prediction of pathologic complete response to neoadjuvant therapy in breast cancer,” PeerJ, vol. 12, p. e17683, 2024.
- [21] Y. Peng et al., “Pretreatment dce-mri-based deep learning outperforms radiomics analysis in predicting pathologic complete response to neoadjuvant chemotherapy in breast cancer,” Frontiers in oncology, vol. 12, p. 846775, 2022.
- [22] S.-Y. Kim, J. Lee, N. Cho, and Y.-G. Kim, “Deep-learning based discrimination of pathologic complete response using mri in her2-positive and triple-negative breast cancer,” Scientific Reports, vol. 14, no. 1, p. 23065, 2024.
- [23] X. Liang, X. Yu, and T. Gao, “Machine learning with magnetic resonance imaging for prediction of response to neoadjuvant chemotherapy in breast cancer: A systematic review and meta-analysis,” European Journal of Radiology, vol. 150, p. 110247, 2022.
- [24] L. Garrucho, K. Kushibar, S. Jouide, O. Diaz, L. Igual, and K. Lekadir, “Domain generalization in deep learning based mass detection in mammography: A large-scale multi-center study,” Artificial Intelligence in Medicine, vol. 132, p. 102386, 2022.
- [25] S. Bakas et al., “Identifying the best machine learning algorithms for brain tumor segmentation, progression assessment, and overall survival prediction in the brats challenge,” arXiv preprint arXiv:1811.02629, 2018.
- [26] V. Campello et al., “Multi-centre, multi-vendor and multi-disease cardiac segmentation: the m&ms challenge,” IEEE Transactions on Medical Imaging, vol. 40, no. 12, pp. 3543–3554, 2021.
- [27] R. Dorent et al., “Crossmoda 2021 challenge: Benchmark of cross-modality domain adaptation techniques for vestibular schwannoma and cochlea segmentation,” Medical Image Analysis, vol. 83, p. 102628, 2023.
- [28] K. Drukker et al., “Toward fairness in artificial intelligence for medical image analysis: identification and mitigation of potential biases in the roadmap from data collection to model deployment,” Journal of Medical Imaging, vol. 10, no. 6, pp. 061 104–061 104, 2023.
- [29] V. N. Dang et al., “Auditing unfair biases in cnn-based diagnosis of alzheimer’s disease,” in Workshop on Clinical Image-Based Procedures. Springer, 2023, pp. 172–182.
- [30] E. T. Sedeta, B. Jobre, and B. Avezbakiyev, “Breast cancer: Global patterns of incidence, mortality, and trends.” Journal of Clinical Oncology, vol. 41, no. 16_suppl, pp. 10 528–10 528, 2023.
- [31] K. Clark et al., “The cancer imaging archive (tcia): maintaining and operating a public information repository,” Journal of digital imaging, vol. 26, no. 6, pp. 1045–1057, 2013.
- [32] D. Newitt et al., “Multicenter breast DCE-MRI data and segmentations from patients in the I-SPY 1/ACRIN 6657 trials,” The Cancer Imaging Archive, 2016. [Online]. Available: https://doi.org/10.7937/K9/TCIA.2016.HdHpgJLK
- [33] W. Li et al., “I-SPY 2 breast dynamic contrast enhanced MRI trial (version 1) [data set],” The Cancer Imaging Archive, 2022. [Online]. Available: https://doi.org/10.7937/TCIA.D8Z0-9T85
- [34] D. Newitt and N. Hylton, “Single site breast DCE-MRI data and segmentations from patients undergoing neoadjuvant chemotherapy (version 3) [data set],” The Cancer Imaging Archive, 2016. [Online]. Available: https://doi.org/10.7937/K9/TCIA.2016.QHsyhJKy
- [35] A. Saha et al., “Dynamic contrast-enhanced magnetic resonance images of breast cancer patients with tumor locations [data set],” The Cancer Imaging Archive, 2021. [Online]. Available: https://doi.org/10.7937/TCIA.e3sv-re93
- [36] M. Amine, “Pycad: A python library for medical imaging analysis,” https://github.com/amine0110/pycad, 2023, gitHub repository.
- [37] Z. Xu et al., “Codabench: Flexible, easy-to-use, and reproducible meta-benchmark platform,” Patterns, vol. 3, no. 7, 2022.
- [38] J. C. Gee et al., Medical Image Computing and Computer Assisted Intervention–MICCAI 2025: 28th International Conference, Daejeon, South Korea, September 23–27, 2025, Proceedings, Part V. Springer Nature, 2025.
- [39] T. Zhang et al., Eds., Artificial Intelligence and Imaging for Diagnostic and Treatment Challenges in Breast Care, ser. Lecture Notes in Computer Science, vol. 16142. Cham: Springer, 2026. [Online]. Available: https://link.springer.com/book/10.1007/978-3-032-05559-0
- [40] F. Isensee et al., “nnu-net revisited: A call for rigorous validation in 3d medical image segmentation,” in Medical Image Computing and Computer Assisted Intervention – MICCAI 2024. Cham: Springer Nature Switzerland, 2024, pp. 488–498.
- [41] J. Kächele, D. Bounias, A. Ertl, and K. Maier-Hein, “On tackling domain shift in breast MRI using only publicly-available data: Reproducible breast cancer segmentation and pCR prediction,” in Lecture Notes in Computer Science, ser. Lecture notes in computer science. Cham: Springer Nature Switzerland, 2026, pp. 310–319.
- [42] H. Awwad, J. C. Vilanova, and R. Martí, “Can we teach ai to understand breast tumour behaviour? our mama-mia challenge journey,” in Artificial Intelligence and Imaging for Diagnostic and Treatment Challenges in Breast Care, T. Zhang et al., Eds. Cham: Springer Nature Switzerland, 2026, pp. 248–257.
- [43] A. Dosovitskiy, “An image is worth 16x16 words: Transformers for image recognition at scale,” arXiv preprint arXiv:2010.11929, 2020.
- [44] T. Xu et al., “A generalizable 3d framework and model for self-supervised learning in medical imaging,” 2025. [Online]. Available: https://arxiv.org/abs/2501.11755
- [45] E. Poeta et al., “Divergence-aware training with automatic subgroup mitigation for breast tumor segmentation,” in Deep Breast Workshop on AI and Imaging for Diagnostic and Treatment Challenges in Breast Care. Springer, 2025, pp. 52–62.
- [46] E. Pastor, L. de Alfaro, and E. Baralis, “Looking for trouble: Analyzing classifier behavior via pattern divergence,” in Proceedings of the 2021 International Conference on Management of Data, ser. SIGMOD ’21. New York, NY, USA: Association for Computing Machinery, 2021, p. 1400–1412. [Online]. Available: https://doi.org/10.1145/3448016.3457284
- [47] A. Koudounas, E. Pastor, L. de Alfaro, and E. Baralis, “Mitigating subgroup disparities in speech models: A divergence-aware dual strategy,” IEEE Transactions on Audio, Speech and Language Processing, vol. 33, pp. 883–895, 2025.
- [48] T. Chen, S. Kornblith, M. Norouzi, and G. Hinton, “A simple framework for contrastive learning of visual representations,” 2020. [Online]. Available: https://arxiv.org/abs/2002.05709
- [49] K. He, X. Zhang, S. Ren, and J. Sun, “Deep residual learning for image recognition,” 2015. [Online]. Available: https://arxiv.org/abs/1512.03385
- [50] D. Tran, H. Wang, L. Torresani, J. Ray, Y. LeCun, and M. Paluri, “A closer look at spatiotemporal convolutions for action recognition,” 2018. [Online]. Available: https://arxiv.org/abs/1711.11248
- [51] TorchVision maintainers and contributors. (2016) TorchVision: PyTorch’s computer vision library. GitHub repository. [Online]. Available: https://github.com/pytorch/vision
- [52] R. Liaw, E. Liang, R. Nishihara, P. Moritz, J. E. Gonzalez, and I. Stoica, “Tune: A research platform for distributed model selection and training,” 2018. [Online]. Available: https://arxiv.org/abs/1807.05118
- [53] T. Chen and C. Guestrin, “Xgboost: A scalable tree boosting system,” in Proceedings of the 22nd ACM SIGKDD International Conference on Knowledge Discovery and Data Mining, ser. KDD ’16. ACM, Aug. 2016, p. 785–794. [Online]. Available: http://dx.doi.org/10.1145/2939672.2939785
- [54] M. Caballo, W. B. Sanderink, L. Han, Y. Gao, A. Athanasiou, and R. M. Mann, “Four-dimensional machine learning radiomics for the pretreatment assessment of breast cancer pathologic complete response to neoadjuvant chemotherapy in dynamic contrast-enhanced mri,” Journal of Magnetic Resonance Imaging, vol. 57, no. 1, pp. 97–110, 2023.
- [55] I. Janíčková et al., “Temporal representation learning of phenotype trajectories for pcr prediction in breast cancer,” in International Conference on Medical Image Computing and Computer-Assisted Intervention. Springer, 2025, pp. 606–615.
- [56] N. Loman, H. Saghir, and S. Kimbung, “Predicting neoadjuvant chemotherapy treatment response in hormone-receptor-positive/her2-negative breast cancer–results from the swedish scan-b population-based cohort,” Acta Oncologica, vol. 64, p. 44201, 2025.
- [57] L. R. da Silva, R. F. Vargas, J. Y. Shinzato, S. F. M. Derchain, S. Ramalho, and L. C. Zeferino, “Association of menopausal status, expression of progesterone receptor and ki67 to the clinical response to neoadjuvant chemotherapy in luminal breast cancer,” Revista Brasileira de Ginecologia e Obstetrícia/RBGO Gynecology and Obstetrics, vol. 41, no. 12, pp. 710–717, 2019.
- [58] G. Skorupko et al., “Fairness-aware data augmentation for cardiac mri using text-conditioned diffusion models,” in MICCAI Workshop on Fairness of AI in Medical Imaging. Springer, 2025, pp. 63–73.
- [59] L. Garrucho et al., “High-resolution synthesis of high-density breast mammograms: Application to improved fairness in deep learning based mass detection,” Frontiers in oncology, vol. 12, p. 1044496, 2023.
- [60] X. Chen et al., “The predictive value of ki-67 before neoadjuvant chemotherapy for breast cancer: a systematic review and meta-analysis,” Future oncology, vol. 13, no. 9, p. 843, 2017.
- [61] C. Wong et al., “Ai-driven mri biomarker for triple-class her2 expression classification in breast cancer: a large-scale multicenter study,” Breast Cancer Research, vol. 27, no. 1, p. 166, 2025.
- [62] F. M. Howard et al., “Highly accurate response prediction in high-risk early breast cancer patients using a biophysical simulation platform,” Breast Cancer Research and Treatment, vol. 196, no. 1, pp. 57–66, 2022.
- [63] G. Skorupko et al., “Federated nnu-net for privacy-preserving medical image segmentation,” Scientific Reports, vol. 15, no. 1, p. 38312, 2025.