\ul
VizQStudio: Iterative Visualization Literacy MCQs Design with Simulated Students
Abstract
Multiple-choice questions (MCQs) are a widely used educational tool, particularly in domains such as visualization literacy that require broad conceptual coverage and support diverse real-world applications. However, designing high-quality visualization literacy MCQs remains challenging, as instructors must coordinate multimodal elements (e.g., charts, question stems, and distractors), address diverse visualization tasks, and accommodate learners with heterogeneous backgrounds. Existing visualization literacy assessments primarily rely on standardized, fixed item banks, offering limited support for iterative question design that adapts to differences in learners’ abilities, backgrounds, and reasoning strategies. To address these challenges, we present VizQStudio, a visual analytics system that supports instructors in iteratively designing and refining visualization literacy MCQs using MLLM-powered simulated students. Instructors can specify diverse student profiles spanning demographics, knowledge levels, and learning-related traits. The system then visualizes how simulated students reason about and respond to different question components, helping instructors explore potential misconceptions, difficulty calibration, and design trade-offs prior to classroom deployment. We investigate VizQStudio through a mixed-method evaluation, including expert interviews, case studies, a classroom deployment, and a large-scale online study. Our results indicate that MCQs designed with VizQStudio can support learning outcomes comparable to established benchmark questions, while enabling greater flexibility and scalability during the design process. Overall, this work reframes MLLM-based student simulation in assessment authoring as a design-time, exploratory aid. By examining both its value and limitations in realistic instructional settings, we surface design insights that inform how future systems can support instructor-centered, iterative, and responsible uses of AI for multimodal assessment design in visualization literacy and related domains.
I Introduction
As data visualizations increasingly permeate daily life through social media and workplaces, visualization literacy—the ability to accurately interpret and extract insights from visualizations—has become a fundamental skill [1, 2, 3, 4, 5]. With this growing demand, research and educational practices in visualization literacy have expanded rapidly [6].
Effectively teaching and assessing visualization literacy, however, remains challenging due to its broad conceptual scope, diverse reasoning tasks, and varied learner backgrounds. Multiple-choice questions (MCQs) have emerged as a widely used assessment format that aligns well with these needs [7, 8]. Their flexible structure accommodates various contexts and cognitive demands, making them particularly effective for evaluating visualization literacy—from simple information retrieval to higher-level comparative analysis [9, 10, 6, 11].
Despite this progress, existing research largely focuses on standardized visualization literacy assessments that use fixed question sets to evaluate proficiency rather than support instruction [9, 12, 13]. These tests typically include only one or two questions per knowledge area and are designed for summative benchmarking, offering limited support for adapting questions to diverse learner backgrounds or instructional needs. As a result, educators and students lack sufficient high-quality, diverse, and pedagogically targeted resources for effective teaching and practice, leaving a significant gap in well-vetted MCQ banks for visualization literacy education.
Moreover, designing high-quality visualization literacy MCQs is inherently challenging and labor-intensive [14, 15]. Even expert test developers can produce only a few well-constructed questions per day and may inadvertently introduce personal biases due to limited student feedback [16, 17]. The multimodal nature of visualization questions further complicates the process, requiring instructors to generate suitable visual data representations, craft coherent question stems and distractors, and incorporate multiple visualization tasks within each question. Adapting MCQs to learners’ diverse skill sets across fields—such as computer science, business, and design—adds yet another layer of complexity, placing substantial burdens on educators who typically rely on extensive manual effort and expertise [18, 19, 20, 21].
Recent advances in Multimodal Large Language Models (MLLMs) offer promising opportunities for generating educational materials like MCQs. However, their potential remains largely untapped in visualization literacy education. Current research primarily focuses on text-based MCQs [22, 23, 24, 25, 26, 27] or extract questions from figures [28]. As a result, most pedagogical considerations crucial to visualization literacy education, like multimodal alignment, diverse reasoning tasks, and learner-specific adaptations, remain inadequately addressed.
To address these challenges, we present VizQStudio, a visual analytics system that supports teachers iteratively create and refine high-quality, multimodal MCQs for visualization literacy education. VizQStudio integrates into instructional workflows, enabling educators to specify sample questions, define visualization tasks, adjust chart features, and configure other question settings. The system also incorporates an MLLM-powered student simulation module, allowing instructors to define diverse student profiles—including demographic attributes, knowledge levels, and cognitive traits—for targeted feedback and comprehensive question evaluations. Educators can interactively adjust question features via intuitive panels, refine details through natural-language prompts, or directly modify specific elements. Meanwhile, instructors receive real-time simulated student feedback enriched by visual analytics that expose underlying reasoning processes. This iterative, student-centered approach helps instructors detect misconceptions, adapt questions to diverse learner needs, and improve overall quality before classroom deployment.
Through comprehensive quantitative evaluations of the student simulation and question generation modules, along with illustrative use-case studies, in-depth expert interviews, a real-world classroom experiment, and an online user study, we demonstrate VizQStudio’s capacity to effectively support the design of robust, learner-centered MCQs in visualization literacy education. In summary, our key contributions include:
-
•
A formative study investigating instructors’ needs in designing visualization literacy MCQs, emphasizing their expectations for simulated student feedback and iterative refinement processes;
-
•
VizQStudio, a visual analytics system that explores collaboration between teachers and MLLMs for the iterative design of multimodal MCQs across diverse visualization literacy educational contexts;
-
•
A multi-faceted evaluation that surfaces design insights and practical lessons from deploying VizQStudio in realistic instructional settings, highlighting design insights, practical lessons, and key considerations for visualization literacy education and broader pedagogical practices.
II Related Work
In this section, we review relevant research, including Visualization Literacy Education, Visual Analytics for Educational Content Authoring, AI-Assisted Multiple-choice Questions Generation, and LLMs for Student Simulation.
II-A Visualization Literacy Education
Visualization literacy has long been recognized as a crucial topic, particularly given its growing relevance in daily life [29, 30]. It is a multifaceted ability involving skills such as reading and interpreting visualizations, extracting information from data, critical reasoning, and authoring effective visualizations. This breadth makes the education of visualization literacy a broad and challenging endeavor [31, 32].
Much of the existing literature has focused on summarizing guidelines for effective visual communication [33, 34, 35, 36, 37] and identifying common pitfalls that hinder comprehension [38, 39, 40]. Other strands of work have introduced standardized visualization literacy assessments, which primarily focus on reading and critical thinking and provide fixed item banks with summative scoring [9, 41, 12]. While these instruments are valuable for benchmarking and summative assessment, their static, fixed-item nature limits adaptability to diverse instructional contexts and learner populations [10]. This limitation is particularly salient in visualization literacy education, where relevant skills have been shown to be multi-dimensional and highly context-dependent rather than uniform or fixed [42]. As a result, instructors often require support for formative assessment design that enables them to tailor questions to specific pedagogical goals and learner backgrounds.
Motivated by this need, VizQStudio explores how instructors can be supported in iteratively generating and refining adaptive, multimodal MCQs. Rather than replacing existing assessment practices, the system draws on established visualization literacy frameworks and reasoning-oriented assessment perspectives to support instructors’ formative question design.
II-B Visual Analytics for Educational Content Authoring
Visual analytics has been widely used to support educational content authoring by helping instructors inspect and reflect on learner behavior. Prior systems often focus on analyzing students’ problem-solving processes to inform iterative content refinement. For example, QLens [43] and StuGPTViz [44] visualize student reasoning using Sankey diagrams or treemaps, enabling instructors to identify common strategies and misconceptions. Other approaches leverage aggregated learner responses to assist content creation, such as summarizing crowdsourced solutions to generate peer-facing hints [45].
Recent work has begun to integrate AI assistance into teacher-driven authoring workflows. SPROUT [46], for instance, combines interactive visualizations with LLMs to support tutorial creation. However, these systems largely rely on instructors’ expertise or historical learner data to guide refinement. They offer limited support for exploring how diverse learners might respond to newly authored content.
This reliance on previously collected data presents a fundamental limitation: for novel questions or instructional materials, such data is unavailable. As a result, instructors lack tools to proactively reason about potential learner responses during the design phase. VizQStudio addresses this gap by using simulated student profiles to visualize plausible reasoning paths, enabling instructors to anticipate misconceptions and iteratively refine questions prior to classroom use.
II-C AI-Assisted Multiple-choice Questions Generation
Multiple-choice questions are widely used in education [47], yet designing high-quality MCQs remains notoriously challenging [14, 15]. Even experienced test developers often produce only a few well-crafted questions per day [17], and creating isomorphic problems with varied distractors becomes especially difficult when images and figures are involved. Recent advances in generative AI, particularly Large Language Models, have opened new avenues for assisting teachers in designing MCQs. Prior studies have focused on automatically generating information-extraction questions from text passages [22, 24, 48, 49], refining distractor design, or supporting varied question difficulties [25, 26].
However, these approaches often lack the diverse pedagogical coverage needed for real-world visualization literacy education, including comprehensive knowledge coverage, student diversity, and domain-specific requirements such as visualization accessibility. While some tools leverage human-AI collaboration to improve question design with pedagogical considerations, they are generally limited to open-ended formats [50, 51], subjects such as coding [52], or peer-generated items used for learning [53]. In contrast, our work leverages MLLMs to specifically support the design of adaptive, multimodal MCQs for visualization literacy, ensuring coverage across diverse knowledge points while accommodating learners of varying backgrounds and skill levels.
II-D LLMs for Student Simulation
Recent research has explored the use of LLMs to simulate student behavior across a range of educational contexts. Multi-agent systems have been proposed to model classroom interactions or virtual learning environments [54, 55, 56], while other work focuses on supporting teacher training through simulated tutoring, problem-solving scenarios, or dialog-based interactions [57, 58, 59, 60]. Collectively, these studies demonstrate the feasibility of LLMs as student surrogates. However, they primarily address pedagogical interaction during instruction, rather than providing design-time feedback for assessment authoring—where no empirical student data exists, and instructors must reason about how diverse learners may respond to newly created questions before deployment.
Parallel efforts have enriched student simulation by incorporating cognitive factors (e.g., knowledge level) and non-cognitive traits (e.g., personality or mindset) [61, 62, 63, 64]. While such domain-agnostic models can be applied across tasks, they often provide limited diagnostic value for assessment design in visualization-intensive domains. Visualization literacy relies on domain-specific reasoning bottlenecks—such as visual encoding interpretation, proportional comparison, and perceptual shortcuts—that are not explicitly captured in general-purpose simulations. As a result, these approaches offer limited insight into how diverse learners may reason through specific visualization questions, constraining their usefulness for iterative assessment refinement.
Our work is situated at this intersection, but addresses a different design goal. Rather than using student simulation for instruction or teacher training, we explore its role as a design-time instrument for assessment authoring. By grounding LLM-based agents in domain-specific visualization literacy factors (e.g., visual processing ability, chart interpretation strategies) and visualizing their simulated reasoning, VizQStudio supports instructors in anticipating misconceptions and iteratively refining MCQs before deployment. In this framing, student simulation complements empirical learner data by providing exploratory feedback when real responses are unavailable.
III Formative Study
To better understand the challenges instructors face in designing visualization literacy questions, as well as their needs for a tool involving simulated students, we conducted semi-structured interviews with six domain experts (E1–E6). The group comprised three assistant professors (E1–E3), one lecturer (E4), and two postdoctoral researchers (E5 & E6), each with at least three years of experience teaching or assisting in undergraduate and master’s data visualization courses, with extensive experience in homework and exam design. During the interviews, we explored experts’ question design workflows, prior experiences with AI tools (e.g., LLMs), expectations for student simulation, and additional functional needs. Below, we summarize the key design requirements that emerged from these discussions.
R1: Flexible Sample Question and Requirement Specification. Instructors often begin the question-design process with varying levels of readiness. Some arrive with fully developed samples, others bring only raw screenshots from course slides or pre-made visualizations, and still others possess little more than a broad idea. Consequently, the system must accommodate these diverse entry points, enabling teachers to either build on existing materials or generate new content from scratch. Moreover, it should offer flexible configuration options—such as adjusting question difficulty, specifying contextual details (e.g., domain scenarios), choosing chart types, and identifying core knowledge points—so that instructors can tailor questions to their specific educational goals and the diverse needs of their students.
To further inform these configuration needs, we conducted follow-up interviews with each expert. We presented sample MCQs from VLAT [9] and CALVI [12], asking which adjustable settings and student profile attributes would be most beneficial. To reduce subjective bias and strengthen theoretical grounding, we triangulated experts’ feedback with established educational and visualization literacy frameworks. This process resulted in four categories of MCQ features (14 in total), as summarized in Fig. 1-A. Specifically, we aligned Cognitive Complexity with the Revised Bloom’s Taxonomy [65] to capture a progression from lower-order tasks (e.g., value retrieval) to higher-order analytical reasoning. In parallel, content-specific features (e.g., visual encoding and chart interpretation) were grounded in validated visualization literacy frameworks [9, 12], ensuring that question design reflects established constructs in visualization education.
R2: Diverse Student Profiles Considerations. Participants emphasized the importance of using LLM-driven simulations to capture the breadth of student diversity when designing and evaluating questions. They highlighted the need to represent a wide range of ages, backgrounds, knowledge levels, and personal traits. To operationalize these considerations in a theory-informed manner, we triangulated expert input with prior work in learning sciences and visualization cognition. This resulted in three categories of 15 student profile features—demographic attributes, learning traits, and visualization-relevant knowledge points—as summarized in Fig. 1-B.
In particular, participants stressed factors specific to visualization literacy, such as visual processing abilities and working memory. This emphasis is grounded in Cognitive Load Theory [66] and models of graph comprehension [67], which identify these faculties as key constraints when learners decode visual encodings while reasoning about data relationships. By incorporating these traits into student profiles, the system is designed to better reflect variations in learners’ prior exposure and cognitive demands, providing instructors with a structured lens to reason about novice-to-advanced differences during question design.
In addition, participants noted that simulated students should provide reasoning traces for their answers, enabling instructors to identify misconceptions and refine question design. Finally, for scenarios where instructors lack detailed insights into the student population, they recommended offering a set of default student profiles. These profiles would help evaluate how well questions cater to general learners without requiring customized input, thereby promoting fairness and broader applicability in assessment design.

R3: Concise Summaries for Simulation Results with Details on Demand. A key advantage of using MLLMs for question generation and student simulation is the ability to produce diverse question settings and predict how learners might respond. However, instructors can be overwhelmed by the volume of generated questions and simulation data. Given the complexity of designing each high-quality MCQ, participants recommended focusing on one question at a time and providing concise summaries of student feedback. They suggested grouping similar students to present aggregated results while highlighting critical metrics such as predicted difficulty, error rates, and student perceptions to help instructors quickly assess question quality and identify refinements.
Additionally, participants valued on-demand, granular analyses of students’ reasoning. The ability to “drill down” into individual thought processes for specific answers helps uncover misconceptions and confirm alignment with intended designs. They recommended a hierarchical feedback approach: start with high-level insights and allow deeper exploration into detailed reasoning as needed.
R4: Iterative Question Design and Refinement. A core requirement for creating high-quality MCQs that effectively incorporate simulated student feedback is to support continuous teacher-driven refinement of all question components (e.g., the stem, options, and associated visualizations). During interviews, participants emphasized the need for straightforward methods to make adjustments, either by describing desired revisions to the MLLM or by directly manipulating settings via simple buttons (e.g., chart type, dataset complexity, color schemes or question context). After each update, the system should re-simulate student responses, allowing instructors to compare performance before and after modifications. This feedback loop enables teachers to iteratively refine MCQs, ensuring robust pedagogical rigor.
R5: Balance Difficulty Across the Question Set. Instructors emphasized the importance of designing not just individual questions, but a well-balanced set with varied difficulty levels. A diverse and calibrated question set better supports learners’ progression and ensures comprehensive coverage of visualization literacy skills.
IV Question Generation and Student Simulation
This section details the MLLM-based question generation and student simulation modules, which form the backbone of our system’s iterative design workflow.
IV-A Teacher-MLLM Collaborative Question Generation
Designing high-quality MCQs for visualization literacy requires generating accurate, diverse, and sometimes intentionally misleading charts — a significant technical challenge. We first outline our technical stack choices and the retrieval-augmented generation (RAG) approach used to improve MLLM-generated chart quality, followed by the backend pipeline for question generation and iterative refinement.
IV-A1 Visualization Generation Method Selection
The system should transform varied user inputs, from rough descriptions and lecture slides to fully formed samples, into new MCQs (R1). A key challenge is generating precise chart visualizations, as current MLLMs remain unstable [49]. While prior work often uses Vega-Lite, its high-level grammar lacks the flexibility needed for tasks involving misleaders (e.g., truncated axes, non-linear scales). Instead, we leverage MLLMs to generate D3.js code, which offers fine-grained control and supports complex visualization designs [68].

IV-A2 Template-Based Generation and Iterative Refinement
Directly generating D3.js from scratch often produces unstable scripts [68]. To improve reliability, we adopt a retrieval-augmented generation (RAG)-inspired approach: instead of creating visualizations entirely from scratch, the system queries, edits, and varies existing templates. To achieve this, we curated 80 standardized D3.js templates covering ten common chart types and all misleaders from existing visualization literacy tests [9, 13, 12].
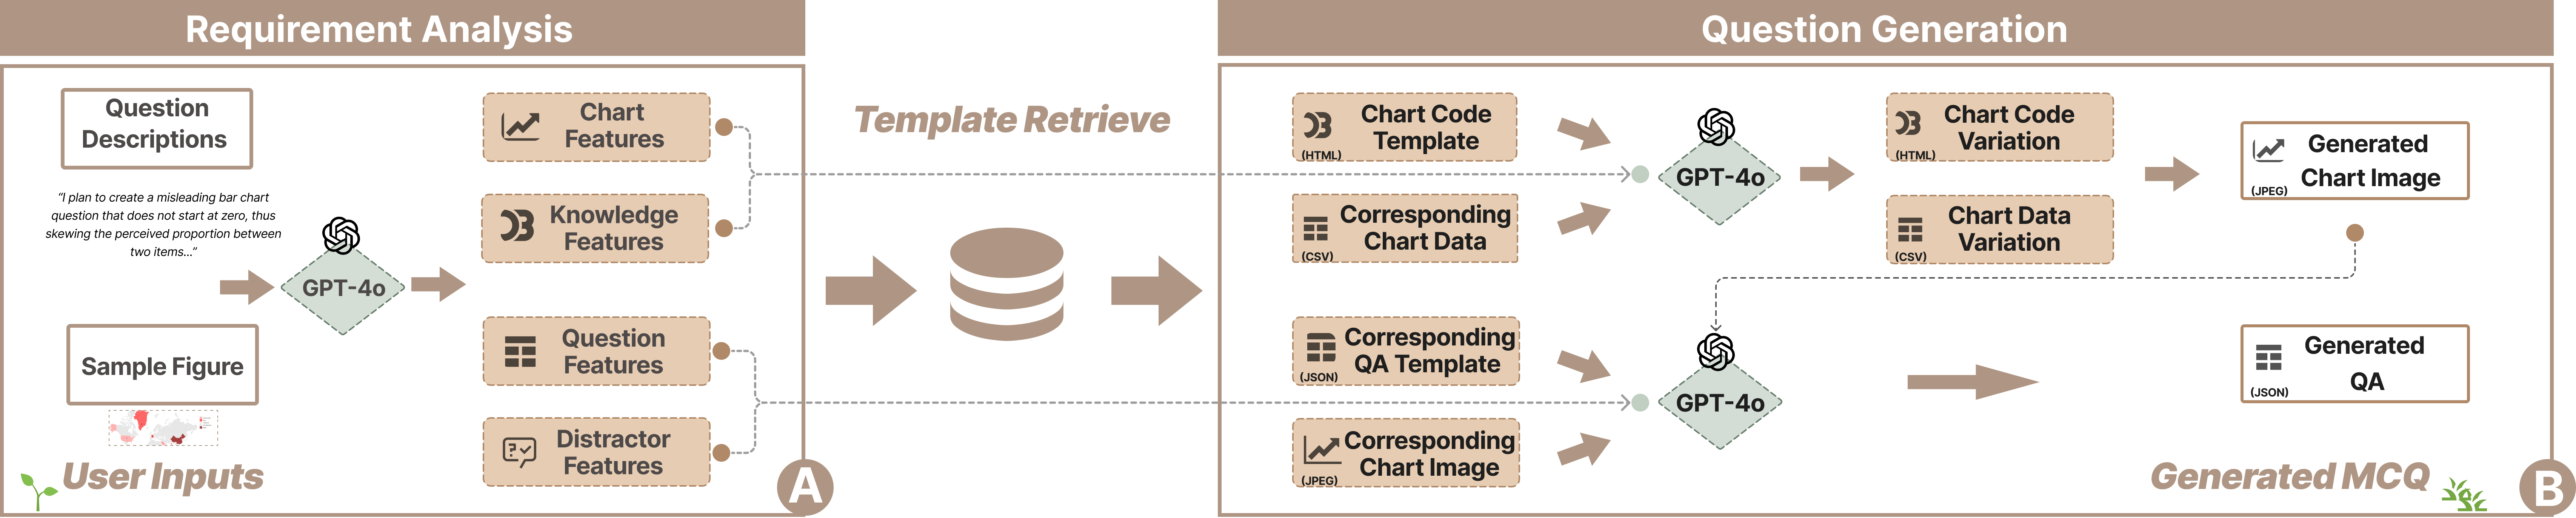
As shown in Fig. 2, we developed a two-stage question generation pipeline with an iterative refinement process. First, the requirement analysis module parses the user’s textual or image input to extract four types of MCQ features (Fig. 1-A). Based on these features, the system retrieves the most relevant D3.js template and CSV data. The question generation module then modifies them according to user configurations, introducing variations (e.g., random colors or data distributions) to enrich the resulting charts (Fig. 1-B). This pipeline reliably generates chart visualizations that meet the diverse needs of visualization literacy MCQs, as further evaluated through quantitative experiments in Sec. VI.
Furthermore, Fig. 3 illustrates the iterative refinement process: instructors can update any part of an MCQ (chart, code, data, or QAs) via revision prompts and feature selections. The system integrates these changes using MLLMs to produce updated versions, enabling instructors to progressively improve question quality and pedagogical rigor.
IV-B MLLM-Based Student Simulation
To provide precise feedback on generated MCQs and actionable revision suggestions, we implemented an MLLM-based student simulation module. Designed based on requirements (R2), it integrates the controllable features in Fig. 1 and supports three core processes: generating student profiles, clustering students, and simulating students responses. Unlike Item Response Theory (IRT)[69] or Bayesian Knowledge Tracing (BKT)[70], which depend on historical learner response data, our approach instantiates synthetic learner personas grounded in User Modeling frameworks [71, 72]. This design enables formative, design-time feedback for newly authored questions without requiring prior learner interaction data.
Generating and Updating Student Profiles: A core requirement is representing a diverse range of students (R2). We developed a profile generation module that dynamically synthesizes profiles using GPT-o3-mini, allowing fine-grained control over demographic, cognitive, and knowledge attributes (Fig. 1-B). The system honors instructor-defined constraints and otherwise applies sensible defaults. For example, the default simulated cohort size is set to 20, reflecting the typical size of a university tutorial or discussion group [73]. This choice provides a reasonably representative snapshot of learner diversity while maintaining computational efficiency for real-time interaction. Instructors can override this default by specifying any cohort size. Prompt templates were iteratively refined for accurate profile construction, with full templates provided in the supplementary materials.
Clustering Students for Aggregated Analysis: Analyzing individual responses at scale can be overwhelming, so our system clusters students based on three levels of features ( Fig. 1-B) using K-means (default ), a common approach in educational contexts [74, 75]. The results are visualized with radar charts to summarize group characteristics and support cross-group comparisons (R3). This enables instructors to efficiently assess group-level performance and identify groups struggling with specific question types.
Simulating Student Responses: To evaluate MCQ effectiveness, we simulate student responses using an MLLM-based reasoning framework conditioned on each agent’s demographic attributes, cognitive traits, and domain knowledge. This enables exploration of how different students answer the question, supporting analyses of answer distributions, potential misconceptions, and subsequent question refinements.
The simulation pipeline retrieves the student profile, the target MCQ (stem and options), and a base64-encoded chart image to construct a structured reasoning prompt. Each student’s cognitive abilities (e.g., logical reasoning, visual processing) are mapped to selection likelihoods for different reasoning pathways. For each question, the simulated student produces: (i) a selected answer; (ii) a step-by-step reasoning trace; and (iii) ratings of the question along six dimensions—context clarity, chart complexity, data difficulty, visual encoding complexity, overall cognitive challenge, and hint dependency.
It is important to note that all of these outputs are generatively inferred by the MLLM. As no prior student data exists for novel MCQs, the model is prompted to “think aloud” step by step while adhering to the constraints specified in the student profile and knowledge configuration. The resulting reasoning traces are therefore not treated as ground-truth explanations of individual learner cognition, but as plausible reasoning pathways whose instructional relevance is examined empirically through alignment with real students’ self-reported reasoning in our large-scale online study (Sec. VI).
These outputs support both aggregate summaries and fine-grained diagnostics of question quality, enabling instructors to inspect how different learner profiles may reason through a question and where misconceptions or unintended shortcuts may arise. For efficiency, simulations are parallelized via multi-threaded API calls to reduce latency in large-scale runs. The outputs are parsed to extract answers, reasoning traces, justifications, and diagnostic metrics, supporting iterative MCQ refinement while maintaining alignment with diverse learner profiles.
V System Design
Based on the design requirements identified in Sec. III and modules in Sec. IV, we developed VizQStudio, a visual analytics system that enables instructors to iteratively design and refine visualization literacy MCQs using MLLM-based simulated student feedback. This section first outlines the system workflow, then introduces the four main input panels (A, B, D, E), and finally presents the Simulation View (C), which displays the generated questions and simulation results.

V-A System Overview
VizQStudio follows an iterative workflow that helps instructors design, test, and refine visualization literacy MCQs using MLLM-based simulated student feedback. Teachers start by drafting a question or importing sample slides, then adjust question features (e.g., chart type, knowledge points) and configure student profiles (e.g., background, learning traits). The system then simulates student responses and reasoning, providing immediate insights into potential misconceptions, and question quality. Instructors refine the questions based on this feedback and re-run simulations until the MCQs align with instructional goals and accommodate diverse learner needs.

V-B User Interface
The interface of VizQStudio is organized into five main panels ( Fig. 4), each corresponding to a distinct stage in the question design process.

V-B1 Sample View & Feature View
After selecting the preferred model via the Model button, teachers begin drafting or importing a question in the Sample View (Fig. 4-A), where they can either describe key points or paste sample slides and questions. This flexible setup enables instructors to design questions for various scenarios while ensuring alignment with real classroom needs (R1).
Once the question is drafted, teachers proceed to the Feature View (Fig. 4-B) to fine-tune specific aspects of the MCQ. The system presents four core feature categories—Question Features, Chart Features, Distractor Features, and Knowledge Features—based on previously collected teacher needs ( Fig. 1-A). Within each category, specific features are displayed as sliders or drop-down menus, enabling teachers to easily adjust the relevant values (R4). Next to each feature control, a History section shows previously selected values, allowing users to compare different question versions. Finally, a Generate/Update button at the bottom triggers the regeneration of both the question and the student simulation results in the adjacent Simulation View (Fig. 4-C).
V-B2 Agent Profile & Setting Views
To simulate potential students using MLLM-based models, teachers rely on the Agent Profile View (Fig. 4-D) and the Agent Setting View (Fig. 4-E). Similar to the Sample & Feature View, instructors can either upload existing student information (e.g., a spreadsheet of demographic attributes and learning characteristics) or begin by describing the broad distribution of student characteristics in the Agent Profile View (Fig. 4-D), then refine and update specific agent settings in the Agent Setting View (Fig. 4-E). Drawing on prior research and collected teacher needs (R2), we group agent configurations into three main feature categories (Demographic Settings, Learning Traits Settings, and Knowledge Points Settings), each containing multiple adjustable parameters (Fig. 1-B). By combining these two views, teachers can model diverse learning styles and abilities. The resulting student groups are automatically classified and displayed in the Simulation View (Fig. 4-C), where instructors can further review each group’s performance and feedback.

V-B3 Simulation View
The Simulation View (Fig. 4-C) serves as the central workspace for analyzing both the Generated Question and the Simulation Results. At the top, the system clusters simulated students into color-coded Student Groups (Fig. 4-c1) based on user-defined agent settings. By default, four groups are generated via k-means clustering. Teachers may specify a different number or clustering criteria (Fig. 4-c1). Specifically, each group’s panel (Fig. 5-A) displays essential summaries, such as cluster size, average major or background, and two radar charts illustrating average cognitive and knowledge-point levels.
In the lower half of the Simulation View, the system aligns each component of the Generated Question (Fig. 4-c2)—including the stem, chart, answer options, and explanations of relevant knowledge points—on the left, with corresponding student feedback and responses on the right. This side-by-side layout enables instructors to clearly see how settings in the Feature View ( Fig. 4-B) influence each part of the question updates, while also allowing easy comparison with previous versions, indicated by grey bars (R4).
The simulated students’ responses are summarized in the Simulation Results zone. At a glance (Fig. 4-c4, Fig. 5-B), this area displays two rows of stacked bar charts: the top row shows how each student group perceives the question stem, while the bottom row reflects their evaluation of the chart settings, providing a concise summary of student feedback to support quick refinement (R3). Further down, the Sankey-like diagram (Fig. 4-c5, Fig. 6-A) offers deeper insights into students’ answer choices and thought processes (R3). Instructors can click on a specific answer choice (Fig. 6-a1) to highlight only the students who selected that option, thereby reducing clutter and revealing shared misconceptions or design flaws. As an example, of students selected the incorrect option B, primarily from the dark-blue and orange student groups (Fig. 6-a1). The Sankey-like visualization besides traces each student’s reasoning, grouping those who share the same step-by-step strategy into unified blocks, while horizontal spacing encodes the average “thinking time” inferred from each agent MLLM’s reasoning token lengths (Fig. 6-a2). For instance, three students from the orange group who selected option B began by “Comparing the options”. Two of them then proceeded to “Compare the axis”, while the third student directly moved on to “Compare the percentages” and spent a longer time reasoning through the step. To address potential issues with step length and visual clutter, the backend algorithm incorporates additional control over step length during reasoning analysis. Meanwhile, users can click the “Full View” button above the Sankey-like diagram to view an expanded version in a pop-up window. After updating the question feature, by directly editing Fig. 4-c2 or entering natural-language instructions in Fig. 4-c3, teachers can re-run the simulation to observe how these changes affect student responses. A summary chart at the bottom (Fig. 4-c6) compares the current version’s correctness rates with previous iterations, enabling quick assessments of how each refinement influences question complexity and clarity (R5). By aligning question content on the left with student feedback and reasoning on the right, the Simulation View makes it easy to spot ambiguous wording, confusing visuals, or overly challenging knowledge points. Teachers can further revise the question directly or interact with MLLMs in Fig. 4-(c2 and c3). They can also expand the chart editor panel in Fig. 7-(A–C) to edit the raw chart code or CSV data if needed. In addition, teachers can adjust features in Fig. 4-B or update student profiles in Fig. 4-(D and E). After making any updates, they can re-run the simulation until the MCQ aligns with instructional goals and addresses the needs of diverse learner populations.

Design alternative. During the design process, we explored different visualization approaches in consultation with our experts. For example, one idea involved a node-link layout that depicts reasoning trajectories across groups (Fig. 6-B). Vertically aligned nodes represent the set of action choices students make at each step, and hovering over a dot (Fig. 6-b1) highlights the corresponding problem-solving path. Although this layout more directly reveals individual reasoning, experts ultimately preferred the Sankey-like design because it emphasizes aggregated student performance and facilitates comparisons of problem-solving processes across groups.
VI Evaluation
We evaluate VizQStudio via: (1) a quantitative evaluation of the simulation and question generation modules; (2) case studies demonstrating system functionalities; (3) a real-world classroom experiment on designing high-quality visualization literacy MCQs for students; (4) a large-scale online study measuring learning gains and pedagogical effectiveness; and (5) interviews with six domain experts;
VI-A Evaluating Student Simulation & Question Generation
A primary goal of this evaluation is to assess whether simulated students exhibit reasoning behaviors that are consistent with their intended learner profiles. As prior literature on synthetic users emphasizes, evaluating such agents requires examining adherence to behavioral traits and reasoning processes, rather than task success alone [76]. Consequently, general-purpose LLM benchmarks (e.g., MMLU), which focus on overall intelligence [77], are not suitable for evaluating persona fidelity in student simulation. Our evaluation therefore focuses on two goals: (1) measuring persona fidelity using alignment-based metrics, and (2) informing model selection under interactive design constraints.
Alignment-based evaluation of simulation fidelity. Following the role-based LLM evaluation framework [78], we operationalized persona fidelity through three complementary alignment dimensions: Cognitive Alignment, which captures whether the generated reasoning reflects predefined cognitive strengths and weaknesses; Reasoning Steps Alignment, which assesses whether the reasoning follows expected problem-solving strategies implied by the learner profile (e.g., visual-first vs. logic-first approaches); and Semantic Alignment, which measures the overall thematic coherence between the learner profile description and the generated reasoning trace using semantic textual similarity (STS) [79]. Formal definitions and implementation details of these alignment metrics are provided in the supplementary.
All alignment scores were normalized to the range and combined into an overall consistency score using a weighted sum (40% cognitive, 40% reasoning steps, 20% semantic), deliberately prioritizing process-level fidelity over surface-level semantic similarity. This weighting reflects our design goal of modeling how students reason through visualization tasks, rather than how fluently they describe themselves.
Prior work does not define absolute thresholds for interpreting alignment scores; instead, such metrics serve as relative indicators of persona adherence for model comparison and selection [78]. In this context, overall consistency values around indicate that a model consistently incorporates profile constraints across repeated generations, rather than producing role-agnostic or highly unstable reasoning traces. We therefore interpret this level of alignment as sufficient to support design-time exploration of common reasoning patterns and potential misconceptions, rather than supporting that the simulation accurately predicts individual learner behavior.
Confirming model selection. To validate our design choice under the proposed alignment-based evaluation, we compared GPT-4o with o1 using identical clustered learner profiles and visualization literacy questions (20 simulated students 50 rounds). GPT-4o achieved higher overall alignment consistency than o1 (0.6611 vs. 0.6237), while also requiring substantially lower latency per response (35.05s vs. 146.43s). Given our goal of enabling reasonably stable persona adherence under interactive constraints, this result confirms our use of GPT-4o as the default simulation model.
Question generation and revision reliability. We additionally examined the operational reliability of the question-generation workflow. Across 50 randomized generation and revision scenarios, the initial question-generation stage averaged 12.67 s per instance with a manual success rate, while the revision stage averaged 9.82 s with an success rate, where success indicates whether the LLM output correctly followed the specified generation or revision instruction. These results indicate that the system can support timely generation and iterative revision in an interactive authoring context, providing a practical foundation for instructors to iteratively develop and refine their question design.
VI-B Case Study
We engaged our six experts (E1–E6) from the formative study to evaluate VizQStudio. After a brief overview of the system’s background and workflow, the experts used VizQStudio to iteratively design visualization literacy MCQs. From these sessions, we derived two case studies illustrating the system’s utility across diverse scenarios and student backgrounds.
VI-B1 Iterative Question Design from a Rough Draft
Experts E1 and E5 used VizQStudio to create MCQs starting from a rough idea, iteratively refining each question through feedback and simulation until it met their standards.
Student Profiles Settings and Adjustments. The experts began by describing their class in the Agent Profile View (Fig. 4-D): “My students mostly have a computer science background, with some design and business students. They are new to data visualization with limited foundational knowledge, and their learning traits are average.” The initial simulation revealed four clusters, mostly computer science majors with diverse learning traits and visualization knowledge. To better reflect classroom demographics, the experts refined the Demographic Settings in the Agent Setting View (Fig. 4-E), boosting the proportion of design and business students and reducing the number of CS students. After these changes, four balanced clusters emerged: two composed mainly of computer science students with varied abilities, one comprising primarily design students strong in Visual Processing and certain Knowledge Points, and one containing mostly business students with higher Critical Thinking ( Fig. 8-A).
Rough Question Description and Iterative Adjustments. With student profiles set, the experts moved to the Sample View (Fig. 4-A) to outline their question requirements. They started with a broad description: “I need a bar chart question to retrieve and compare values among different groups. It should not be overly straightforward. Include an interesting contextual background.” They kept the Feature View (Fig. 4-B) mostly at default, modifying only the Chart Type.
After the initial question generation and student response simulation, the experts reviewed the output (upper half of Fig. 8-B,C). They confirmed the question’s correctness and overall quality; simulated student feedback (Fig. 8-b1) indicated that most aspects, such as chart interpretation, were easy, with moderate complexity noted in context—matching the experts’ expectations. However, the initial accuracy rate was too high at (Fig. 8-c1), suggesting insufficient difficulty. Only one student from group 2, a junior with notably low traits, answered incorrectly (Fig. 8-a1). To raise the challenge level, the experts revisited the Feature View (Fig. 4-B), increasing both Number of Distractors and Plausibility, and switching the Chart Type to a line chart for additional complexity. Upon regeneration and simulation, the updated question offered four plausible distractors, reducing the accuracy to a more desirable (Fig. 8-c2). The newly introduced distractors involved visually similar line charts, requiring more careful inspection according to the updated student feedback ( Fig. 8-b2). Satisfied with the new difficulty level, the experts marked the question as “Checked”, finalizing it for classroom use.
VI-B2 Designing Misleading MCQs for Educational Purposes

Experts E2 and E3, instructors of an undergraduate data visualization course, used VizQStudio to iteratively design questions based on their lecture materials, tailoring them to the specific needs of their students.
Slide Upload and Requirement Specification. Seeking to emphasize the misleader Inappropriate Scale Range—where a non-zero y-axis skews the perceived proportions in a bar chart—they uploaded a related slide screenshot (provide in supplementary materials) and provided clear instructions: “I plan to create a misleading bar chart question that does not start at zero, thus skewing the perceived proportion between two items.” After confirming that the simulated student profile clusters matched their class composition, the experts proceeded to simulate student responses for their initial draft.
Identification of Common Error Reasoning. The generated question ( Fig. 4-c2) aligned well with the experts’ expectations and contained no clear errors. However, while the simulated students found it neither overly complex nor excessively tricky, the overall simulated accuracy rate was only (Fig. 9). To understand why, the experts examined detailed reasoning traces (Fig. 9-A). They saw that students who answered incorrectly typically proceeded directly to Verify bar heights right after Understand the question or Understand the options, neglecting the axis scale. In contrast, those who answered correctly either performed Examine Chart Data or explicitly Checked the Chart Axis, revealing distinctly different reasoning strategies (Fig. 9-B). Although few students indicated the need for hints (Fig. 9-C), the experts decided to include a subtle hint to draw attention to the axis scale, reinforcing this crucial visualization literacy concept rather than simply tricking students.
Question Revision and Resimulation. Returning to the question revision panel (Fig. 4-c3), the experts added a textual instruction: “Add a subtle hint to the question stem.” After regenerating the question with this minor change (Fig. 4-c7), a resimulation showed a clear improvement: more than of students now correctly recognized the misleading element by inspecting the axis scale before comparing bar heights ( Fig. 4-c5). Notably, simulated student feedback ( Fig. 4-c4) explicitly mentioned the increased recognition and utility of this hint. Both the original and revised questions were saved, reinforcing the value of guiding hints in this challenging question.
VI-C Real-World Classroom Experiment
After the expert interviews, we conducted a real-world classroom experiment (IRB-approved) to evaluate VizQStudio by assessing the quality of MCQs designed with the system from students’ perspectives and examining how well its simulated student performance aligns with real student outcomes. Collaborating with E3, we designed an in-class quiz for a lecture on Effective Visual Design for Data Storytelling.

Quiz Design and Setup. E3 sought to design MCQs that assess four critical knowledge points from the lecture: (1) effective color schemes for heatmaps, (2) scatterplots for visualizing variable relationships, (3) reduce visual clutter in line charts, and (4) potential misinterpretation with bar charts when the y-axis does not start at zero. Initially, E3 included two previously designed misleading bar chart questions—one with explicit hints and one without—to explore whether hints effectively guided students to identify misleading elements. Next, E3 used VizQStudio to upload relevant lecture slides and initial question descriptions, iteratively refining the questions based on simulated student feedback. This process balanced overall difficulty and yielded a final quiz of five questions. The students took this quiz during the following lecture, and the participation was voluntary, anonymous and IRB approved. A total of 12 students agreed to share data for research purposes. They rated each question on six dimensions aligned with our simulation metrics (Sec. IV-B-Simulating Student Responses), giving comments to the quiz question design, providing insights into both question quality and how well the simulated agents reflected the real student experiences.
Student Feedback and Agent Comparison. Overall, student feedback was very positive. Many noted strong alignment with the class materials, for instance: “They aligned with the class materials. I can see some of the heuristics and biases used in the graph design to manipulate and mislead data.” Others praised the visual clarity, calling it “visually pleasing” and describing the graphs as “interesting and nicely displayed”. We compared each question’s average accuracy between real students and the simulated agents designed by E3, and also computed Pearson correlations between real student ratings and simulated student feedback (Fig. 10). The results indicate that the simulated agents generally predicted student performance accurately, although they tended to slightly underestimate real students’ success (Fig. 10-A). As for the agents’ modeling of student ratings, performance varied across metrics (Fig. 10-B): the agents were more accurate in capturing context and visual comprehension, while relatively weaker in modeling data complexity or overall cognitive challenges.
In summary, our experiment demonstrates the effectiveness and reliability of our simulated student module in capturing genuine student perceptions and providing valuable guidance for MCQ refinement.
VI-D Large-Scale Online Study on Learning Outcomes and Simulation Validity
We conducted a large-scale online study to examine the educational impact of VizQStudio and the validity of its student simulation in supporting instructional design. The study addressed two research questions: (1) whether MCQs designed with the support of VizQStudio can function as effective instructional materials and lead to measurable learning outcomes in visualization literacy; and (2) whether the LLM-simulated reasoning strategies used during question design can credibly approximate common learner thinking patterns.
Study Design Overview. The study followed a two-stage design that mirrors a realistic instructional workflow: learner profiling, question design, instruction with feedback, and post-instruction assessment. Across all stages, learning objectives were controlled by focusing on a fixed set of five visualization misleaders, which served as the core knowledge construct.
Stage 1: Learner Profiling, Baseline Assessment, and Group Assignment. In Stage 1, participants were recruited via Prolific, of whom provided valid responses. Participants reported background information and completed self-report items assessing cognitive and visualization-related abilities, aligned with the learner attributes used in VizQStudio’s student simulation. Participants also completed a five-item visualization literacy pre-test (score range: –), with instructor-selected VLAT questions aligned with the visualization misleaders targeted in the tutorial.
Based on pre-test performance and demographic characteristics, participants were divided into two groups with comparable baseline scores and similar demographic distributions (Group 1: , Mean , SD ; Group 2: , Mean , SD ). To reduce memorization effects, pre-test items instantiated the target misleaders using chart types that differed from those used in later stages.
Teacher-Guided Question Design with VizQStudio. Instructors who had previously taught the visualization literacy course were invited to design instructional MCQs using VizQStudio. They were provided with the learner profiles of Group 1 and designed ten MCQs targeting the five misleaders (two questions per misleader). During this process, VizQStudio generated simulated reasoning traces for all 50 learners per question, recorded instructors’ edit logs, and clustered simulated reasoning to extract the five most frequent reasoning patterns per question.
Stage 2: Concept Instruction, MCQ-Based Learning, and Reasoning Alignment Tasks. Stage 2 was conducted three days after Stage 1, and participants were given a one-week window to complete all tasks. All participants first reviewed a tutorial introducing the visualization literacy concepts associated with the five misleaders, ensuring a shared instructional baseline.
Participants then completed a learning activity consisting of ten MCQs, which functioned as instructional materials rather than solely as assessment items. After responding to each question, participants were shown the correct answer along with an explanation to support conceptual understanding.
Participants in Group 1 completed the ten MCQs designed using VizQStudio, while participants in Group 2 completed ten VLAT MCQs covering the same knowledge points. The underlying misleaders were consistent across the pre-test, instructional MCQs, and post-test, while chart types and visual encodings were varied to promote conceptual transfer. For participants in Group 1, an additional reasoning alignment task was included after answering each MCQ. Specifically, participants were presented with the five most frequent reasoning strategies derived from clustering the LLM-simulated student reasoning traces for that question. Participants were asked to select the strategy that most closely matched their own thinking process. If none of the strategies adequately reflected their reasoning, participants could select an “Other” option and describe their reasoning in free text. After completing the learning activity, all participants completed a five-item post-test, consisting of VLAT questions selected to align with the same knowledge points assessed in the pre-test.
Of the participants who completed Stage 1, proceeded to Stage 2 with valid consent and tutorial completion, yielding valid responses in Group 1 (11 incomplete submissions) and in Group 2 (8 incomplete submissions).
VI-D1 Learning Outcomes and Learning Gains
Participants demonstrated improved visualization literacy following instruction in both conditions. Post-test performance was comparable across conditions (Group 1: Mean , SD , ; Group 2: Mean , SD , ) (Fig. 11-A), suggesting that learners were able to demonstrate similar levels of visualization literacy after engaging with either set of instructional MCQs.
Using matched pre–post data (), both groups exhibited statistically significant learning gains relative to their baseline performance. Group 1 showed a mean gain of (SD , ; paired -test, ), while Group 2 showed a mean gain of (SD , ; paired -test, ). Across all participants, the average learning gain was (SD ), with a 95% confidence interval of , indicating a consistent improvement in visualization literacy following the instructional activities.
To compare instructional conditions while accounting for baseline differences, we conducted an ANOVA with post-test score as the dependent variable and pre-test score as a covariate. The analysis revealed no significant effect of condition (group coefficient , ). Rather than aiming to outperform standardized instruments such as VLAT, this analysis evaluates whether MCQs authored with VizQStudio can achieve comparable learning outcomes under substantially more flexible design conditions. The absence of a significant difference indicates that, despite relying on instructor-driven generation and simulation rather than a fixed, curated item bank, VizQStudio-designed questions do not compromise learning effectiveness. This result points to the VizQStudio’s potential role at design time: supporting scalable, low-cost, and adaptable question authoring in instructional contexts where standardized tests are impractical due to curriculum mismatch, limited coverage, or the need for frequent iteration.
VI-D2 Validity of LLM-Simulated Reasoning Strategies
A central goal of VizQStudio is to support instructional design by simulating plausible student reasoning patterns. Accordingly, our evaluation focuses on whether LLM-simulated reasoning strategies can adequately represent common student thinking patterns observed during problem solving.
Coverage of Student Reasoning Patterns. Across participants and questions in Group 1 (i.e., reasoning alignment instances), of responses selected one of the five representative reasoning strategies derived from clustering the simulated reasoning traces. At the question level, coverage exceeded for all items, indicating that the majority of participants were able to identify a simulated reasoning strategy that closely matched their own thinking process.
Perceived Alignment with Simulated Reasoning Strategies. In addition to selecting a matching strategy, participants rated how well the provided strategies aligned with their own reasoning process on a five-point Likert scale. Across all questions and participants in Group 1, participants reported a generally high perceived alignment between the simulated reasoning strategies and their own thinking (Mean , SD , ), indicating that the LLM-simulated strategies were often perceived as capturing key aspects of students’ reasoning processes. This quantitative assessment complements the coverage results by capturing the degree of perceived similarity between simulated and self-reported student reasoning.
Analysis of Misalignment Cases. In cases where participants selected the “Other” option or reported lower alignment, free-form responses revealed that misalignment typically stemmed from heuristic estimation (e.g., approximate visual comparison without explicit stepwise reasoning), individual visual accessibility issues, or idiosyncratic reasoning shortcuts. For example, one participant noted that they “roughly compared the bar lengths visually and chose the closest option,” without explicitly following the multi-step comparison described in the simulated strategies. These responses suggest that mismatches often reflected differences in the level of reasoning granularity or articulation, rather than fundamentally distinct problem-solving approaches.
Relationship Between Simulation Alignment and Learning Outcomes. To examine whether alignment with simulated reasoning strategies relates to learning outcomes, we conducted exploratory analyses within Group 1. Neither participants’ average alignment ratings nor the frequency of “Other” selections showed a significant Pearson’s correlation with post-test performance (, ) [80]. This result suggests that alignment with simulated reasoning strategies is not strongly associated with individual learning outcomes, and that the primary role of the simulation lies in supporting instructional design rather than predicting learner performance.

VI-D3 Perceived Instructional Value
Participants reported positive perceptions of the MCQs as learning materials following the tutorial (Fig. 11-B). For the VizQStudio-designed MCQs (Group 1), participants rated the questions as clear (Conceptual Clarity: Mean , SD ) and cognitively engaging (Cognitive Challenge / Engagement: Mean , SD ), indicating that the teacher-authored questions produced with VizQStudio were accessible while still prompting active reasoning. Participants also reported that the provided answers and explanations effectively supported understanding (Feedback Effectiveness: Mean , SD ).
Beyond surface-level clarity and engagement, participants perceived the VizQStudio-designed MCQs as instructionally meaningful in diagnosing and supporting learning. Specifically, participants reported that the questions helped surface misunderstandings (Diagnostic Value: Mean , SD ) and supported preparation for answering similar visualization literacy questions (Learning Support / Preparedness: Mean , SD ). These perceptions suggest that the MCQs functioned not only as practice items but also as reflective learning prompts that encouraged learners to examine their reasoning.
To contextualize these perceptions, we compared Group 1 with a VLAT benchmark condition (Group 2), which exhibited overall comparable ratings across the same instructional-value dimensions (Fig. 10-B) (Conceptual Clarity: Mean , SD ; Cognitive Engagement: Mean , SD ; Diagnostic Value: Mean , SD ; Feedback Effectiveness: Mean , SD ; Learning Support: Mean , SD ). Taken together, these results indicate that teachers using VizQStudio can design instructional MCQs that learners perceive as effective learning materials, with overall instructional value comparable to VLAT questions in a tutorial-based learning context.
VI-D4 Teacher Revision Patterns and Human-in-the-Loop Safeguards
During teacher-guided question design, VizQStudio recorded detailed revision logs capturing how instructors iteratively refined each MCQ prior to deployment. Across the ten instructional MCQs designed for Stage 2, instructors revised each question multiple times, with an average of revisions per question (SD ) and an average authoring time of minutes per question (SD ).
Based on revision logs and instructor feedback, approximately half of the revisions focused on structural aspects of the question, such as modifying chart data or visual encodings to ensure correctness and clarity, while the remaining revisions were driven by inspecting simulated student reasoning and adjusting difficulty, distractors, or explanations accordingly. Notably, although chart-related revisions accounted for a substantial portion of revision events, they consumed a smaller share of total authoring time (approximately one-third), facilitated by flexible editing affordances such as direct chart manipulation and natural-language interaction with the LLM.
Together, these results indicate that VizQStudio supports an iterative, expert-driven design process in which model-generated drafts are efficiently corrected and pedagogically refined through simulation-informed exploration. Broader implications and limitations are discussed in Sec. VII.
VI-E Expert Interviews
Following the case studies, we conducted one-on-one interviews with six experts (E5–E10, including two from the case studies and four newly invited assistant professors specializing in visualization from two universities). Each interview lasted 60–80 minutes with a honorarium. For the newly invited experts, the session included a background introduction, system demonstration, hands-on trial, and feedback focusing on usability, workflow, and simulation reliability.
System Workflow. All experts praised VizQStudio’s workflow for its clarity, flexibility, and functionality. They particularly valued the system’s versatile question-generation methods, such as transforming rough inputs (e.g., lecture slide screenshots) into well-aligned questions targeting specific knowledge points. Experts also highlighted its intuitive editing features for both questions and student agents, support for free-form exploration in question creation, seamless integration with real-time simulation updates through a clear side-by-side interface, and robust version-saving capabilities. These features significantly streamlined the iterative design process.
Question Generation and Student Simulation Modules. All experts highlighted the Question Generation and Student Simulation modules as effective, stable, and insightful. They reported fast runtimes — approximately 20 seconds for question generation, 10 seconds for each LLM-driven update, and 30 seconds for student simulation with a typical class size of 30–40 students. Experts were particularly impressed by the quality and flexibility of the generated questions. For example, E8 remarked, “The generated questions are impressive. Even with just a rough idea or a slide, the system accurately captures my intent and produces charts and QAs with clear explanations. The editing panels further ensure the reliability of the questions while giving me fine-grained control.”
Experts highly praised the student simulation module for its potential to provide insights into students’ reasoning across different backgrounds, which can particularly help them design and test questions tailored to students’ needs. As E10 remarked, “I intentionally adjusted two groups of students — one with high general learning traits but low visualization knowledge, and the other with the opposite profile — to observe differences in their answers and reasoning. The results were impressive and could help me design more targeted questions for different groups, anticipate how they might think, and assess whether the question sets effectively support their intended learning outcomes.”
Visual Designs and Interactions. Experts consistently described the system’s visual design and interactions as clear and intuitive. The stacked bar charts were especially helpful for quickly gauging overall student feedback on the question, while the Sankey-like diagram effectively illustrated each group’s distribution of final answers and reasoning pathways. As E9 noted, “my top priorities are students’ perceptions and overall question difficulty, and the system effectively summarizes this while still allowing me to inspect each student’s reasoning.” The rich interaction methods also offered great flexibility, enabling experts to design and edit questions and student profiles through natural language input, button and slider interactions, as well as direct editing.
Suggestions. Experts offered several ideas for enhancing VizQStudio. E9 suggested reducing the number of default options in question features and providing full options only on demand to simplify the system. E10 and E7 recommended giving greater prominence to the overall question difficulty chart, as they tend to examine the difficulty across the entire question set first. E8 further proposed strengthening the linkage between the reasoning steps in the Sankey diagram and the learning traits and knowledge points, which could provide deeper insights into different student groups.
VII Discussion
This section synthesizes insights from our design and evaluation, situates our approach within broader educational and learner modeling research, and discusses limitations, ethical considerations, and implications for future work.
VII-A LLMs in Assessment Design: Multi-level Human Oversight as a Design Necessity.
While LLMs can effectively generate diverse question drafts, distractors, and plausible reasoning pathways, in practice they are most appropriately positioned as generative and exploratory tools. Correctness, pedagogical alignment, and final validation must remain under instructor control.
A central insight from our study is that effectively leveraging LLMs for assessment design requires multi-level instructor supervision. At a higher level, instructors benefited from interaction paradigms that allow them to communicate desired changes to LLMs in ways that resemble authentic teaching practice—for example, describing issues in natural language, requesting alternative formulations, or indicating (e.g., through sketching, annotation, or highlighting) which parts of a question or visualization require revision. Such interaction supports fluid exploration and refinement, enabling instructors to adjust LLM-generated question framing, distractors, or explanations without directly engaging with technical representations.
At the same time, our observations highlight that high-level interaction alone is insufficient for high-stakes educational materials. Instructors required precise, deterministic control over the final learning artifacts to ensure factual and conceptual correctness, particularly for visualization-based questions where small changes in data values, scales, or encodings can alter the underlying concept being assessed. This necessitates lower-level controls that allow instructors to directly verify and modify the concrete components of assessment materials.
In addition, grounding LLM generation in domain-specific references emerged as an important complement to both high- and low-level oversight. Incorporating instructor-provided examples, prior assessments, or openly available educational resources—together with techniques such as retrieval-augmented generation—helps anchor generation in curricular context and mitigates limitations of generic model knowledge.
Taken together, these insights suggest a broader design implication: in educational settings, effective LLM-supported authoring hinges not on minimizing human involvement, but on enabling instructors to move between expressive high-level interaction, precise low-level control, and context-aware grounding. Systems that foreground such multi-level oversight are better positioned to support responsible and pedagogically sound use of generative models.
VII-B Student Simulation in Assessment Design: Value, Limits, and Design Implications.
While we demonstrate that simulation can capture aggregate reasoning patterns, its primary pedagogical value lies in supporting instructors’ exploration of diverse reasoning patterns that may arise during assessment design. By making such patterns explicit, simulation enables instructors to examine both the strengths and the limitations of their assumptions about how students reason through visualization literacy tasks.
Results from the large-scale online study indicate that, at an aggregate level, LLM-simulated high-frequency reasoning strategies were often able to cover students’ self-reported thinking processes. Many participants identified at least one simulated strategy that closely matched their own reasoning, suggesting that simulation can effectively surface dominant and instructionally relevant reasoning patterns shared by many learners. This form of aggregate-level coverage is particularly valuable for assessment design, where instructors often need to reason about common misconceptions, typical solution paths, and broadly shared difficulties rather than about individual cognitive trajectories.
At the same time, our findings suggest the presence of blind spots in modeling opportunistic and heuristic reasoning strategies that can arise in authentic student responses. While simulated students were relatively effective at representing structured or “idealized” reasoning patterns—such as stepwise comparison or careful interpretation—they often failed to capture minimally effortful or shortcut-driven behaviors. For example, some participants reported relying on rough visual estimation (e.g., “I just eyeballed the bar lengths and chose the closest answer”) rather than the multi-step reasoning reflected in the simulated strategies. These cases highlight a gap between modeled reasoning and the pragmatic, sometimes coarse strategies that students employ in practice.
These limitations point to important design implications for future student simulation systems. While our current student profiles—constructed primarily from demographic attributes, cognitive ability levels, and targeted knowledge points—were sufficient to surface many common reasoning patterns, they remain incomplete. Prior work in the learning sciences suggests that students’ task performance is also shaped by factors such as metacognitive regulation, motivation, affective state, and engagement, which are not well captured by ability- or knowledge-centric profiles alone. Incorporating such dimensions into future simulation approaches may enable richer and more realistic representations of student reasoning, though doing so will require closer grounding in learning theory and empirical studies of learner cognition.
Overall, our findings position LLM-based student simulation as a reflective design instrument rather than a ground-truth model of learner behavior. By making plausible reasoning pathways and their breakdowns visible, simulation supports instructors’ exploration and comparison of how assessment designs may interact with learner diversity, while leaving pedagogical judgment and validation firmly in human hands.
VII-C Implications for Visualization Literacy Education
Our study offers several observations that inform broader discussions in visualization literacy education. In our sample, participants reported relatively high confidence in their visualization-related abilities, yet their baseline performance suggested more limited mastery of core concepts. In Stage 1, average self-assessed visualization ability exceeded four on a five-point scale, while the pre-test score averaged out of . Although this result should be interpreted cautiously, it points to a mismatch between learners’ perceived competence and their demonstrated ability on visualization literacy tasks.
This mismatch reflects a broader challenge in visualization education: difficulties often lie not in surface-level interpretation, but in reasoning about misleading encodings, proportional relationships, and contextual cues. Such gaps are unlikely to be revealed by static or correctness-only assessments. From this perspective, formative assessments that foreground reasoning, rather than answers alone, are particularly important for visualization literacy. Simulation-informed question design offers one way to prompt instructors to consider how different reasoning strategies, misunderstandings, or shortcuts may emerge, and to design questions that more effectively surface conceptual weaknesses.
VII-D Limitations and Ethical Considerations
Our study has several limitations that should be acknowledged. First, both question generation and student simulation rely on off-the-shelf LLMs, whose behavior is shaped by training data, prompting strategies, and ongoing model updates beyond our control. Consequently, generated questions, answers, and simulated reasoning traces cannot be assumed to be uniformly accurate, unbiased, or reproducible across time and deployment contexts. These characteristics require LLM outputs to be treated as provisional artifacts rather than authoritative representations of correctness or learner behavior.
Second, while the simulation was effective at surfacing common reasoning patterns at an aggregate level, it remains an incomplete representation of real student behavior. Opportunistic, heuristic, or minimally effortful strategies were not consistently captured, and learner profiles defined by demographic attributes, cognitive ability levels, and knowledge points necessarily simplify the richness of authentic learning contexts. These constraints limit the interpretability of simulated reasoning and reinforce the positioning of simulation as a design aid rather than a predictive model.
In this work, we sought to mitigate these limitations through de-identification, optional learner profiling, and explicit instructor control over both simulation parameters and assessment content. Nevertheless, these measures represent only partial safeguards. Future work is needed to develop more robust practices for bias auditing, transparency, and reproducibility in simulation-supported assessment design.
VII-E Generalizability and Future Directions
Beyond the visualization literacy context examined in this study, our findings suggest several directions in which simulation-informed assessment design may be explored further. One recurring insight concerns the use of simulated reasoning beyond question authoring. Rather than remaining solely a design-time tool, representative reasoning paths—both correct and incorrect—could be selectively reused as reflective feedback for learners, supporting comparison and metacognitive reflection rather than answer verification.
Instructors also discussed the value of simulation for adapting instructional materials to learners with different prior knowledge or disciplinary backgrounds. By exploring how plausible reasoning patterns shift across learner profiles, instructors could use simulation to adjust question framing, explanations, or scaffolding when preparing materials for different audiences or instructional contexts. Similarly, simulation was discussed as a way to reason about group-level dynamics, such as how differences in background knowledge might shape collaborative learning. Together, these directions point toward broader applications of simulation-informed design in educational settings where learning hinges on complex reasoning processes and instructor judgment.
VIII Conclusion
We introduced VizQStudio, a visual analytics system that supports educators in designing and refining MCQs for visualization literacy education. By integrating MLLM-based question generation with simulated student reasoning, we enables instructors to explore and iteratively refine question designs with respect to diverse learner profiles at design time. Through a multi-method evaluation, we examine the value and limitations of this approach and surface design insights on how visual analytics and MLLMs can be combined to support instructor-centered, flexible, and responsible assessment design in visualization literacy and related educational contexts.
References
- [1] Z. Pousman, J. Stasko, and M. Mateas, “Casual information visualization: Depictions of data in everyday life,” IEEE transactions on visualization and computer graphics, vol. 13, no. 6, pp. 1145–1152, 2007.
- [2] E. Segel and J. Heer, “Narrative visualization: Telling stories with data,” IEEE transactions on visualization and computer graphics, vol. 16, no. 6, pp. 1139–1148, 2010.
- [3] J. Heer and D. Boyd, “Vizster: Visualizing online social networks,” in IEEE Symposium on Information Visualization, 2005. INFOVIS 2005. IEEE, 2005, pp. 32–39.
- [4] M. Ruckenstein, “Visualized and interacted life: Personal analytics and engagements with data doubles,” Societies, vol. 4, no. 1, pp. 68–84, 2014.
- [5] D. Huang, M. Tory, B. A. Aseniero, L. Bartram, S. Bateman, S. Carpendale, A. Tang, and R. Woodbury, “Personal visualization and personal visual analytics,” IEEE transactions on visualization and computer graphics, vol. 21, no. 3, pp. 420–433, 2014.
- [6] S. Stokes, “Visual literacy in teaching and learning: A literature perspective,” Electronic Journal for the integration of Technology in Education, vol. 1, no. 1, pp. 10–19, 2002.
- [7] A.-M. Brady, “Assessment of learning with multiple-choice questions,” Nurse Education in Practice, vol. 5, no. 4, pp. 238–242, 2005.
- [8] A. C. Butler, “Multiple-choice testing in education: Are the best practices for assessment also good for learning?” Journal of Applied Research in Memory and Cognition, vol. 7, no. 3, pp. 323–331, 2018.
- [9] S. Lee, S.-H. Kim, and B. C. Kwon, “Vlat: Development of a visualization literacy assessment test,” IEEE transactions on visualization and computer graphics, vol. 23, no. 1, pp. 551–560, 2016.
- [10] E. E. Firat, A. Joshi, and R. S. Laramee, “Interactive visualization literacy: The state-of-the-art,” Information Visualization, vol. 21, no. 3, pp. 285–310, 2022.
- [11] B. Alper, N. H. Riche, F. Chevalier, J. Boy, and M. Sezgin, “Visualization literacy at elementary school,” in Proceedings of the 2017 CHI conference on human factors in computing systems, 2017, pp. 5485–5497.
- [12] L. W. Ge, Y. Cui, and M. Kay, “Calvi: Critical thinking assessment for literacy in visualizations,” in Proceedings of the 2023 CHI conference on human factors in computing systems, 2023, pp. 1–18.
- [13] S. Pandey and A. Ottley, “Mini-vlat: A short and effective measure of visualization literacy,” in Computer Graphics Forum, vol. 42, no. 3. Wiley Online Library, 2023, pp. 1–11.
- [14] J. Collins, “Writing multiple-choice questions for continuing medical education activities and self-assessment modules,” Radiographics, vol. 26, no. 2, pp. 543–551, 2006.
- [15] M. H. Towns, “Guide to developing high-quality, reliable, and valid multiple-choice assessments,” Journal of Chemical Education, vol. 91, no. 9, pp. 1426–1431, 2014.
- [16] J. Considine, M. Botti, and S. Thomas, “Design, format, validity and reliability of multiple choice questions for use in nursing research and education,” Collegian, vol. 12, no. 1, pp. 19–24, 2005.
- [17] M.-K. Kim, R. A. Patel, J. A. Uchizono, and L. Beck, “Incorporation of bloom’s taxonomy into multiple-choice examination questions for a pharmacotherapeutics course,” American journal of pharmaceutical education, vol. 76, no. 6, p. 114, 2012.
- [18] J. K. Gilbert, “Visualization: A metacognitive skill in science and science education,” in Visualization in science education. Springer, 2005, pp. 9–27.
- [19] J. Sorva, V. Karavirta, and L. Malmi, “A review of generic program visualization systems for introductory programming education,” ACM Transactions on Computing Education (TOCE), vol. 13, no. 4, pp. 1–64, 2013.
- [20] N. Presmeg, “Research on visualization in learning and teaching mathematics,” Handbook of research on the psychology of mathematics education, pp. 205–235, 2006.
- [21] C. N. Knaflic, Storytelling with data: A data visualization guide for business professionals. John Wiley & Sons, 2015.
- [22] W. Fu, B. Wei, J. Hu, Z. Cai, and J. Liu, “Qgeval: A benchmark for question generation evaluation,” arXiv e-prints, pp. arXiv–2406, 2024.
- [23] S. Lamsiyah, A. El Mahdaouy, A. Nourbakhsh, and C. Schommer, “Fine-tuning a large language model with reinforcement learning for educational question generation,” in International Conference on Artificial Intelligence in Education. Springer, 2024, pp. 424–438.
- [24] K. Li and Y. Zhang, “Planning first, question second: An llm-guided method for controllable question generation,” in Findings of the Association for Computational Linguistics ACL 2024, 2024, pp. 4715–4729.
- [25] Y. Chen, C. Wu, S. Yan, P. Liu, and Y. Xiao, “Dr. academy: A benchmark for evaluating questioning capability in education for large language models,” in Proceedings of the 62nd Annual Meeting of the Association for Computational Linguistics (Volume 1: Long Papers), 2024, pp. 3138–3167.
- [26] H. Luo, Y. Deng, Y. Shen, S. K. Ng, and T.-S. Chua, “Chain-of-exemplar: Enhancing distractor generation for multimodal educational question generation,” in Proceedings of the 62nd Annual Meeting of the Association for Computational Linguistics (Volume 1: Long Papers), 2024, pp. 7978–7993.
- [27] W. Xing, T. Zhu, J. Wang, and B. Liu, “A survey on mllms in education: Application and future directions,” Future Internet, 2024.
- [28] W. Ding, Y. Zhang, J. Wang, A. Jatowt, and Z. Yang, “Exploring union and intersection of visual regions for generating questions, answers, and distractors,” in Proceedings of the 2024 Conference on Empirical Methods in Natural Language Processing, 2024, pp. 1479–1489.
- [29] K. Börner, A. Bueckle, and M. Ginda, “Data visualization literacy: Definitions, conceptual frameworks, exercises, and assessments,” Proceedings of the National Academy of Sciences, vol. 116, no. 6, pp. 1857–1864, 2019.
- [30] M. Avgerinou and J. Ericson, “A review of the concept of visual literacy,” British journal of educational technology, vol. 28, no. 4, pp. 280–291, 1997.
- [31] P. Ruchikachorn and K. Mueller, “Learning visualizations by analogy: Promoting visual literacy through visualization morphing,” IEEE transactions on visualization and computer graphics, vol. 21, no. 9, pp. 1028–1044, 2015.
- [32] L. Y.-H. Lo, Y. Ming, and H. Qu, “Learning vis tools: Teaching data visualization tutorials,” in 2019 IEEE Visualization Conference (VIS). IEEE, 2019, pp. 11–15.
- [33] L. Yang, C. Xiong, J. K. Wong, A. Wu, and H. Qu, “Explaining with examples: Lessons learned from crowdsourced introductory description of information visualizations,” IEEE Transactions on Visualization and Computer Graphics, vol. 29, no. 3, pp. 1638–1650, 2021.
- [34] G. Kindlmann and C. Scheidegger, “An algebraic process for visualization design,” IEEE transactions on visualization and computer graphics, vol. 20, no. 12, pp. 2181–2190, 2014.
- [35] C. X. Bearfield, L. Van Weelden, A. Waytz, and S. Franconeri, “Same data, diverging perspectives: The power of visualizations to elicit competing interpretations,” IEEE Transactions on Visualization and Computer Graphics, 2024.
- [36] C. Nobre, K. Zhu, E. Mörth, H. Pfister, and J. Beyer, “Reading between the pixels: Investigating the barriers to visualization literacy,” in Proceedings of the 2024 CHI Conference on Human Factors in Computing Systems, 2024, pp. 1–17.
- [37] Q. Zhu, L. Y.-H. Lo, M. Xia, Z. Chen, and X. Ma, “Bias-aware design for informed decisions: Raising awareness of self-selection bias in user ratings and reviews,” Proceedings of the ACM on Human-Computer Interaction, vol. 6, no. CSCW2, pp. 1–31, 2022.
- [38] L. Y.-H. Lo, Y. Cao, L. Yang, and H. Qu, “Why change my design: Explaining poorly constructed visualization designs with explorable explanations,” IEEE Transactions on Visualization and Computer Graphics, vol. 30, no. 1, pp. 955–964, 2023.
- [39] L. Y.-H. Lo, A. Gupta, K. Shigyo, A. Wu, E. Bertini, and H. Qu, “Misinformed by visualization: What do we learn from misinformative visualizations?” in Computer Graphics Forum, vol. 41, no. 3. Wiley Online Library, 2022, pp. 515–525.
- [40] J. Hong, C. Seto, A. Fan, and R. Maciejewski, “Do llms have visualization literacy? an evaluation on modified visualizations to test generalization in data interpretation,” IEEE Transactions on Visualization and Computer Graphics, 2025.
- [41] Y. Cui, W. G. Lily, Y. Ding, F. Yang, L. Harrison, and M. Kay, “Adaptive assessment of visualization literacy,” IEEE Transactions on Visualization and Computer Graphics, vol. 30, no. 1, pp. 628–637, 2023.
- [42] S. Beschi, D. Falessi, S. Golia, and A. Locoro, “Characterizing data visualization literacy: a systematic literature review,” arXiv preprint arXiv:2503.14468, 2025.
- [43] M. Xia, R. P. Velumani, Y. Wang, H. Qu, and X. Ma, “Qlens: Visual analytics of multi-step problem-solving behaviors for improving question design,” IEEE Transactions on Visualization and Computer Graphics, vol. 27, no. 2, pp. 870–880, 2020.
- [44] Z. Chen, J. Wang, M. Xia, K. Shigyo, D. Liu, R. Zhang, and H. Qu, “Stugptviz: A visual analytics approach to understand student-chatgpt interactions,” IEEE Transactions on Visualization and Computer Graphics, 2024.
- [45] E. L. Glassman, A. Lin, C. J. Cai, and R. C. Miller, “Learnersourcing personalized hints,” in Proceedings of the 19th ACM conference on computer-supported cooperative work & social computing, 2016, pp. 1626–1636.
- [46] Y. Liu, Z. Wen, L. Weng, O. Woodman, Y. Yang, and W. Chen, “Sprout: an interactive authoring tool for generating programming tutorials with the visualization of large language models,” IEEE Transactions on Visualization and Computer Graphics, 2024.
- [47] J. L. Little and E. L. Bjork, “Optimizing multiple-choice tests as tools for learning,” Memory & cognition, vol. 43, pp. 14–26, 2015.
- [48] X. Yuan, T. Wang, Y.-H. Wang, E. Fine, R. Abdelghani, P. Lucas, H. Sauzéon, and P.-Y. Oudeyer, “Selecting better samples from pre-trained llms: A case study on question generation,” arXiv preprint arXiv:2209.11000, 2022.
- [49] X. Zeng, H. Lin, Y. Ye, and W. Zeng, “Advancing multimodal large language models in chart question answering with visualization-referenced instruction tuning,” IEEE Transactions on Visualization and Computer Graphics, 2024.
- [50] X. Wang, S. T. Talluri, C. Rose, and K. Koedinger, “Upgrade: Sourcing student open-ended solutions to create scalable learning opportunities,” in Proceedings of the Sixth (2019) ACM Conference on Learning@ Scale, 2019, pp. 1–10.
- [51] X. Lu, S. Fan, J. Houghton, L. Wang, and X. Wang, “Readingquizmaker: a human-nlp collaborative system that supports instructors to design high-quality reading quiz questions,” in Proceedings of the 2023 CHI Conference on Human Factors in Computing Systems, 2023, pp. 1–18.
- [52] S. Sarsa, P. Denny, A. Hellas, and J. Leinonen, “Automatic generation of programming exercises and code explanations using large language models,” in Proceedings of the 2022 ACM Conference on International Computing Education Research-Volume 1, 2022, pp. 27–43.
- [53] I. Yeckehzaare, T. Barghi, and P. Resnick, “Qmaps: Engaging students in voluntary question generation and linking,” in Proceedings of the 2020 CHI conference on human factors in computing systems, 2020, pp. 1–14.
- [54] D. R. Thomas, S. Gupta, E. Gatz, C. Tipper, and K. R. Koedinger, “So you want to be a tutor? professional development and scenario-based training for adult tutors,” in The Learning Ideas Conference. Springer, 2023, pp. 537–547.
- [55] Z. Zhang, D. Zhang-Li, J. Yu, L. Gong, J. Zhou, Z. Hao, J. Jiang, J. Cao, H. Liu, Z. Liu et al., “Simulating classroom education with llm-empowered agents,” arXiv preprint arXiv:2406.19226, 2024.
- [56] S. Xu, H.-N. Wen, H. Pan, D. Dominguez, D. Hu, and X. Zhang, “Classroom simulacra: Building contextual student generative agents in online education for learning behavioral simulation,” arXiv preprint arXiv:2502.02780, 2025.
- [57] U. Lee, S. Lee, J. Koh, Y. Jeong, H. Jung, G. Byun, Y. Lee, J. Moon, J. Lim, and H. Kim, “Generative agent for teacher training: Designing educational problem-solving simulations with large language model-based agents for pre-service teachers,” in NeurIPS’23 Workshop on Generative AI for Education (GAIED), 2023.
- [58] S. Pan, R. Schmucker, B. G. B. Bueno, S. A. Llanes, F. A. Alarcón, H. Zhu, A. Teo, and M. Xia, “Tutorup: What if your students were simulated? training tutors to address engagement challenges in online learning,” arXiv preprint arXiv:2502.16178, 2025.
- [59] J. M. Markel, S. G. Opferman, J. A. Landay, and C. Piech, “Gpteach: Interactive ta training with gpt-based students,” in Proceedings of the tenth acm conference on learning@ scale, 2023, pp. 226–236.
- [60] H. Jin, M. Yoo, J. Park, Y. Lee, X. Wang, and J. Kim, “Teachtune: Reviewing pedagogical agents against diverse student profiles with simulated students,” arXiv preprint arXiv:2410.04078, 2024.
- [61] Y. Choi, E. J. Kang, S. Choi, M. K. Lee, and J. Kim, “Proxona: Leveraging llm-driven personas to enhance creators’ understanding of their audience,” arXiv preprint arXiv:2408.10937, 2024.
- [62] Y.-S. Chuang, A. Goyal, N. Harlalka, S. Suresh, R. Hawkins, S. Yang, D. Shah, J. Hu, and T. T. Rogers, “Simulating opinion dynamics with networks of llm-based agents,” arXiv preprint arXiv:2311.09618, 2023.
- [63] J. He-Yueya, N. D. Goodman, and E. Brunskill, “Evaluating and optimizing educational content with large language model judgments,” arXiv preprint arXiv:2403.02795, 2024.
- [64] X. Lu and X. Wang, “Generative students: Using llm-simulated student profiles to support question item evaluation,” in Proceedings of the Eleventh ACM Conference on Learning@ Scale, 2024, pp. 16–27.
- [65] D. R. Krathwohl, “A revision of bloom’s taxonomy: An overview,” Theory into practice, vol. 41, no. 4, pp. 212–218, 2002.
- [66] J. Sweller, “Cognitive load during problem solving: Effects on learning,” Cognitive science, vol. 12, no. 2, pp. 257–285, 1988.
- [67] P. A. Carpenter and P. Shah, “A model of the perceptual and conceptual processes in graph comprehension,” Journal of experimental psychology. Applied, vol. 4, no. 2, pp. 75–100, 1998.
- [68] Z. Chen, S. Song, K. Shum, Y. Lin, R. Sheng, and H. Qu, “Unmasking deceptive visuals: Benchmarking multimodal large language models on misleading chart question answering,” arXiv preprint arXiv:2503.18172, 2025.
- [69] T. Kinkner and J. McKillip, “Fundamentals of item response theory,” Evaluation practice, vol. 14, no. 2, pp. 191–193, 1993.
- [70] A. T. Corbett and J. R. Anderson, “Knowledge tracing: Modeling the acquisition of procedural knowledge,” User modeling and user-adapted interaction, vol. 4, no. 4, pp. 253–278, 1995.
- [71] E. Rich, “User modeling via stereotypes,” Cognitive science, vol. 3, no. 4, pp. 329–354, 1979.
- [72] A. Kobsa, “Generic user modeling systems,” User modeling and user-adapted interaction, vol. 11, no. 1-2, pp. 49–63, 2001.
- [73] K. Exley and R. Dennick, Small group teaching: Tutorials, seminars and beyond. Routledge, 2004.
- [74] M. S. Sharif, M. T. Tamang, D. Mani, and W. Elmedany, “Application of clustering algorithms to enhance personalized learning through recommendation model,” in 2024 International Conference on Innovation and Intelligence for Informatics, Computing, and Technologies (3ICT). IEEE, 2024, pp. 547–552.
- [75] E. Arslan, A. Özkaymak, and N. Ö. Dönmez, “Clustering students based on gamification user types and learning styles,” arXiv preprint arXiv:2310.14430, 2023.
- [76] P. Hämäläinen, M. Tavast, and A. Kunnari, “Evaluating large language models in generating synthetic hci research data: a case study,” in Proceedings of the 2023 CHI Conference on Human Factors in Computing Systems, 2023, pp. 1–19.
- [77] Y. Chang, X. Wang, J. Wang, Y. Wu, L. Yang, K. Zhu, H. Chen, X. Yi, C. Wang, Y. Wang et al., “A survey on evaluation of large language models,” ACM transactions on intelligent systems and technology, vol. 15, no. 3, pp. 1–45, 2024.
- [78] N. Wang, Z. Peng, H. Que, J. Liu, W. Zhou, Y. Wu, H. Guo, R. Gan, Z. Ni, J. Yang et al., “Rolellm: Benchmarking, eliciting, and enhancing role-playing abilities of large language models,” in Findings of the Association for Computational Linguistics: ACL 2024, 2024, pp. 14 743–14 777.
- [79] N. Reimers and I. Gurevych, “Sentence-bert: Sentence embeddings using siamese bert-networks,” arXiv preprint arXiv:1908.10084, 2019.
- [80] J. Benesty, J. Chen, Y. Huang, and I. Cohen, “Pearson correlation coefficient,” in Noise reduction in speech processing. Springer, 2009, pp. 1–4.
![[Uncaptioned image]](2603.00994v1/chenzixin.png) |
Zixin Chen is currently a Ph.D. candidate from Hong Kong University of Science and Technology. His research centers on Data Visualization and Human-AI Collaboration, with a particular emphasis on leveraging them in LLM for Education. He designs interactive tools that support teaching and pedagogical decision-making, personalize learning experiences, and makes LLM behavior more trustworthy for both learners and educators. In parallel, he explores the broader applicability of LLM-driven models and systems in other significant domains (AI4Health and AI4Science). More information: https://cinderd.github.io/. |
![[Uncaptioned image]](2603.00994v1/YuhangZeng.jpg) |
Yuhang Zeng is currently s a Master’s student in Computational Data Science at Carnegie Mellon University. He received his B.S. degree in Data Science and Technology and Computer Science from the Hong Kong University of Science and Technology. His research interests include data visualization, human–AI interaction, and interactive AI systems, with a particular focus on integrating large language models into visual analytics and educational tools. |
![[Uncaptioned image]](2603.00994v1/sichengsong.png) |
Sicheng Song received Ph.D. from the School of Computer Science and Technology at East China Normal University, in 2024. He is a Postdoctoral Research Fellow in the Computer Science and Engineering at the Hong Kong University of Science and Technology. His main research interests include information visualization and visual analysis. For more details, please refer to https://ByShawn.github.io/. |
![[Uncaptioned image]](2603.00994v1/yannalin.jpg) |
Yanna Lin is currently a postdoctoral researcher at the University of Waterloo. She received her Ph.D. from the Hong Kong University of Science and Technology and her B.Eng. from Sun Yat-sen University. Her research interests include data visualization and human–computer interaction (HCI), with a focus on designing intuitive interfaces and developing algorithms to enhance data communication and analysis, ultimately supporting data-driven decision-making. For more information, please visit: https://yannahhh.github.io/. |
![[Uncaptioned image]](2603.00994v1/xianxu.png) |
Xian Xu received the BA degree in directing from the Central Academy of Drama, China, the MFA degree in Studies of Drama, and the PhD degree in computational media and arts from HKUST VisLab. She is a tenure-track Assistant Professor at the Department of Digital Arts and Creative Industries, Lingnan University, Hong Kong. She is a visiting fellow at the University of Oxford and the University of Cambridge. Apart from her research work, she is also a television and film scriptwriter. |
![[Uncaptioned image]](2603.00994v1/huaminqu.png) |
Huamin Qu is the dean of the Academy of Interdisciplinary Studies, head of the Division of Emerging Interdisciplinary Areas, and a chair professor in the Department of Computer Science and Engineering at HKUST. He obtained a BS in Mathematics from Xi’an Jiaotong University, China, an MS, and a PhD in Computer Science from the Stony Brook University. His main research interests are in visualization and human-computer interaction, with focuses on urban informatics, social network analysis, Elearning, text visualization, and explainable artificial intelligence More information: http://huamin.org/. |
![[Uncaptioned image]](2603.00994v1/mengxia.png) |
Meng Xia is an assistant professor in the Department of Computer Science and Engineering at Texas A&M University. She obtained a Ph.D. degree from the Hong Kong University of Science and Technology and worked as a Postdoc at Carnegie Mellon University and Korea Advanced Institute of Science and Technology, respectively. Her research interests mainly focus on Human-AI Interaction, Data Visualization, and Education Technology. More details can be found at https://www.xiameng.org. |