[1,2]\fnmMario \surChemnitz
1]\orgnameLeibniz Institute of Photonic Technology, \orgaddress\streetAlbert-Einstein-Str.9, \cityJena, \postcode07745, \countryGermany 2]\orgdivInstitute of Applied Optics and Biophysics, \orgnameFriedrich Schiller University Jena, \orgaddress\streetPhilosophenweg 7, \cityJena, \postcode07743, \countryGermany
Kerr-induced Spectral Interferometry for Direct Ultra-sensitive Phase Recovery
Abstract
Measuring the phase of light is fundamental to optical imaging, sensing, and signal processing applications. Conventional optical phase measurements rely on multipath configurations, bulky interferometric setups, and computationally intensive data pipelines, limiting scalability, robustness, and practicality. We introduce a technique that allows for reference-free in-line phase retrieval of abrupt phase transitions in optical pulses directly from spectral measurements. Theory, simulations, and experiments concurrently explain the effect as a result of a Kerr-mediated interference between a projected linear wave component and the high-intensity residual of the phase-altered pulse. Utilizing this phenomenon, we demonstrate algorithm-free phase measurements of up to sensitivity and shot-to-shot signal prominence at 13 dB above noise at 80 MHz rates and 50 pJ pulse energies. This approach offers new paths toward the use of femtosecond pulses as broadband data carriers for optical communications, information processing, and direct high-throughput phase imaging.
keywords:
Nonlinear fiber optics, Nonlinear interferometry, Optical phase recovery, Optical information processing1 Introduction
Phase is a fundamental degree of freedom of light and indispensable to encode, sense and manipulate optical information in photonic techologies. Data is encoded through precise phase modulation schemes in modern telecommunications [Comm_ref1] and optical information processing systems [MZI_ref1, Ozcan_ref1, gigan_ref1]. In sensing and bioimaging, phase provides label-free imaging of transparent, low-contrast specimens [biomedicineQPI_ref1, tomography_ref1, production_ref1]. Additionally, optical phase manipulation through spatio-temporal pulse shaping techniques allows generation of tailored waveforms for ultrafast applications [pulseshaping_ref1, fsSLM_ref1] and for aberration correction in optical setups [AO_ref1].
A wide range of phase-retrieval techniques have matured over the years to address specific challenges linked to precise phase measurements. However, retrieving phase from intensity-only measurements is fundamentally challenging and requires prior information or sophisticated multi-path experimental setups for reliable recovery. Interferometric and holographic techniques [holographyQPI_ref2], known for their high precision in controlled environments, come with the challenge of being bulky and highly sensitive to environmental conditions. Fiber-based interferometers [SMFinterferometer_ref2, UMZI_ref2, fiber_roztocki2021arbitrary] and on-chip implementations [onchipMZI_ref2] are compact, but require active feedback control and stabilization, while remaining dependent on reference beams. Self-referencing schemes such as FROG[FROG_ref2], SPIDER [SPIDER_ref2], SRSI[SRSI_ref2] have become fundamental in ultrafast pulse characterization, however, these techniques face challenges such as limited wavelength ranges, complex optical alignment requirements, and intrinsic ambiguity of phase-retrieval algorithms. Traditional iterative algorithms [gerchberg1972_ref2, retrivalALG_ref2] that once required thousands of iterations can now be reduced to orders of magnitude faster processing through advanced computational techniques [DL_ref2, realPYT_ref2, fourierPYT_ref2]. Yet, they need large training datasets and pose risks of reduced interpretability or artifacts, which limits their generalization for experimental data. These bottlenecks highlight the need for a reference- and algorithm-free, optical setup that can achieve high-throughput phase recovery across imaging and communication applications.
In this work, we demonstrate a reference- and algorithm-free technique for spectrally distributed phase recovery using weak nonlinear phase modulation in fiber. Here, we reveal for the first time the origin of this new phenomenon by means of theory, simulation, and experiment, and show that weak nonlinear Kerr effects can transform spectral phase shifts into intensity peaks. Valid operating ranges of input parameters in terms of pulse width, peak power, and phase magnitude, are identified for interferometric measurements. Our framework generalizes earlier empirical approaches of describing similar phenomena, such as the spectral peaking effect [peaking_ref3, ramanPeak_discussion, modelock] which was previously used to reveal gas absorption lines and realize frequency combs. Utilizing off-the-shelf fiber components in a fully fiber-integrated setup, we highlight the method’s capabilities in sensing and imaging by means of two spectrometric measurement techniques: We find an extraordinary phase sensitivity of using grating-based spectrometry and illustrate the potential for post-processing-free phase sensing at above 13 dB SNR using shot-to-shot phase measurements at an 80 MHz laser repetition rate. Overall, this work introduces a new application of weakly nonlinear fibers for direct sensing, imaging and optical information processing.
2 Results
2.1 Self-referenced Intra-pulse Interometry
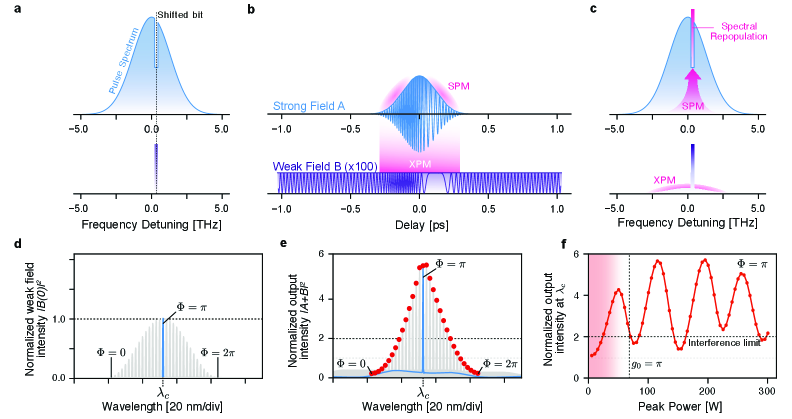
The propagation of intense electromagnetic pulses through optical Kerr media is commonly accompanied by nonlinear effects, such as self-phase modulation, leading to characteristic modulations in the measured intensity spectrum (Fig. 1a,b). Those spectral modulation, while sensitive to pulse power, shape, and phase (e.g., chirp) usually do not directly reveal phase information of the incident pulses.
A nonlinear medium, like a highly nonlinear optical fiber, can reveal discontinuos spectral phase modifications through intra-pulse interference between linear and nonlinear wave contributions. To formalize this phenomenon, we begin by expressing the pulse as a complex field in the spectral domain and introduce a narrowband phase filter (bit), defined as the combination of two Heaviside phase steps (see Appendix A).
The temporal impulse response of such a phase filter with shift we found to be
| (1) |
where is the central wavelength and is the bandwidth of the bit. If we consider narrow bit widths below 100 GHz, the temporal span of the sinc, defined as the coherence time ps, significantly exceeds the pulse width of sub-picoseond pulses. The sinc can hence be approximated with the first-order Taylor expansion for arguments near zero, which yields
| (2) |
Convolving this reponse with the temporal field yields a continuous-wave (CW) background (Fig.1d) that overlaps with the remaining temporal components of the pulse:
| (3) |
The input field hence consists of a modified pulse and a CW contribution at the spectral location of the introduced bit. Notably, the intensity of the weak field, and hence the energy taken from the pulse, is phase dependent and follows a behaviour, as shown in Fig. 2d.
Propagation this self-referenced composite field through a highly nonlinear fiber or a waveguide reveals a highly non-trivial dynamics: if perturbations remain small, the strong field undergoes self-phase modulation (SPM) and additionalluy modulates the phase of the weak field due to cross-phase modulation (XPM) (see Fig. 2b). The interference of both phase-shifted contributions is able to bring out the phase in the measured intensity as a prominant spectral feature, visible in Fig. 1e.
Within the weakly nonlinear limit, the relative intensity upon interference at can be found to be
| (4) |
with and being the spectral intensity at the input and output of the nonlinear waveguide. The linear-XPM coefficient and the SPM ratio are defined as
| (5) |
where is the pulse energy and is the spectral auto-correlation (see Appendix B for the full derivation).
To illustrate the dependence on phase and peak power, we may assume a transform-limited Gaussian pulse probed at its carrier frequency (). Doing so, evaluates to a purely imaginary number , where is the nonlinear gain defined by the nonlinear parameter of the waveguide , the waveguide length and the peak power of the optical pulse . Substituting into Eq. (4) and retaining only the leading XPM correction yields a closed-form result
| (6) |
Two key features emerge directly from Eq. (6): First, the phase sensitivity is sinusoidal, i.e., the interference term is maximised at and vanishes at and , where the phase-rotated input field is orthogonal to the purely imaginary SPM contribution and no coherent beating occurs (Fig. 2e). Second, at fixed , grows linearly with power in the weak-gain regime () before the quadratic SPM floor takes over, setting a practical operating window for analog phase read-out (Fig. 2f).
Yet, while illustrative, Eq. (6) does not reveal the full dynamics of the phenomenon. In particular, experimental observations show spectral peaks with much greater prominence than expected from interference alone. The perturbative treatment requires , beyond which the weakly nonlinear approximation breaks down. Moreover, the input spectrum is assumed unperturbed, i.e., unmodified by the phase encoding, whereas in reality the energy transferred into the CW mode notches the pulse spectrum at in a -dependent manner (cf. Fig. 2).
Coupled mode theory allows to address both limitations. Solving the coupled equations for the strong field and the weak field (see Methods) reveals several key observations: First, SPM leads predominantly to energy transfer to the spectral notch, an effect that has been observed earlier for amplitude-filtered pulses by Präkelt et al. [2005filling]. Second, this spectral fill-up can exceed the original spectral intensity significantly leading to a considerable spectral amplification above the typical factor-of-four bound of a single interference, in particular once combined with the weak field, as shown in Fig. 2e. Lastly, the spectral intensity peak indeed oscillates for peak powers, and hence nonlinear gain, beyond the weakly nonlinear limit, visible in Fig. 2f, which is a result of the nonlinear phase rotation.
We refer to the entirty of the nonlinear interference dynamics as Kerr-induced spectral interferometry to avoid confusion with the nonlinear interference of two intense waves in -nonlinear crystals. The key characteristics of the Kerr-induced interferometry features a distinct, power-dependent intensity peak after nonlinear propagation at the spectral locations where the femtosecond pulse undergoes an abrupt phase change.
2.2 Single-Bit Analysis
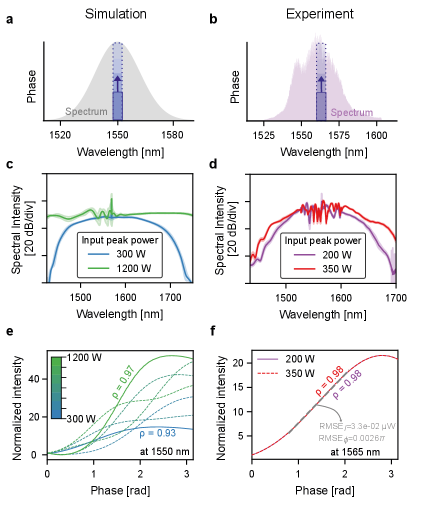
To experimentally verify the nonlinear phase-to-intensity mapping (Fig. 1c), a narrowband phase bit was introduced on the laser spectra using a programmable spectral phase modulator (WaveShaper). The modulated pulse is then propogated through 5 m of normal dispersive, highly nonlinear fiber (HNLF). The nonlinear interference occurs during propagation and the resulting phase-to-intensity mapping can be readout using an optical spectral analyzer (OSA).
Since practical laser setups are commonly limited in peak power, we studied the power dependency of the effect numerically. Linear phase-to-intensity mapping persists across a broad power range. Our simulations for peak power levels from 300 to 1200 W show, even when the spectrum significantly broadens, due to nonlinear frequency generation, the intensity-mapped phase information remains in the spectral position (Fig. 3c). At this spectral position, we observe a close to linear dependency of the output intensity to the input phase magnitude. The Pearson correlation, defined by , where represents intensity and represents phase, is close to 1 for all power levels supporting the linear trend (Fig. 3e).
Experimental measurements confirm the linear phase-to-intensity mapping, despite spectral distortions at higher powers. Measurements were performed at 200 and 350 W peak power and 200 fs pulse duration. Pulse and fiber imperfections as well as additional nonlinearity through optical amplification before encoding lead to differences between measured and simulated spectra. Nonetheless, the general linear trend between phase and peak amplitude at the bit‘s spectral location remains for all tested settings in simulation and experiment. Even in cases where the peak prominence severly declines in measured data (e.g., see Fig. 3d or Fig C5 in Appendix C), the spectral output at bit position shows strictly linear behavior. For instance, the two measured power settings illustrated in Fig. 3 features a high Pearson correlation of 0.98 (Fig.3f).
Remarkably, we estimate a extraordinary phase sensitivity of within the range of and from the root-mean-square error of the linear fit (see Appendix C2). This is well at the current state-of-the-art in phase retrieval techniques, where most recent techniques, such as Zernike wavefront imaging microscopy reported on record high sensitivities of [Gentner2024].
The effect is well scalable to multiple frequencies. Repeating the experiment with two individual phase bits show that nearby bits remain spectrally independent, while their spectral response acts on in-band phase variations, yet not on the changes of neighboring bands. Both simulations and experiments confirm that the spectral positions of the two bits are preserved (see Appendix D). Here, we have kept the power in the experiment low to be able to distinguish intensity peaks from the nonlinear background modulations.
2.3 Distributed Phase Recovery
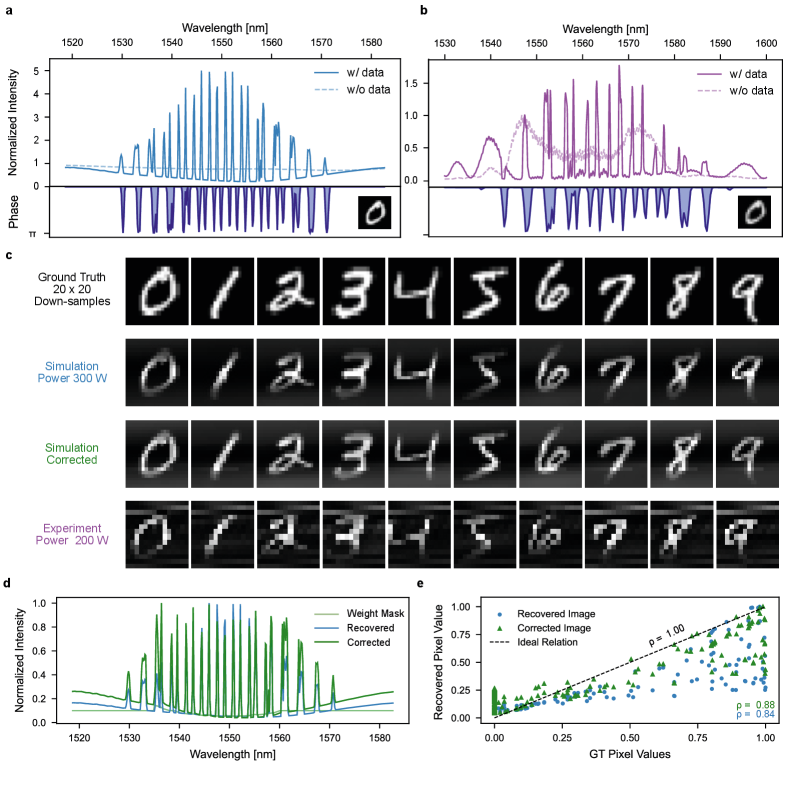
The in-fiber phase-to-intensity projection is ideally suited to recover broadband spectral phase information if stored on an optical pulse. To demonstrate the capability of nonlinear propagation to preserve distributed phase information, we illustrate its performance using MNIST grayscale images of handwritten digits (0–9) [mnist] as input samples. The original 2828 images were resized to 20×20 for simulations and 1414 for experiments (limited by the resolution of the encoder and readout), then flattened. The flattened arrays with normalized entries from 0 to 1 were multiplied by a maximum phase shift of rad (Fig. 4a,b bottom). These phase masks were applied to 200 wavelength bins centeretd at 1550 nm of the input spectra in simulation and between 1525-1600 nm in experiment, which were then propagated through the nonlinear fiber. At readout, the distributed phase bits occur as spectral intensity peaks, spectrally well aligned with the input mask (Fig. 4a,b, top).
The input phase information can be directly extracted from the measured spectra at the encoded wavelengths. The spectra are cropped to the spectral domain of the input phase mask. The cropped one-dimensional spectral intensity data are then mapped back into two-dimensional grid of the original encoding size (20x20 in simulation, and 14x14 in experiment). This “reshaping” assumes a linear correspondence between spectral bins and pixel indices. Since the number of recorded spectral samples does not exactly match the number of encoded pixels, linear interpolation is applied to resample the data onto the two-dimensional grid. These recovered images are directly compared to the ground truth for qualitative inspection (Fig. 4c).This reconstruction demonstrates that distributed spectral phase information can be retrieved directly from intensity-only measurements.
Signal distortions were observed, arising from two dominant sources: (a) dependence of output spectral intensity on the input spectral profile, leading to fading at the spectral edges (less prominent in experiment due to broader and flatter laser bandwidth), (b) experimental imperfections, such as slightly chirped input pulses, which distort the spectral baseline and c) spectral side bands and nonlinear background variations also appear due to nonlinear self-phase modulation induced by a non-ideal and non-symmetric pulse shape. Straightforward correction procedures allow to reduce those artifacts.
To correct for such linear and nonlinear aberrations we use a normalization scheme based on a shifting of a single phase bit of constant magnitude to estimate the envelope of the spectral response (see Appendix C3 for implementation). A weighting function can then be derived per pixel and applied in post-processing (or pre-processing as additional frequency-dependent encoding factor). To avoid disproportionate amplification of the baseline, we apply a flooring that enforces a minimum weighting value in the peripheral spectral region (Fig. 4d). The pixel-wise relation between input and recovered values shows slight improvement after this correction function is applied, quantifiable by Pearson correlation between inputs and readouts across the spectrum (Fig. 4e).
Alternatively, the input pulse shape itself can serve as a weight and be factored out from the output spectrum. This approach is also demonstrated in the Supplementary Information. The nonlinear background could also be mitigated via reference measurements without data imprinted on the pulse; however, in our power and pulse-width regime, this step was not necessary since background contributions were weak. Importantly, all aberrations could, in principle, also be compensated optically through ideal pulse compression and spectral flattening of the input.
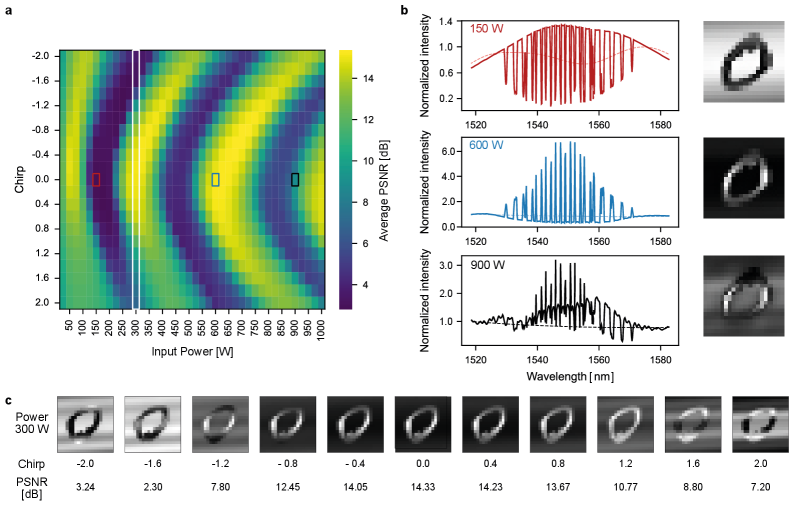
Because of the nonlinear nature of this phase mapping technique, input peak power and pulse width become an important control parameter to choose with respect to the available waveguide length [ramanPeak_discussion]. In simulation and experiment, we adjusted the pulse width through controlling the spectral chirp to maintain the spectral bandwidth and hence the information capacity of the pulses. We quantify recovery fidelity for each setting using the peak signal to noise ratio (PSNR), a measure of the quality of an image compared to its original (see Methods), averaged over ten digits for various pulse width and power combination (Fig. 5a). The PSNR serves as measure of identity between our recovered and original images. The modelled PSNR map in Fig. 5a unambiguously reveals the characteristics of the nonlinearity induced interference: distinct operational regions oscillate between optimal and sub-optimal performance over pulse power and chirp.
Representative spectra and corresponding digit recoveries for three cases are shown in Fig. 5b. Comparing different powers at zero chirp, at 600 W, the recovered image closely matches the ground truth with minimal background. At 900 W, the digit is faint and distorted by the nonlinear background. At 150 W, contrast inversion appear due to destructive inteference. These results demonstrate that phase can be recovered directly, if the system is operated at appropriate power for a given pulse width and fiber length. To further illustrate the role of input conditions, Fig. 5c shows the effect of varying input chirp at fixed power (300 W). Increasing positive or negative chirp systematically degrades recovery fidelity in this power domain. Outside the optimal operating range, contrast diminishes and distortions emerge due to nonlinear background, leading to inversion or filtering-like effects.
2.4 Single-shot Phase Recovery
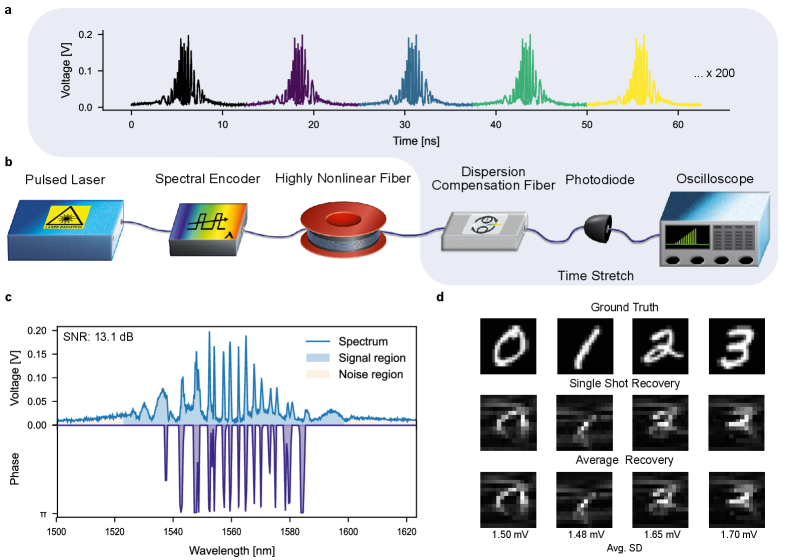
Finally, we demonstrate a proof-of-concept experiment for reference-free pulse-to-pulse phase recovery. To capture spectral phase information at pulse rates, we employ dispersive Fourier transform (DFT) [DFT], a powerful technique that converts spectral content into measurable temporal signatures. In this method, a dispersion compensation fiber (70 ps/nm/km) introduces wavelength-dependent delays that map the spectral profile of each pulse into the time domain. The time-stretched pulses are then detected with a 33 Ghz high-speed photodiode in combination with a 110 GHz real-time oscilloscope (Fig. 6b). An example of recorded time traces is shown in Fig. 6a.
We perform measurements at an 80 MHz repetition rate using 200 fs input pulses and 200 W pump power. From the recorded time traces, we successfully retrieved distributed spectral phase information and recovered MNIST images on a pulse-to-pulse basis. A single-shot recovery yields a signal-to-noise ratio (SNR) of 13 dB (Fig. 6c), establishing the viability of pulse-to-pulse phase extraction. While, averaging over 200 independent shots yields a mean pixel-wise standard deviation of 1.51 mV, 2.47× lower than the spectral background noise floor (3.7 mV). Representative recovered images are shown in Fig. 6d.
The misalignments in the DFT wavelength mapping (Fig. 6c) stem from inherent dispersion stretching. Different wavelengths experience different group delays, this means shorter wavelengths may compress into narrow time windows while longer wavelengths stretch across broader time intervals, creating an inherently nonlinear time-wavelength mapping. Another possible contribution to this is the peak-finder mapping misalignments due to quantization and localization errors (see Appendix C4) .
Our demonstration achieves repetition rate and fidelity comparable to previous works reported [80Mhz, 46Mhz]. The recovery in our setup is limited by detector sensitivity and noise, as well as the limited bit depth of the oscilloscope ADC, which defines the effective baseline of each trace. Additional losses from fiber connectors and propagation further degrade SNR. Improvements in detector bandwidth, ADC resolution, and optical coupling efficiency are therefore expected to significantly enhance performance.
This highlights the potential of our approach for extending ultrafast phase characterization beyond existing limits. Overall, these results demonstrate the feasibility of reference-free, high-rate pulse-to-pulse phase sensing, with direct implications for the real-time characterization of optical devices and ultrafast communication systems.
3 Discussion
Our theoretical framework provides the first general formulation of the effect. The interplay between self-phase modulation of the strong field, that leads to a filling of the spectral notch at , and cross-phase modulation of the weak-field can lead to constructive interference between both fields. The peak intensities of this Kerr-induced spectral interference can significantly exceed the factor of four of typical constructive interference between two equal-amplitde waves. Those levels of amplification occur, however, beyong the weakly nonlinear regime and can only be made visible using simulations based coupled mode theory or the broadband nonlinear Schrödinger equation. The model does not impose limits on the range of observation with respect to pulse width, peak power, fiber length, or fiber dispersion. Such generality indicates that the effect is not bound to a specific operating regime but is instead a fundamental outcome of the nonlinear–linear interference mechanism.
However, the signal prominence is strongly dependent on the nonlinear system configuration. Simulations help to identify operational domains and clarify where the effect becomes most distinct from the spectral background. In our study, the peaking effect remained visible even up to the domain limits of pulse chirp and peak power. Nonetheless, nonlinear spectral modulations become dominant at peak powers W (chirp-free), adding a nonlinear background and causing deterioration of the signal prominence. The response may further decline for picosecond pulses due to Stimulated Raman scattering (SRS) becomes significant for pulse widths ps. Other works report on SRS inducing a redshift of the pulse spectrum, transferring energy from the pump to longer-wavelength Stokes components, deteriorating the spectral peaking effect [ramanPeak_discussion].
On the other hand, the persistence of the technique across such broad parameter space makes it difficult to suppress this effect. This robustness may have implications for optical signal processing and information tasks where femtosecond to picosecond pulses play a pivotal role. For example, evidence from fiber-based extreme learning machines indicates that the spectral window used to encode information can preserve high information content even after significant spectral broadening via supercontinuum generation [Brunner, Saeed]. In modern telecom systems, high modulation speeds (100 GHz and above) generate pulses of 10 ps or shorter with considerable peak power. At these power levels the effect could introduce a source for intra-channel signal deterioration. Furthermore, narrow phase or amplitude changes (e.g., gas absorption lines or filter windows) may project phase information in amplitude once amplified and propagated even through weakly nonlinear media, with unforeseen consequences for signal purity in laser engineering and sensing.
4 Conclusion
In summary, our study establishes a universal theoretical framework for a nonlinear phenomenon in Kerr media and verified its validity with experiments on normal-dispersion fiber. The combined theoretical and experimental results demonstrate that the effect persists across a broad range of pulse widths, peak powers, fiber lengths, and dispersion conditions, making it attractive for low-power phase retrieval and imaging applications. We showcased this method for ultrafast phase sensing and imaging, where we showed pulse-to-pulse readout at tens of megahertz rates and picojoule pulse energies using dispersive Fourier transform. This highlights its potential for reference-free characterization of optical systems at speeds that exceed conventional interferometric techniques. Only a single calibration step is required for accurate quantization to assign an absolute phase value to the measured intensity.
Overall, the universality of the effect has implications for optics and photonics, in particular laser enigineering, high-throughput phase imaging, and optical signal processing. This work also highlights the potential of femtosecond pulses as information carriers for future communications and computing as well as sensitive probes of complex light–matter interactions.
5 Methods
Experimental setup
Experiments were conducted on a vibration-isolated optical table under stable laboratory conditions. A mode-locked fiber laser (Toptica DFC Core) with 80 MHz repetition rate, central wavelength 1556 nm, pulse duration 830 fs, and average power 13.38 mW, served as the source. The output was coupled into 1m long polarization-maintaining fiber, ensuring stable polarization.
A programmable optical WaveShaper (Coherent Waveshaper 1000A) was used to apply user-defined phase modulation. The WaveShaper device, which consists of a conventional grating and liquid crystal on silicon (LCoS), constitutes the core of the setup. The combination of LCoS with grating enables modulation of phase and/or amplitude in spectral domain, and hence is used in our setup to a) compresses the 830 fs broad pulse of the laser to a near-transform-limited (200 fs) using genetic algoritm based optimization [GA] and b) implement spectrally localized phase shifts.
The modulated light was then propagated through a normally dispersive highly nonlinear fiber (Thorlabs HN1550, length 5m, dispersion -1 ± 1 ps/nm/km). The average power was monitored with a calibrated power meter (Thorlabs PM100A). The temporal pulse width and profile was measured using an autocorrelator (APE, PulseCheck NX50). The spectra were recorded with an optical spectrum analyzer (Yokogawa AQ6375E, resolution 0.02 nm, wavelength range: 1000-2500nm).
For dispersive Fourier transform (DFT) measurements, pulses were passed through 800 m of dispersion-compensating fiber (M2 Optics, Inc.) with overall dispersion of 70 ps/nm/km. The temporally stretched pulses were detected using a high-speed photodiode (Albis PMY30A-L, bandwidth 34.4 GHz) and digitized with a real-time oscilloscope (Keysight UXR1104B, bandwidth 110 GHz, sampling rate 256 GS/s, 10-bit ADC).
Numerical Simulation of Coupled-Wave Propagation
To validate the analytical predictions of Sec. 2.1, propagation of the pump field and probe field is modelled by two coupled nonlinear Schrödinger equations retaining chromatic dispersion, SPM, and XPM:
| (7) | ||||
| (8) |
where . The pump is initialized as with fs ( fs), and the probe from the analytic result of Appendix A.2,
| (9) |
Equations (7)–(8) are integrated with a symmetric split-step Fourier method, using Runge-Kutta-4th-order integration for the nonlinear substep and the half-step operator for dispersion, over steps across m with the same and fiber dispersion coefficients as used in the broadband Schrödinger model below. The time grid comprised points over a 50 ps window. Output spectra are normalized to the peak spectral intensity of at ,
| (10) |
so that corresponds to the unperturbed linear-regime response.
Numerical nonlinear Schrödinger model
We simulated pulse propagation in a normal dispersion highly nonlinear fiber (HNLF, length 5 m) similar to the experimental fiber used for supercontinuum generation around 1550 nm. The generalized nonlinear Schrödinger equation was solved using a split-step Fourier method [agrawal] in Python (PyTorch version 2.6.0).
The simulation window spanned ps with points (temporal resolution ). Input fields were modelled as Lorentzian pulses to match experiment, with full-width at half-maximum (FWHM) of 180 fs and central wavelength 1550 nm.
The HNLF parameters were defined as follows: The dispersion coefficients were , , , , . The fiber loss was . the nonlinear coefficient and the effective mode area . The core radius was . Output spectra and temporal profiles were extracted directly from the simulated fields.
Peak signal to noise ratio
To quantify the fidelity of the reconstructed images relative to the ground-truth MNIST digits, we report the Peak Signal-to-Noise Ratio (PSNR). For two images (ground truth) and (recovered), PSNR is defined as:
| (11) |
where MSE is the mean squared error given by:
| (12) |
6 Acknowledgements
We acknowledge that this work was made possible by funding from the Carl Zeiss Foundation through the NEXUS program (project P2021-05-025). Special thanks to Nicolas Perron (INRS Montreal/Varennes) for his assistance with simulation implementation. We also acknowledge Julian Hniopek for providing the IT infrastructure needed for this project. Research funding: Carl-Zeiss Stiftung, Nexus program (P2021-05-025). Conflict of interest: The authors declare no conflict of interest regarding the publication of this paper.
References