[1]\fnmM. \surGalletti
[1]INFN-LNF, Via Enrico Fermi 54, 00044 Frascati, Rome, Italy 2]Università di Roma Tor Vergata, Department of Physics,Via della Ricerca Scientifica 1, 00133 Rome, Italy 3]Racah Institute of Physics, Hebrew University, 91904 Jerusalem, Israel
Experimental Demonstration of Beam-Driven Wakefield Acceleration in Laser-Plasma Filament
Abstract
Self-guided femtosecond laser pulses propagating in low-pressure gas can generate plasma filaments, establishing a new framework for plasma wakefield acceleration. Unlike conventional schemes relying on mechanically confined or preformed plasma channels, this method exploits the intrinsic non-linear light-matter interaction, greatly reducing the energy required to generate plasma. This, in turn, allows to realise tunable stages, potentially operating above kHz repetition rate and with meter-scale interaction lengths and transverse sizes down to a few tens of micrometres. Moreover, the laser-plasma filament reproducibility is intrinsically higher than state-of-the-art discharge-plasmas, where the breakdown process is initiated in a stochastic and uncontrolled manner. As a result, laser-based plasma formation offers improved reliability and control over plasma parameters. Here we report a proof-of-principle experimental demonstration of beam-driven wakefield acceleration of electron bunches with an accelerating field exceeding 250 MV/m in a laser-generated plasma filament. The results are cross-checked with numerical simulation, showing an excellent agreement and providing a complete picture of the physical process. Beyond particle acceleration, the concept bridges laser filamentation physics, advanced plasma photonics and compact accelerator technologies, offering a promising route towards sustainable, high-repetition-rate plasma-based facilities.
keywords:
Laser filamentation, Non-linear light–matter interaction, Plasma-based electron acceleration, Compact accelerator technologiesThe propagation of ultrashort, high-intensity laser pulses in gases is governed by a dynamic balance between self-focusing and defocusing due to low-density plasma generated via multi-photon or tunnel ionisation [1, 2]. This balance leads to intensity clamping [3, 4] and to the formation of extended plasma channels [5, 6], commonly referred to as filaments. Under suitable conditions, filaments can extend over tens of meters [7, 8] and have been observed over distances approaching two kilometres in atmospheric propagation [9].
Amongst numerous applications [10, 11, 12], the adoption of laser-plasma filaments as stages for plasma wakefield acceleration (PWFA) [13] represents a new potential direction. When a charged particle bunch (the ) travels in plasma, the plasma electrons move to shield the electromagnetic fields of the bunch [14], resulting in a plasma electron density oscillation behind the bunch. The plasma density wake sustains longitudinal and transverse wakefields [15], that can be used to accelerate a trailing bunch (the ) to high energies over short distances [16, 17], with quality suitable for applications such as radiation generation [18, 19, 20].
Conventionally, plasmas for PWFA are generated by ionising gas through either high-current discharge [21], field-ionisation induced by relativistic charged particle bunches [22], or multiphoton-tunnel ionisation [23]. However, the large amount of power required by these methods limits the repetition rates. In the case of discharge or field ionisation, the parameters of plasma depend directly on the high-voltage discharge system or beam parameters, which may jitter substantially from event to event. The methods mentioned above relying on laser-induced ionisation, and further ones [24, 25] adopted in laser-driven wakefield acceleration [26], do not involve self-focusing, thus filamentation does not play a role in the generation of plasma.
In the case of plasma filaments, the laser self-focusing allows for depositing much less power into the system, decreasing the heat load. This, in turn, allows to increase in the achievable repetition rate. Moreover, the geometric properties of the filament can be adjusted by tuning the parameters of the laser pulse and the gas pressure [27].
In this paper, we report a proof-of-principle experimental demonstration of the use of laser-plasma filaments for PWFA, leading to consistent ( successful acceleration events) and high-gradient (MeV/m) acceleration. The plasma evolution is characterised by analysing the recombination light, showing an excellent agreement with numerical simulations.
Filamentation Physics
Filamentation of high-power femtosecond laser pulses involves several non-linear effects such as diffraction, self-focusing, group-velocity dispersion, as well as plasma generation and energy losses due to multi-photon and tunnel ionisation [28, 29]. To investigate the phenomenon, we adopt a theoretical model based on the non-linear wave equation using the slowly varying envelope approximation [28, 30, 31, 32, 33] describing the electric field A A(x, y, z, t) as [27]:
| (1) |
where is the intensity of the laser pulse, and the laser frequency and wave number. On the right-hand side, the first term accounts for diffraction within the transverse planes; the second term for the group velocity dispersion (GVD) of an ultra-short laser pulse, where (in units of fs2/cm) is the GVD coefficient; the third for the Kerr effect [34, 35, 28, 30, 31, 32] with the instantaneous and delayed components in parentheses, where ( the characteristic time for electron-neutral inverse Bremsstrahlung), is the linear index of refraction, f the coefficient due to stimulated molecular Raman scattering [28, 36], R(t) the exponential function with a characteristic time of about 70 fs, and n2 the non-linear index of refraction; the fourth term for plasma absorption and defocusing where is the cross-section for the inverse Bremsstrahlung process following the Drude model [37], and (x, y, z, t) the electron density of the plasma generated by ionisation; finally, the last term accounts for energy absorption due to ionisation where is the multi-photon ionisation rate parameter [32, 38], and K the number of photons needed to ionize each atom or molecule once.

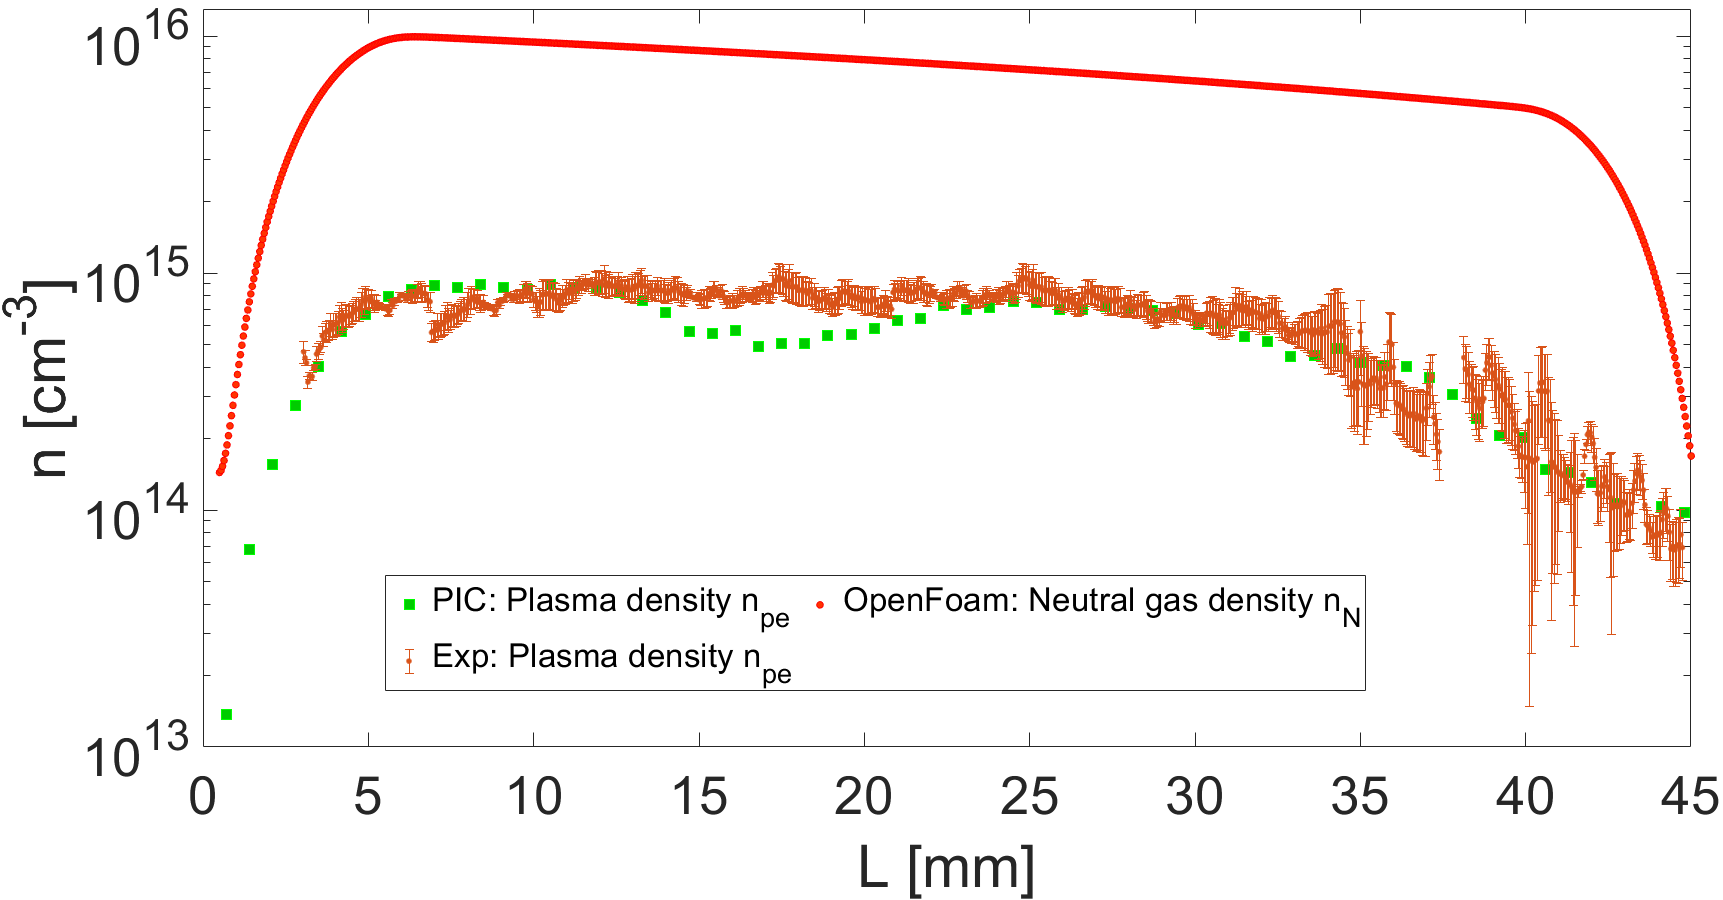
The solid blue line in Fig. 1 shows the transverse envelope of a laser pulse with central wavelength nm, root mean square (rms) transverse size at waist µm in vacuum (Rayleigh length mm) and Full Width Half Maximum (FWHM) duration fs, interacting with neutral nitrogen gas with density cm-3, obtained solving Eq. 1. We consider a longitudinal density profile with a plateau from 5 to 35 mm and smooth ramps at the entrance and exit (similar to the experimental setup, see Methods). Calculations show that, because of the occurrence of filamentation, the pulse is self-guided for mm, corresponding to , with an average transverse size µm. The dashed blue line shows the corresponding envelope of the pulse when propagating in vacuum. When filamentation occurs, the focal plane is shifted upstream, and the waist is larger than when propagating in vacuum.
We compare the theoretical results with Particle-In-Cell (PIC) numerical simulation results obtained with FBPIC [39]. The transverse size of the laser pulse, calculated from the laser electromagnetic fields (blue circles in Fig. 1), is in good agreement with the theoretical one. We also extract the width of the plasma channel (purple squares in Fig. 1), calculating the rms of the transverse distribution of the plasma electron density of the filament after the pulse has passed. The width of the filament is µm on average, and it oscillates between 60 µm and 85 µm, with a behaviour similar to that of the laser pulse envelope. The on-axis plasma electron density obtained from the PIC simulations (, green squares in Fig. 1) reaches an average value of cm-3, along the 3-cm long plateau corresponding to that of the neutral gas density distribution.
Experimental setup
The experiment took place at the SPARC_LAB facility at INFN-Frascati National Laboratory [40] (see Fig. 2). The SPARC_LAB bunker hosts a Ti:Sapphire chirped pulse amplification [41] laser system, which delivers 80 mJ laser pulses at 800 nm central wavelength, with a transform-limited duration of 30 fs at FWHM, and a repetition rate of 10 Hz. The output of the laser system [19, 42] is split into two beamlines.

In the first one (linac beamline), the pulse is frequency-doubled to generate electron () bunches illuminating a copper cathode within a radiofrequency (RF) gun. Multiple bunches in the same RF bucket can be generated by splitting and delaying the main pulse in replicas with adjustable delay and relative intensity [42, 43]. The bunches are then accelerated (MeV) and longitudinally compressed (sub-picosecond) via velocity-bunching [44, 45] in the RF linac, and transversally focused with a triplet of permanent magnet quadrupoles (PMQ) at the entrance of a 2-mm-diameter, 3-cm-long, single-inlet dielectric capillary.
The second beamline (filament beamline) delivers pulses with mJ, 350 fs (FWHM) and transverse size mm at intensity at a 1-m-focal-length lens, focusing the pulse at the entrance of the capillary, after being reflected by a holed mirror through which the electron bunches propagate. The laser pulse reaches the capillary entrance approximately 100 ps before the arrival of the electron bunches.
The capillary, shown in Fig. 2 (a), is filled with nitrogen gas through a solenoid valve ms before the arrival of the laser pulse, and plasma is generated by filamentation. The inset of Fig. 2 (b) shows the plasma filament obtained by imaging the recombination light of the plasma onto a multi-channel plate coupled to a CCD camera (side imaging technique). From these snapshots, we calculate the length of about 45 mm (Full Width Tenth Maximum, FWTM) and rms transverse size around 70 µm. The black regions along the filament are due to the metallic electrodes installed on the capillary for the ionisation with the high-current discharge.
We obtain the longitudinal profile of the plasma by projecting the pixel counts along the vertical axis. The trend of the resulting intensity profile (orange dots in Fig. 1, normalised over the peak value of ) is in good agreement with the longitudinal plasma density profile obtained by numerical simulations. In a previous publication [27] with a dedicated setup, we also directly measured the plasma density and the characteristic decay time with the Stark-broadening technique [46]. Since the intensity of the light is correlated with the plasma density, we estimate a density jitter of in the plateau region (5-35 mm, shown in Fig. 1).
We measure the position and transverse distribution of the electron bunches and of the attenuated laser pulse at the capillary entrance using an aluminated silicon screen. The screen is installed below the entrance of the capillary, and it is inserted in the beam path by moving the capillary vertically with a step motor. The optical transition radiation (OTR) emitted by the electrons or the reflected laser pulse is imaged onto the chip of a digital camera.
We characterise the electron bunches’ energy and longitudinal distribution using a magnetic spectrometer composed of a triplet of electromagnetic quadrupoles, a transverse deflection structure [47] (introducing a head-to-tail vertical correlation to the bunch), a magnetic dipole (dispersing the beam in the horizontal plane) and a scintillating screen.
The rms duration of the driver and witness bunches (obtained by calculating the rms of the longitudinal bunch distribution on the screen with TDS turned on) is ps, respectively. The temporal distance between the two bunches is ps. We calculate the bunch density , where is the charge per bunch and is the rms transverse size at the plasma entrance (measured with the OTR screen). The bunches have pC, and µm, thus cm-3. Hence, we expect the driver bunch to generate wakefields in the blowout regime (cm-3) and the witness bunch to be placed in the accelerating and focusing phase of the wakefields. The normalised emittance of the bunches is µm (measured with a quadrupole scan technique).
1 Results

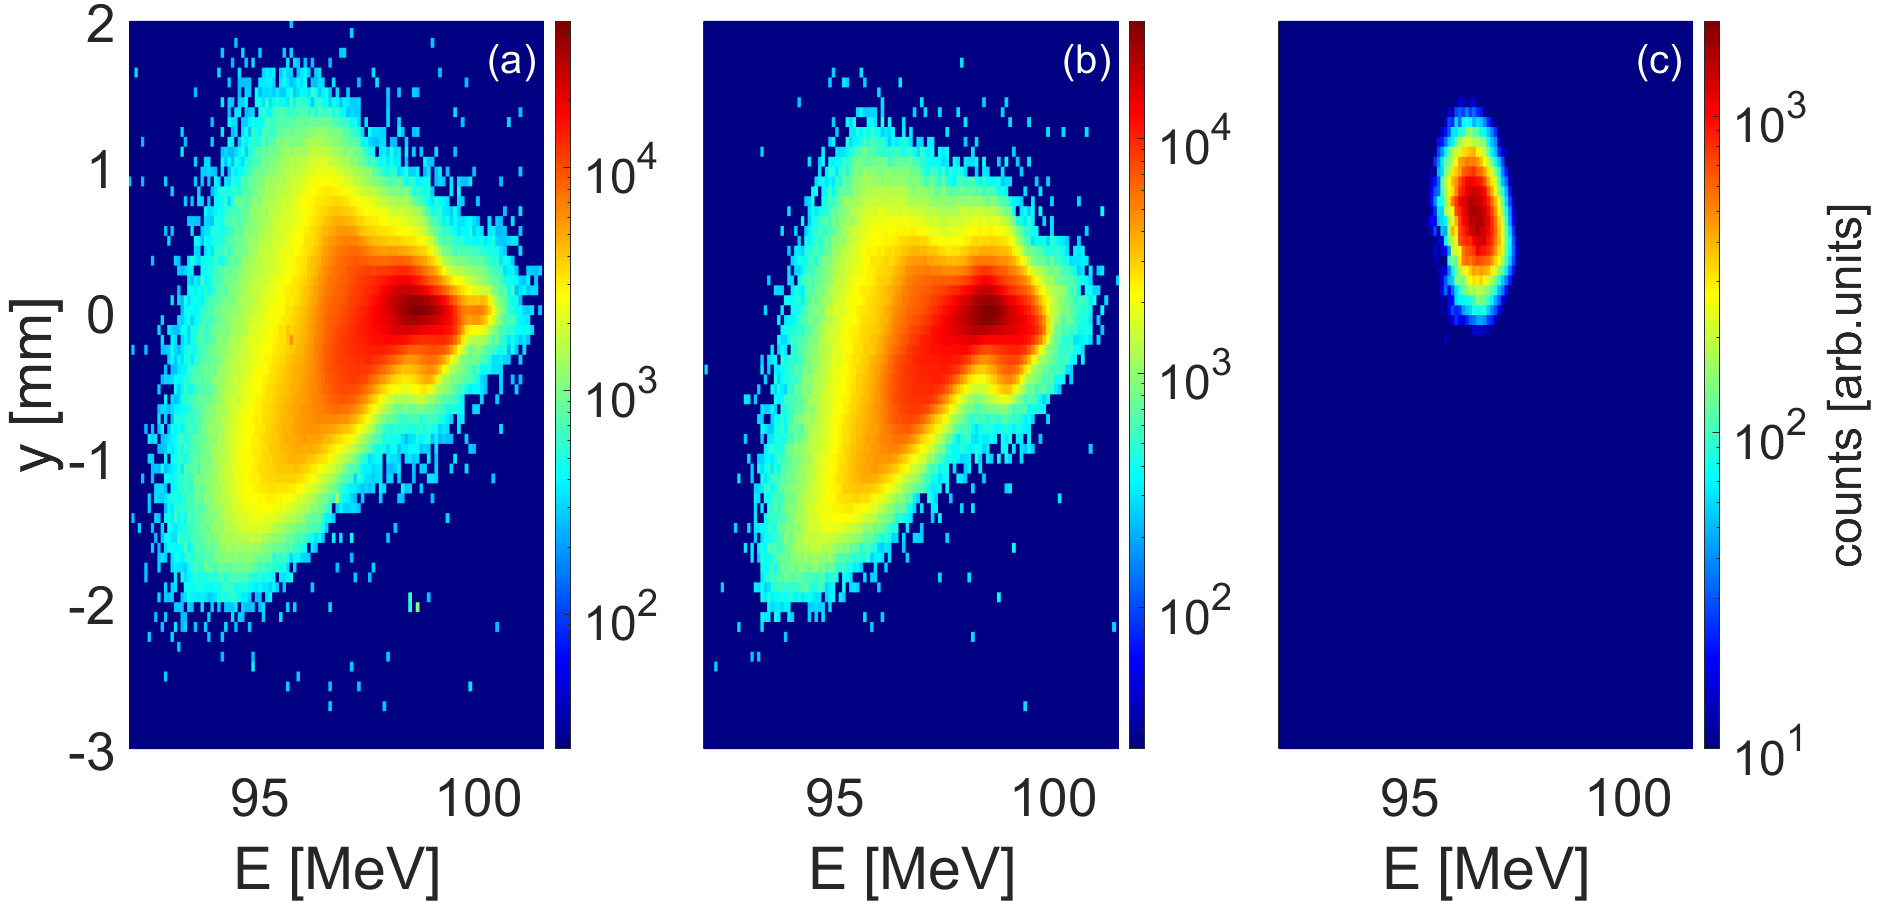
Figure 3 shows the energy spectra of driver and witness bunches averaged over 100 consecutive events after propagation through the gas-filled capillary without (a) and with (b) the ionising laser pulse. The red and green projections on the energy axis show the energy distribution of the driver and witness bunch, respectively. By comparing the spectra, we retrieve a maximum deceleration of the driver MeV 111We define the minimum and maximum energy of each bunch as the values where the amplitude of the energy distribution reaches of its own maximum on the low and high-energy sides, while the mean energy is the centroid of the spectral distribution. and an average acceleration of the witness MeV, reaching a final energy MeV, when the laser pulse is present. This is due to the fact that the laser pulse interacts with the gas, generating the plasma filament within which the electron bunch drives the wakefields. Considering a 3-cm long plasma, the average accelerating gradient is MeV/m. We note that the charge and the relative energy spread of the witness bunch are preserved upon acceleration.

The robustness and reproducibility of the plasma filament generation and of the acceleration process are clearly evidenced by Fig. 4 (a), where we show the energy distribution of 100 consecutive events. The witness bunch is accelerated in of the events, and the rms energy jitter is .
An additional demonstration of reliable and repeatable operation of the proposed setup is directly given by a direct comparison with the discharge-based plasma source, which is an established setup for PWFA [18, 19, 20]. Figure 4 (b) shows that the witness bunch is accelerated in a discharge-based plasma (without additional stabilisation methods [48, 49]) in only of the events, with rms energy jitter of , meaning a threefold increase with respect to the filament configuration, with a comparable energy gain. This is due to the fact that in the discharge configuration, the ionisation process is initiated in a stochastic manner, affecting the plasma density and therefore the acceleration process.
We calculate the average energy of the witness bunch of each successful acceleration event. The corresponding histograms in Fig. 5 clearly show that the energy variation in the filament case (orange area) is much smaller than in the discharge case (blue area). This is due to the higher reproducibility and inherent synchronisation of the system with the RF linac.

2 Discussion
In the present work, we conducted a proof-of-principle experiment to demonstrate the use of laser filamentation for the generation of plasma stages suitable for PWFA. To obtain further insights into the plasma properties, we compare the experimental results with numerical PIC simulations. The plasma is initialised with a transverse Gaussian distribution with rms µm and on-axis cm-3. Figure 6 shows the longitudinal (solid blue line) and transverse (dashed blue line) wakefields driven by an bunch with the same parameters as those experimentally measured (driver and witness charge density distributions shown by the red and green lines, respectively, centred at , travelling from left to right). The plasma density distribution and the properties of the wakefields behind the driver bunch () are those typical of the blowout regime, as expected by .
The amplitude of the decelerating wakefields within the driver bunch reaches MV/m, while that of the accelerating wakefields within the witness bunch (ps) reaches MV/m. Considering a 3-cm long plasma, the amplitude of the longitudinal wakefields is in agreement with the energy loss and gain experimentally measured. Hence, we conclude that the interaction of the laser pulse with the gas generates plasma with a longitudinal profile consistent with the one shown in Fig. 1 and transverse Gaussian profile with µm.

We have experimentally demonstrated the generation of an operational PWFA stage satisfying several essential requirements, such as the control of the parameters of plasma, and the reliable and reproducible performance. The filamentation process requires significantly less power than with other plasma generation methods, for a given plasma length and density. In the configuration described here, a commercial GW-class laser was employed, whereas alternative approaches [23, 22, 50, 21] would require either a TW-class laser, GeV-class relativistic electron beams, or an external high-voltage pulser circuit. In fact, in the laser-filament method, the power requirement is due to the partial multi-photon ionisation of the gas; while, in all other methods, more power is required to trigger the thermal heating of the majority of atoms, which in turn produces a sufficient plasma electron density.
The filamentation-based configuration results in negligible deposition even at high repetition rates, owing to the relatively low laser energy and the transverse size of the plasma column. In the experiment presented here, we measured an energy loss of mJ by the laser pulse. For a 3-cm-long and 2-mm-wide capillary, this value (assuming conservatively that all the energy is deposited on the wall) corresponds to a thermal load of less than 1 mJ/cm2, which is roughly two orders of magnitude below the damage threshold. Furthermore, in this setup, the capillary serves solely as a gas containment cell, so its diameter could be increased. The only constraint is the beamline pumping system; with an upgrade, the wall load could be reduced even further. The achievable repetition rate is therefore determined by the laser system. Current state-of-the-art lasers with modest pulse energies at the mJ level can operate at repetition rates in the tens of kHz range.
The repetition rate in discharge-based configurations is instead strongly limited by the performance of the high-voltage pulser circuit. Stable operation can be sustained routinely at Hz for several hours, while operation at kHz would require a complex cooling system. Additionally, discharge-based configurations exhibit substantially higher energy deposition. In a separate experiment, we measured an energy deposition of approximately 100 mJ per discharge in a 3-cm-long capillary, increasing to about 2 J per discharge in a 60-cm-long capillary (as envisioned for the EuPRAXIASPARC_LAB project [51, 52]). Such levels of deposited energy lead to damage to the internal structure of the plasma stage unless materials capable of withstanding high thermal load and exhibiting high mechanical strength, but demanding to handle, are employed, thereby enabling operating safely at high repetition rate as in Ref. [53]. Once the capillary channel is degraded through operation, the resulting plasma profile is altered, leading to a non-optimised acceleration process.
Another advantage of the proposed scheme is that the plasma generated through filamentation is self-synchronised with the electron beam, since the same laser system is used to generate the beam from the photo-cathode. On the contrary, high-voltage plasma-discharges rely on an external pulser unit, which must be precisely synchronised with an appropriate timing system [49]. As a result, laser-based plasma formation offers improved reproducibility and control over plasma parameters, resulting in a threefold reduction of the energy jitter and in an improved success rate (see Fig. 4 and Fig. 5).
Moreover, the plasma filament dimensions and density required for an optimal PWFA stage are determined solely by the laser and gas parameters, namely the proper matching of laser energy, pulse duration, waist, and gas type and density, as derived from Eq. 1. We note that a longer plasma could be generated with the same laser pulse as in this experiment, using a longer capillary, whose length is limited in our facility by the geometric dimensions of the interaction chamber.
Finally, this technique enables the generation of plasma channels with adjustable transverse dimensions. For example, it is possible to obtain plasma channels much narrower than the driver bunch, enabling ion-channel applications [54], since all plasma electrons would be expelled from the plasma and are not able to restore their initial condition, as envisioned for future plasma-based undulators. Finite-width plasma stages may also be suitable for positron acceleration, thanks to the extended accelerating and (transversely linear) focusing region for positively charged particles [55] (see Fig. 6, ps ps), which are required for next-generation plasma-based lepton collider [56].
In conclusion, we conducted a proof-of-principle experiment, supported by numerical simulations and theoretical results, demonstrating that laser filamentation of ultrashort pulses can generate plasma channels suitable for PWFA. This approach offers significant advantages, enabling future operation of high-gradient plasma stages at high repetition rate while maintaining minimal energy deposition on the gas-cell walls. This is therefore aligned with the requirements defined in the EuPRAXIA scientific case [52], which foresees the use of a high-repetition-rate, 60-cm-long plasma with a density in the cm-3 range, capable of sustaining GV/m accelerating fields while preserving the high brilliance of externally injected beams.
3 Methods
3.1 Laser system
The SPARC_LAB photocatode laser system is based on a commercial Ti:Sapphire chirped pulse amplified laser (ARCO [57]) delivering mJ, 30 fs transform-limited duration, nm central wavelength (IR) pulses at 10 Hz repetition rate.
The main high-energy 10 Hz laser beamline generates pulses with linear polarization, beam quality factor , picosecond contrast of for ps - for ps - for ps, and pointing stability of about µrad.
The main beamline is split into two auxiliary beamlines: one beamline is used to generate the electron bunches, namely the driver and the witness bunches; while the second one is used to generate the plasma filament for the PWFA stage.
3.2 Generation of electron bunch train
In the linac beamline, the pulse frequency is doubled (VIS) with -BBO non-linear crystals and shaped in energy, transverse and longitudinal dimensions. The harmonic conversion delivers up to mJ, with a nominal rms stability of about .
The split and delay system is composed by custom made polarizing beam splitters (PBS) that reflect vertical polarisation and transmit horizontal polarisation. Motorised zero-order half-wave plates rotate the polarisation of the incoming pulse to control the intensity of each VIS replica. Translation stages in each line allow for control of the delay between the pulses. Two motorised irises, positioned at the same distance from the first PBS, control the transverse dimensions of the two pulses.
The VIS pulse train is transported to the copper photocathode, where imaging of the irises is performed to obtain the top-hat transverse profile needed to optimise the photoelectron generation. About of the pulse is reflected by the cathode, and it is imaged on a camera used for transverse alignment and measurement of the pulse size, and as a monitor for copper surface deterioration.
The electron bunches are accelerated to MeV, as shown in Fig. 7, adopting three RF travelling-wave structures: two S-band (2.85 GHz), where the first one is working in the velocity-bunching configuration [44, 45] for bunch compression, and one C-band (5.71 GHz). The total charge is measured with an integrating current transformer at the exit of the RF gun and downstream of the plasma. The emittance of each bunch is measured with the quadrupole scan technique at the end of the linac.
3.3 Laser-filament plasma source
The capillary shown in Fig. 2 (a) was specifically designed for this experimental campaign to optimise gas injection and longitudinal neutral density distribution (shown in Fig. 8) and, in turn, ensure optimised matching with the laser pulse.
The capillary (and the PMQ, electron focusing system) is installed in a vacuum chamber connected to the linac with a windowless, three-stage differential pumping system. The IR laser pulse is transported through the second beamline to the vacuum-chamber window, which is positioned at 90∘ with respect to the longitudinal axis. Upstream of the window, a 2” 1-m focal-length lens mounted on a motorised translation stage is used to accurately position the focal plane at the capillary entrance. The laser pulse is then re-injected on axis, corresponding to the capillary longitudinal axis, using a 45∘ holed mirror, which reflects approximately 90% of the laser energy while allowing 100% of the electron-bunch distribution to pass through the central aperture.
The experiment is conducted using a 3-cm-long, 2-mm-diameter single-inlet dielectric capillary. Nitrogen gas is injected through the inlet connected to a solenoid valve located 5 cm from the capillary that remains open for 3 ms.
We measure the time of arrival of the electron bunches with respect to the peak of the IR laser pulse with the analog signal generated by a beam position monitor upstream of the vacuum chamber with a GHz scope. The timing jitter between the bunch and the IR laser is negligible, being generated by the same main laser system. As a result, the plasma density at the electron bunches’ arrival time is constant from event to event. By varying the delay between the laser pulse and the electron bunches’ arrival time, we vary , due to recombination of the plasma.
The plasma density is retrieved with the side imaging technique calibrated with the Stark-broadening-based diagnostics. The latter consists of measuring the spectral width of the and Balmer lines using a mixture of 95% nitrogen and 5% hydrogen gas, with an imaging spectrometer coupled to an intensified digital camera, as in Ref. [27]. The plasma electron density is essentially constant along the capillary, but non-uniformities are present at the two extremes as the gas flow expands in the vacuum chamber, as shown in Fig. 2.
3.4 Side imaging diagnostics
Using a CCD coupled with a Hamamatsu C9547-01 intensifier (ICCD), we image the light emitted by the plasma channel from the side [6]. The ICCD camera is positioned perpendicularly to the pulse propagation axis, and the plasma emitted light signal is collected and imaged onto the ICCD detector by using a Sigma 180 mm MACRO f 2.8 EX-DG-OS-HSM objective.
A band-pass filter coupled with a 0∘ incident 800 nm dielectric mirror is placed in front of the camera to detect the light emission from the filament while rejecting the scattered light from the IR laser and all other emissions.
The section of the plasma column covered by the field of view of the ICCD is about 53 cm2. The ICCD gate duration is set to 5 ns with an available scanning delay with respect to the laser pulse arrival time.
Adopting the side-imaging technique, we directly measure the transverse size and length of the plasma column, as shown in Fig. 1. Moreover, the plasma-emitted light is directly related, through the Einstein coefficient, to the number of ions in the excited state, which, up to a calibration factor, provides a measure of the plasma density [6, 58]. To determine the plasma density quantitatively, the emitted light intensity is calibrated using the Stark broadening technique.
3.5 PWFA in a discharge-generated plasma stage
To benchmark the filament-based plasma stage, we performed a dedicated experimental campaign using a discharge-based plasma source (adopting the same capillary), operating in a driver–witness configuration with beam parameters matched to those adopted for the filament case. This ensured a consistent comparison between the two plasma generation schemes under otherwise equivalent conditions.

Figure 9 reports the energy distributions of the driver and witness bunches measured over 100 consecutive shots after propagation through the gas-filled capillary, both in the absence (a) and in the presence (b) of a high-current discharge (7 kV, 233 A) with similar beam parameters as in Fig. 4 of the main text. For the driver bunch, a maximum energy loss of MeV is observed1. The witness bunch, initially at an energy of approximately 97 MeV as shown in Fig. 9 (a), reaches a final energy of MeV after propagation through the discharge plasma, as shown in Fig. 9 (b), corresponding to an average energy gain of MeV. Assuming uniform acceleration over the 3-cm-long plasma channel, the inferred maximum accelerating and decelerating gradients are MeV/m and MeV/m, respectively. In this configuration, despite charge preservation, the accelerated witness bunch exhibits a relative energy spread of approximately , nearly an order of magnitude larger than that obtained with the filament-based configuration, indicating a significant degradation of energy spread during acceleration.
3.6 Particle-In-Cell simulations
Numerical simulations were performed with the Particle-In-Cell code FBPIC [39]222For the code documentation, see https://fbpic.github.io/index.html, a quasi-3D PIC code, which uses cylindrical symmetry to save computational time and azimuthal Fourier decomposition to add 3D features to plasma and laser evolution.
3.6.1 Laser evolution and filament generation simulations
Two azimuthal modes were set in the performed laser-evolution and filament-generation simulations. The Gaussian laser is initialised with the same parameters as those experimentally measured, meaning with its peak intensity placed at µm and its evolution is computed using the OpenPMD333For documentation see https://openpmd-viewer.readthedocs.io/en/latest/. library. The simulation box is composed of grid cells (in a plane) moving with the speed of light velocity, with space resolution µm, µm and time step resolution fs. The laser interacts with a 3-cm long column of neutral nitrogen gas of cm-3 (adopting the experimentally retrieved distribution, as shown in Fig. 2), described by particles-per-cell. Ionisation is modelled using the Ammosov-Delone-Krainov (ADK) theory [59]. We calculate the value of the plasma electron density µm behind the laser peak intensity (µm).
3.6.2 PWFA stage simulations
One azimuthal mode was set in the performed PWFA stage simulations. The two particle bunches are initialised in a 6D phase space with the same parameters as those experimentally measured. Each bunch is composed of constant-weighted macro-particles. The simulation box is composed of grid cells (in a plane) moving with the speed of light velocity, with space resolution µm, µm and time step resolution fs. The plasma is initialised in the box at longitudinal position mm (before that the bunches propagate in vacuum) until the end of the simulations (mm). The plasma transverse distribution is Gaussian with a µm and an on-axis peak density of cm-3.
Acknowledgements We thank I. Balossino, M. Bellaveglia, F. Cardelli, C. Di Giulio, L. Piersanti, A. Vannozzi, A. Michelotti, F. Anelli, M. Ceccarelli, G. Grilli, M. Martini, G. Luminati, and L.A. Rossi for the technical support; M. Del Giorno for the maintenance and operation of the laser system; V. Lollo and M. Zottola for the experimental chamber installation; D. Pellegrini, G. Grilli, and T. De Nardis for the HV discharge pulser design, and all the machine operators involved in the experimental run. Technical support of the Department of Physics of Tor Vergata University of Rome, in particular F. Bonaccorso for computational resources utilisation support, is gratefully acknowledged.
Funding This work has received funding from the European Union’s Horizon Europe research and innovation programme under Grant Agreement No. 101079773 (EuPRAXIA Preparatory Phase).
Conflict of interest The authors declare no conflict of interest.
Data availability Additional inquiries about the codes should be directed to M.G. (mario.galletti@lnf.infn.it).
Code availability Additional inquiries about the codes should be directed to M.G. (mario.galletti@lnf.infn.it).
Author contribution M.G., R.P. and A.Z. conceived the experiment. M.G., R.P., L.V. and G.D.P planned and managed the experiment with inputs from all the co-authors. M.G., L.V., F.S. and F.V. managed the photo-cathode laser system and filament beamline. L.C., R.D. and A.B. designed and characterised the capillary system. M.G., M.C., R.D., A.B., F.S., L.V. and R.P. carried out the experimental campaign. M.G. and M.C. performed the data analysis. M.G., L.V. and G.P. provided numerical simulations. A.Z. and M.F. supervised the project. The manuscript was written by M.G. and L.V. with assistance from R.P. and A.Z., and inputs from all the co-authors. All authors extensively discussed the results and reviewed the manuscript.
References
- \bibcommenthead
- [1] Aközbek, N., Bowden, C. & Chin, S. Propagation dynamics of ultra-short high-power laser pulses in air: supercontinuum generation and transverse ring formation. journal of modern optics 49, 475–486 (2002).
- [2] Chin, S. et al. The propagation of powerful femtosecond laser pulses in opticalmedia: physics, applications, and new challenges. Canadian journal of physics 83, 863–905 (2005).
- [3] Becker, A. et al. Intensity clamping and re-focusing of intense femtosecond laser pulses in nitrogen molecular gas. Applied physics B 73, 287–290 (2001).
- [4] Liu, W. et al. Intensity clamping of a femtosecond laser pulse in condensed matter. Optics Communications 202, 189–197 (2002).
- [5] Gravel, J.-F., Luo, Q., Boudreau, D., Tang, X. & Chin, S. Sensing of halocarbons using femtosecond laser-induced fluorescence. Analytical chemistry 76, 4799–4805 (2004).
- [6] Talebpour, A., Abdel-Fattah, M. & Chin, S. Focusing limits of intense ultrafast laser pulses in a high pressure gas: road to new spectroscopic source. Optics communications 183, 479–484 (2000).
- [7] Méchain, G. et al. Range of plasma filaments created in air by a multi-terawatt femtosecond laser. Optics Communications 247, 171–180 (2005).
- [8] Papeer, J. et al. Towards remote lightning manipulation by meters-long plasma channels generated by ultra-short-pulse high-intensity lasers. Scientific Reports 9, 407 (2019).
- [9] Rodriguez, M. et al. Kilometer-range nonlinear propagation of femtosecond laser pulses. Physical Review E 69, 036607 (2004).
- [10] Xu, H., Liu, W. & Chin, S. Remote time-resolved filament-induced breakdown spectroscopy of biological materials. Optics Letters 31, 1540–1542 (2006).
- [11] Kasparian, J. et al. White-light filaments for atmospheric analysis. Science 301, 61–64 (2003).
- [12] Bergé, L., Skupin, S., Köhler, C., Babushkin, I. & Herrmann, J. 3d numerical simulations of thz generation by two-color laser filaments. Phys. Rev. Lett. 110, 073901 (2013). URL https://link.aps.org/doi/10.1103/PhysRevLett.110.073901.
- [13] Tajima, T. & Dawson, J. M. Laser electron accelerator. Physical Review Letters 43, 267–270 (1979). URL https://link.aps.org/doi/10.1103/PhysRevLett.43.267.
- [14] Verra, L. et al. Experimental observation of space-charge field screening of a relativistic particle bunch in plasma. Phys. Rev. Lett. 133, 035001 (2024). URL https://link.aps.org/doi/10.1103/PhysRevLett.133.035001.
- [15] Chen, P., Dawson, J. M., Huff, R. W. & Katsouleas, T. Acceleration of electrons by the interaction of a bunched electron beam with a plasma. Physical Review Letters 54, 693–696 (1985). URL https://link.aps.org/doi/10.1103/PhysRevLett.54.693.
- [16] Kallos, E. et al. High-gradient plasma-wakefield acceleration with two subpicosecond electron bunches. Physical Review Letters 100, 074802 (2008).
- [17] Litos, M. et al. High-efficiency acceleration of an electron beam in a plasma wakefield accelerator. Nature 515, 92–95 (2014).
- [18] Pompili, R. et al. Free-electron lasing with compact beam-driven plasma wakefield accelerator. Nature 605, 659–662 (2022). URL https://doi.org/10.1038/s41586-022-04589-1.
- [19] Galletti, M. et al. Stable operation of a free-electron laser driven by a plasma accelerator. Physical Review Letters 129, 234801 (2022). URL https://link.aps.org/doi/10.1103/PhysRevLett.129.234801.
- [20] Galletti, M. et al. Prospects for free-electron lasers powered by plasma-wakefield-accelerated beams. Nature Photonics 18, 780–791 (2024). URL https://doi.org/10.1038/s41566-024-01474-3.
- [21] Leemans, W. P. et al. Gev electron beams from a centimetre-scale accelerator. Nature Physics 2, 696–699 (2006). URL https://doi.org/10.1038/nphys418.
- [22] O’Connell, C. L. et al. Plasma production via field ionization. Phys. Rev. ST Accel. Beams 9, 101301 (2006). URL https://link.aps.org/doi/10.1103/PhysRevSTAB.9.101301.
- [23] Demeter, G. et al. Long-range propagation of ultrafast ionizing laser pulses in a resonant nonlinear medium. Phys. Rev. A 104, 033506 (2021). URL https://link.aps.org/doi/10.1103/PhysRevA.104.033506.
- [24] Miao, B. et al. Multi-gev electron bunches from an all-optical laser wakefield accelerator. Phys. Rev. X 12, 031038 (2022). URL https://link.aps.org/doi/10.1103/PhysRevX.12.031038.
- [25] Oubrerie, K. et al. Controlled acceleration of gev electron beams in an all-optical plasma waveguide. Light: Science & Applications 11, 180 (2022).
- [26] Esarey, E., Schroeder, C. B. & Leemans, W. P. Physics of laser-driven plasma-based electron accelerators. Reviews of Modern Physics 81, 1229–1285 (2009).
- [27] Galletti, M. et al. Femtosecond laser-induced plasma filaments for beam-driven plasma wakefield acceleration. Phys. Rev. E 111, 025202 (2025). URL https://link.aps.org/doi/10.1103/PhysRevE.111.025202.
- [28] Couairon, A. Light bullets from femtosecond filamentation. The European Physical Journal D-Atomic, Molecular, Optical and Plasma Physics 27, 159–167 (2003).
- [29] Aleksandrov, N. et al. Decay of femtosecond laser-induced plasma filaments in air, nitrogen, and argon for atmospheric and subatmospheric pressures. Physical Review E 94, 013204 (2016).
- [30] Couairon, A. Filamentation length of powerful laser pulses. Applied Physics B 76, 789–792 (2003).
- [31] Mlejnek, M., Wright, E. & Moloney, J. Dynamic spatial replenishment of femtosecond pulses propagating in air. Optics letters 23, 382–384 (1998).
- [32] Kandidov, V., Kosareva, O., Golubtsov, I. & et al. Self-transformation of a powerful femtosecond laser pulse into a white-light laser pulse in bulk optical media (or supercontinuum generation). Appl. Phys. B 77, 149–165 (2003).
- [33] Akozbek, N., Scalora, M., Bowden, C. & Chin, S. White-light continuum generation and filamentation during the propagation of ultra-short laser pulses in air. Optics Communications 191, 353–362 (2001).
- [34] Sprangle, P., Penano, J. & Hafizi, B. Propagation of intense short laser pulses in the atmosphere. Physical Review E 66, 046418 (2002).
- [35] Sprangle, P., Penano, J., Hafizi, B. & Kapetanakos, C. Ultrashort laser pulses and electromagnetic pulse generation in air and on dielectric surfaces. Physical Review E 69, 066415 (2004).
- [36] Théberge, F., Liu, W., Simard, P. T., Becker, A. & Chin, S. L. Plasma density inside a femtosecond laser filament in air: Strong dependence on external focusing. Physical Review E 74, 036406 (2006).
- [37] Yablonovitch, E. & Bloembergen, N. Avalanche ionization and the limiting diameter of filaments induced by light pulses in transparent media. Phys. Rev. Lett. 29, 907–910 (1972). URL https://link.aps.org/doi/10.1103/PhysRevLett.29.907.
- [38] Talebpour, A., Yang, J. & Chin, S. Semi-empirical model for the rate of tunnel ionization of n2 and o2 molecule in an intense ti:sapphire laser pulse. Optics Communications 163, 29–32 (1999).
- [39] Lehe, R., Kirchen, M., Andriyash, I. A., Godfrey, B. B. & Vay, J. A spectral, quasi-cylindrical and dispersion-free particle-in-cell algorithm. Computer Physics Communications 203, 66–82 (2016). URL https://www.sciencedirect.com/science/article/pii/S0010465516300224.
- [40] Ferrario, M. et al. SPARC_LAB present and future. Nuclear Instruments and Methods in Physics Research Section B: Beam Interactions with Materials and Atoms 309, 183–188 (2013). URL https://www.sciencedirect.com/science/article/pii/S0168583X13003844.
- [41] Strickland, D. & Mourou, G. Compression of amplified chirped optical pulses. Optics Communications 55, 447–449 (1985). URL https://www.sciencedirect.com/science/article/pii/0030401885901518.
- [42] Pompili, R. et al. Time-resolved study of nonlinear photoemission in radio-frequency photoinjectors. Opt. Lett. 46, 2844–2847 (2021). URL https://opg.optica.org/ol/abstract.cfm?URI=ol-46-12-2844.
- [43] Verra, L. et al. Resonant excitation of plasma wakefields with a train of relativistic particle bunches. Phys. Rev. E 112, 045205 (2025). URL https://link.aps.org/doi/10.1103/x4xl-4fnp.
- [44] Serafini, L. & Ferrario, M. Velocity bunching in photo-injectors. AIP Conference Proceedings 581, 87–106 (2001). URL https://doi.org/10.1063/1.1401564.
- [45] Ferrario, M. et al. Experimental demonstration of emittance compensation with velocity bunching. Phys. Rev. Lett. 104, 054801 (2010). URL https://link.aps.org/doi/10.1103/PhysRevLett.104.054801.
- [46] Qian, M., Ren, C., Wang, D., Zhang, J. & Wei, G. Stark broadening measurement of the electron density in an atmospheric pressure argon plasma jet with double-power electrodes. Journal of Applied Physics 107, 063303 (2010). URL https://doi.org/10.1063/1.3330717.
- [47] Alesini, D. et al. Rf deflector design and measurements for the longitudinal and transverse phase space characterization at sparc. Nuclear Instruments and Methods in Physics Research Section A: Accelerators, Spectrometers, Detectors and Associated Equipment 568, 488–502 (2006). URL https://www.sciencedirect.com/science/article/pii/S0168900206013040.
- [48] Biagioni, A. et al. Electron density measurement in gas discharge plasmas by optical and acoustic methods. Journal of Instrumentation 11, C08003 (2016).
- [49] Galletti, M. et al. Advanced stabilization methods of plasma devices for plasma-based acceleration. Symmetry 14 (2022). URL https://www.mdpi.com/2073-8994/14/3/450.
- [50] Biagioni, A. et al. Gas-filled capillary-discharge stabilization for plasma-based accelerators by means of a laser pulse. Plasma Physics and Controlled Fusion 63, 115013 (2021). URL https://dx.doi.org/10.1088/1361-6587/ac1f68.
- [51] Assmann, R. et al. Eupraxia conceptual design report. The European Physical Journal Special Topics 229, 3675–4284 (2020).
- [52] Alesini, D., et al. EuPRAXIA@SPARC_LAB Technical Design Report. Tech. Rep., INFN (2026).
- [53] Crincoli, L. et al. Advanced ceramic plasma discharge capillaries for high repetition rate operation. Scientific Reports 15, 12456 (2025).
- [54] Whittum, D. H., Sessler, A. M. & Dawson, J. M. Ion-channel laser. Phys. Rev. Lett. 64, 2511–2514 (1990). URL https://link.aps.org/doi/10.1103/PhysRevLett.64.2511.
- [55] Diederichs, S. et al. Positron transport and acceleration in beam-driven plasma wakefield accelerators using plasma columns. Phys. Rev. Accel. Beams 22, 081301 (2019). URL https://link.aps.org/doi/10.1103/PhysRevAccelBeams.22.081301.
- [56] Gessner, S. et al. Design initiative for a 10 tev pcm wakefield collider (2025). URL https://arxiv.org/abs/2503.20214. arXiv:2503.20214.
- [57] ARCO laser system. https://amplitude-laser.com/products/femtosecond-lasers/lasers-for-science/arco/. Accessed: 2026.
- [58] Arévalo, E. & Becker, A. Theoretical analysis of fluorescence signals in filamentation of femtosecond laser pulses in nitrogen molecular gas. Physical Review A 72, 043807 (2005).
- [59] Ammosov, M. V., Delone, N. B. & Krainov, V. P. Alcock, J. A. (ed.) Tunnel Ionization Of Complex Atoms And Atomic Ions In Electromagnetic Field. (ed.Alcock, J. A.) High Intensity Laser Processes, Vol. 0664, 138 – 141. International Society for Optics and Photonics (SPIE, 1986). URL https://doi.org/10.1117/12.938695.