∎
e1e-mail: elsayeny@ucmail.cu.edu
Explainability-Aware Evaluation of Transfer Learning Models for IoT DDoS Detection Under Resource Constraints
Abstract
Distributed denial-of-service (DDoS) attacks threaten the availability of Internet of Things (IoT) infrastructures, particularly under resource-constrained deployment conditions. Although transfer learning models have shown promising detection accuracy, their reliability, computational feasibility, and interpretability in operational environments remain insufficiently explored. This study presents an explainability-aware empirical evaluation of seven pre-trained convolutional neural network architectures for multi-class IoT DDoS detection using the CICDDoS2019 dataset and an image-based traffic representation. The analysis integrates performance metrics, reliability-oriented statistics (MCC, Youden Index, confidence intervals), latency and training cost assessment, and interpretability evaluation using Grad-CAM and SHAP. Results indicate that DenseNet and MobileNet-based architectures achieve strong detection performance while demonstrating superior reliability and compact, class-consistent attribution patterns. DenseNet169 offers the strongest reliability and interpretability alignment, whereas MobileNetV3 provides an effective latency–accuracy trade-off for fog-level deployment. The findings emphasize the importance of combining performance, reliability, and explainability criteria when selecting deep learning models for IoT DDoS detection.
1 Introduction
The Internet of Things (IoT) has emerged as a foundational component of modern digital infrastructures ebrahimpour2024authentication ; alaba2017internet . It has been widely deployed across large-scale domains, including industrial systems kotsiopoulos2025defending ; behnke2023real ; reyes2025analysis , healthcare infrastructures selvaraj2020challenges ; elsayed2023machine ; azzawi2016review , and enterprise networks jayashree2020introduction , as well as in smaller-scale environments such as smart homes wijesundara2024security ; samuel2016review ; alaa2017review , small businesses jones2018can ; jeong2017study , and office settings shetty2024iot . While IoT enables automation and real-time monitoring, its rapid expansion significantly amplifies exposure to various cyber threats shaheen2025systematic ; nappi2020internet . The integration of resource-constrained devices, heterogeneous communication protocols, and distributed architectures introduces substantial security vulnerabilities that can affect hardware assets, sensitive data, and, most critically, system availability sun2025survey . Therefore, securing IoT infrastructure and ensuring resilience are primary cybersecurity concerns.
Denial of Service (DoS) and Distributed Denial of Service (DDoS) attacks are the most severe threats to IoT-driven environments vishwakarma2020survey ; dzamesi2025review . These attacks aim to exhaust bandwidth, computational capacity, or protocol state resources by generating overwhelming traffic volumes (cisco1, ; elsayed2025cryptodna, ). The resulting resource depletion leads to partial or complete service disruption for legitimate users eliyan2021and ; dvzaferovic2019and . From a cybersecurity perspective, such attacks directly violate the availability principle of the pillars of information security: Confidentiality–Integrity–Availability (CIA) triad nist_sp1800_26a , which is shown in Figure 1, which represents the foundational framework for information security samonas2014cia . Therefore, preserving availability in IoT infrastructures is essential to maintaining operational continuity and preventing large-scale service outages.

Recent reports indicate a substantial increase in DDoS activity worldwide. According to VERCARA, the industry analysis report shows a significant year-over-year growth in volumetric and reflection-based DDoS campaigns targeting telecommunications, finance, and service providers vercara2024 . IoT environments are particularly vulnerable due to limited computational resources, constrained memory, and often insufficient built-in security mechanisms kumari2023comprehensive ; yan2025intelligent .
DDoS attacks against IoT networks can take multiple forms, such as volumetric flooding attacks, protocol exploitation attacks, and application-layer attacks kumari2023comprehensive ; al2021ddos ; sharif2023detection . Reflection and amplification techniques, leveraging services such as DNS, NTP, SSDP, and LDAP, enable attackers to magnify traffic volume while spoofing source addresses. Such attacks are commonly executed via botnets comprising compromised devices geographically distributed across multiple regions. alomari2012botnet ; elsayed2023iot ; pandey2025conditional . The distributed nature of botnets makes detection and mitigation particularly challenging hoque2015botnet ; brezo2011challenges ; al2025deep .
Traditional detection mechanisms, such as firewalls, rule-based intrusion detection systems (IDS), and manual traffic monitoring, often struggle to sustain performance under complex and multi-vector DDoS attacks sharafaldin2019developing ; khalaf2019comprehensive ; ghazanfar2020iot . Thus, machine learning and deep learning approaches have increasingly been adopted to identify anomalous traffic patterns doshi2018machine ; zaghloul2021green ; almobaideen2025comprehensive ; elsayed2025extreme ; dougan2025detection ; kaur2023investigation ; elsayed2025and ; mittal2023deep ; hizal2024novel ; roopak2020intrusion ; agrawal2024detection . However, several practical challenges remain insufficiently addressed. Many existing studies prioritize detection accuracy while overlooking computational cost, inference latency, deployment feasibility in resource-constrained IoT environments, and the reliability and transparency of model decisions quincozes2024survey ; elsayed2022autonomous .
In this paper, we aim to address these challenges through a security-grounded empirical evaluation of pre-trained deep learning models for DDoS detection in IoT infrastructures. Specifically, this paper investigates the following core questions: (i) How effectively can pre-trained models detect heterogeneous DDoS attack types in IoT environments? (ii) What are the computational and latency trade-offs associated with deploying such models under fog-level resource constraints? (iii) To what extent can explainable artificial intelligence techniques enhance the reliability and transparency of detection decisions?
To answer these questions, we evaluate multiple lightweight and advanced pre-trained models using a benchmark IoT DDoS dataset. The study analyzes detection performance, computational overhead, and inference time, and integrates SHAP and Grad-CAM explainability methods to assess decision reliability alenezi2021explainability ; tempel2025choose . This paper aims to support the development of reliable and transparent DDoS detection mechanisms for resource-constrained IoT infrastructures by combining performance evaluation with interpretability analysis.
2 Threat Model and Security Assumptions
This paper considers a distributed denial-of-service (DDoS) threat targeting IoT-driven network infrastructures. The threat model is defined to formally characterize adversarial capabilities, defender assumptions, and the security objectives guiding the proposed detection framework Tatam_Shanmugam_Azam_Kannoorpatti_2021 ; Apruzzese2022 .
2.1 Adversary Model
We assume a remote adversary controlling a botnet composed of compromised devices capable of generating high-volume traffic toward a target IoT infrastructure. The attacker can launch volumetric, protocol-based, and application-layer DDoS attacks, including reflection and amplification attacks such as DNS, NTP, SSDP, LDAP, MSSQL, UDP floods, SYN floods, and related variants bottger2015dos ; antonakakis2017mirai ; rossow2014amplification ; mirkovic2004taxonomy ; durumeric2015searching ; kolias2017ddos . The adversary is capable of generating large-scale distributed traffic from multiple sources, spoofing source IP addresses in reflection-based attacks, and varying attack strategies across known DDoS categories to exhaust network and computational resources.
However, the adversary is not assumed to perform adversarial machine learning attacks such as model poisoning during training or evasion through carefully crafted perturbations targeting model decision boundaries biggio2018wild ; Giattino_2019 . Furthermore, we assume that the attacker does not gain direct access to modify or tamper with the deployed detection model. The focus of this paper is on network-level DDoS detection rather than adversarial ML robustness.
2.2 Defender Model
The defender operates at the fog or gateway level within the IoT infrastructure, where traffic is monitored and detected before reaching core services stojmenovic2014fog ; yi2015survey ; 4738466 . The detection system monitors network flow-level features extracted from traffic without performing deep packet inspection or payload analysis moore2005internet . The model is trained offline using labeled data and deployed for real-time inference to support timely attack identification GARCIA2014100 ; 5504793 .
The defender’s objectives are to achieve reliable detection of DDoS attacks while preserving service availability. In particular, minimizing false negatives is critical to prevent prolonged service disruption. Whereas controlling false positives is essential to reduce unnecessary mitigation actions and operational overhead axelsson2000intrusion ; 5356528 .
2.3 Security Objectives
The primary security goal of the proposed framework is to preserve the availability of IoT-driven systems under DDoS conditions. To achieve this objective, the detection mechanism aims to provide timely and accurate identification of attack traffic, maintain stability across heterogeneous attack categories, and support security assurance through explainable decision-making. By integrating performance evaluation with interpretability analysis, the framework seeks to enhance transparency and trust in automated detection within resource-constrained IoT environments.
3 Background and Related Work
3.1 IoT Architecture and Attack Surface
IoT infrastructures are commonly organized into three logical layers: the perception layer, the network layer, and the application layer, as illustrated in Figure 2. The perception layer comprises sensors and embedded devices that acquire data. The network layer enables communication between IoT devices, gateways, and external services through heterogeneous wired and wireless protocols. The application layer delivers monitoring, analytics, and control services jabraeil2020iot ; olivier2015new .

The distributed and heterogeneous nature of IoT systems increases the attack surface, particularly at the network layer, where traffic aggregation and routing occur. Limited computational capacity, constrained memory, and inconsistent security configurations further amplify vulnerability to availability-oriented attacks atlam2020iot . As IoT deployments scale across industrial and enterprise environments, protecting network availability becomes a central security requirement.
3.2 DDoS Threats in IoT Environments
Distributed denial-of-service (DDoS) attacks remain among the most prevalent threats to IoT infrastructures kumari2023comprehensive ; Li_Wei_Wu_Guo_2023 ; conti2018survey . Such attacks aim to exhaust bandwidth, computational resources, or protocol state tables by generating high volumes of malicious traffic Mirko2005 ; specht2004taxonomy . In IoT environments, attackers frequently exploit reflection and amplification mechanisms (e.g., DNS, NTP, SSDP, LDAP) to magnify traffic volume while spoofing source addresses czyz2014measuring .
Botnets composed of compromised IoT devices enable geographically distributed traffic generation at scale 8638982 ; elsayed2023iot ; pandey2025conditional . Due to limited built-in security mechanisms and irregular patch management, IoT devices often serve both as attack targets and as components of attack infrastructure. Consequently, reliable and efficient DDoS detection mechanisms are essential to preserve service availability in IoT-driven systems.
3.3 Machine Learning-Based DDoS Detection
Traditional rule-based intrusion detection systems and signature-based mechanisms often struggle to cope with large-scale, multi-vector DDoS campaigns almobaideen2025comprehensive ; sharafaldin2019developing . To address these limitations, machine learning (ML) and deep learning (DL) techniques have been widely adopted for traffic classification and anomaly detection in IoT environments.
Prior studies have explored classical ML algorithms, including support vector machines, random forests, extreme learning machines, and k-nearest neighbors, for DDoS detection using handcrafted traffic features. More recently, deep neural networks, convolutional neural networks (CNNs), and recurrent architectures have demonstrated improved detection accuracy by learning complex traffic patterns directly from data almobaideen2025comprehensive ; bala2024ai ; elsayed2025extreme ; kaur2021comprehensive ; dougan2025detection . Transfer learning approaches using pre-trained CNN architectures have also been investigated to reduce training cost and leverage feature extraction capabilities developed in large-scale image classification tasks kaur2023investigation ; sanmorino2024fine .
Despite promising detection performance, several limitations persist in the existing literature. Many studies emphasize classification accuracy while providing limited analysis of computational cost, inference latency, and deployment feasibility in resource-constrained IoT or fog-level environments sanmorino2024fine ; sanmorino2024detection ; kachavimath2025detection . In addition, reliability evaluation is often restricted to aggregate performance metrics without examining stability across heterogeneous attack types sharafaldin2019developing . Moreover, explainability and interpretability of deep learning-based detection models remain underexplored, raising concerns regarding transparency, trustworthiness, and forensic usability in operational settings.
In this paper, we address these gaps by providing a comprehensive security-oriented evaluation of pre-trained deep learning models for IoT DDoS detection. The proposed framework integrates performance assessment, computational cost analysis, and explainability evaluation to support reliable and transparent deployment under practical resource constraints.
4 Research Methodology
In this section, we present the research components and methodology of this empirical and analytical study to answer the core research questions. The objective is to systematically evaluate pre-trained deep learning models for detecting DDoS attacks in IoT-driven environments under realistic deployment constraints.
To ensure transparency, reproducibility, and fair comparisons among models, we employed a publicly available benchmark dataset designed for DDoS attacks. Using a standardized dataset allows the research community to replicate and extend the proposed study in future investigations.
The overall research methodology adopted for investigating the pre-trained models for DDoS attack detection is shown in Figure 3.

4.1 Dataset
In this study, we used the CICDDoS2019 benchmark dataset sharafaldin2019developing , which is publicly available and widely adopted in DDoS detection research. The dataset contains labeled network traffic flows representing benign traffic and multiple DDoS attack categories somani2017ddos ; bala2024ai . The considered attack types include DNS amplification, LDAP amplification, MSSQL reflection, NetBIOS, NTP amplification, SNMP amplification, SSDP, UDP flood, SYN flood, TFTP amplification, and UDP-Lag attacks.
Each attack category reflects distinct traffic characteristics, including volumetric flooding, protocol exploitation, and reflection-based amplification mechanisms. This diversity enables evaluating model robustness across heterogeneous attack patterns.

The dataset was preprocessed by removing duplicate records, incomplete samples, and constant-valued features to reduce redundancy and eliminate non-informative attributes. Feature scaling was performed using min–max normalization to ensure consistent value ranges across all features. The normalization process is defined as:
| (1) |
where represents the original feature value and denotes the normalized value scaled to the [0–255] range suitable for image representation.
Following prior studies liu2019predicting ; hussain2020iot ; liu2019novel ; li2017intrusion , the structured tabular traffic data was transformed into image-based representations to enable compatibility with convolutional neural network architectures. Specifically, consecutive chunks of 180 traffic records were extracted and reshaped into RGB images of dimension . The first 60 records were mapped to the red channel, the next 60 to the green channel, and the final 60 to the blue channel. Each generated image was assigned the corresponding class label among the 11 DDoS attack categories and benign traffic.
This transformation encodes temporal–spatial traffic behavior patterns into structured visual representations, enabling the use of pre-trained convolutional models for traffic classification.
The dataset was divided into training, validation, and test subsets with 60%, 20%, and 20% splits, respectively. The split was performed stratified to preserve class distribution across subsets and avoid sampling bias.
4.2 Pre-trained Models Selection
The pre-trained models were selected based on the following criteria:
-
•
The model is designed for image classification within transfer learning frameworks.
-
•
The model is available in TensorFlow/Keras for reproducibility and deployment compatibility.
-
•
The model can accept the transformed image size directly or requires minimal resizing (less than 20% upscale).
-
•
The total number of parameters is below 15 million to align with resource constraints typical in IoT and fog-level deployments.
The use of TensorFlow/Keras facilitates deployment in edge and mobile environments due to its broad industry adoption and support for lightweight inference engines.
Based on these criteria, the selected pre-trained models are summarized in Table 1. The table presents the model characteristics, parameter counts, architectural type, and input handling capability.
| Model | Model Description | No. Param. | Type | Handle Input Size |
| MobileNet | Lightweight CNN for mobile devices | 4M | Lightweight | Yes |
| MobileNetV2 | Improved MobileNet with depthwise separable convolutions | 3.4M | Lightweight | Yes |
| MobileNetV3 | Optimized MobileNet version for efficiency | 5.4M | Lightweight | Yes |
| DenseNet121 | Densely connected CNN with fewer parameters | 8M | CNN-Based | Yes |
| DenseNet169 | Deeper DenseNet variant | 14M | CNN-Based | No |
| EfficientNet-B0 | Optimized for accuracy–efficiency balance | 5.3M | Advanced Architecture | No |
| EfficientNetB1 | Larger EfficientNet variant with higher capacity | 7.8M | Advanced Architecture | No |
4.3 Implementation Specification
The optimization strategy plays a significant role in ensuring stable convergence during fine-tuning. In this study, Stochastic Gradient Descent (SGD) was employed due to its stability and controlled parameter updates in image classification tasks klein2009adaptive ; dogo2018comparative .
Transfer learning with partial fine-tuning was applied by unfreezing the top layers of each model. Since fine-tuning pre-trained networks requires careful learning rate control, the initial learning rate was set to . A Reduce-on-Plateau scheduler was implemented to reduce the learning rate by a factor of 0.5 if validation accuracy did not improve for three consecutive epochs.
All models were trained under identical experimental conditions to ensure fair comparison across architectures. Performance was evaluated on the independent test set using standard classification metrics.
4.4 Experimental Setup
All experiments were implemented in Python using TensorFlow/Keras. The transformed traffic samples were stored and loaded in HDF5 format using the h5py library. Each input image was normalized prior to training by scaling pixel values into the [0,1] range via division by 255. Class labels were encoded using one-hot encoding to support multi-class classification across benign traffic and the DDoS categories included in CICDDoS2019.
4.4.1 Data Splitting and Evaluation Protocol
To ensure a fair comparison across architectures, all models were trained and evaluated using the same data-splitting protocol. The dataset was split into training, validation, and test sets using stratified sampling to preserve the class distribution. Specifically, 20% of the full dataset was reserved as a validation set, and from the remaining portion an additional 20% was held out for final testing. This protocol yields an approximate split of 64% for training, 16% for validation, and 20% for testing. All reported performance metrics, cost measures, and reliability statistics were computed on the held-out test set.
4.4.2 Transfer Learning and Fine-tuning Strategy
We adopted a transfer learning approach using ImageNet-pretrained convolutional neural networks as feature extractors, followed by fine-tuning to adapt the representations to the domain of network traffic images. Each base model was initialized with include_top=False and extended with a lightweight classification head for multi-class classification. The classification head consisted of global average pooling, a dense layer with ReLU activation, and a final softmax layer with the number of traffic classes.
To provide a consistent fine-tuning policy across architectures, each pretrained backbone was partially unfrozen by enabling training for the last 20% of its layers while keeping the remaining layers frozen. This design supports domain adaptation while limiting the computational cost and reducing the risk of catastrophic forgetting. The exact number of unfrozen layers, as well as the resulting trainable and non-trainable parameter counts, varies by architecture and is reported explicitly in Table 2. The provided implementation script reflects the MobileNet configuration, while the remaining models follow the same pipeline with the corresponding pretrained backbone substituted and the last 20% layer-unfreezing rule applied.
4.4.3 Training Configuration
All models were trained using categorical cross-entropy loss and the Stochastic Gradient Descent (SGD) optimizer with momentum, as specified earlier. Training was conducted for 30 epochs with a batch size of 32 and an initial learning rate of 0.001. To stabilize convergence during fine-tuning, a ReduceLROnPlateau scheduler was used, reducing the learning rate by a factor of 0.5 when the validation loss failed to improve for three consecutive epochs. This setup was applied consistently across all evaluated architectures to ensure that model comparisons reflect architectural differences rather than training-policy variation.
4.4.4 Cost and Timing Measurement
To quantify computational cost and fog-level feasibility, we recorded both total training time and per-sample inference latency. Training time was measured as the elapsed time required to complete the full training process for each model, and inference latency was computed as the average prediction time per test sample. These measures reflect the practical deployment overhead, including the implied energy cost associated with compute usage, and are reported in Table 3.
4.4.5 Performance and Reliability Measurement
Model performance was evaluated using accuracy, precision, recall, F1-score, and AUC, together with additional security-relevant reliability indicators including Cohen’s kappa and Hamming loss, as reported in Table 4. To further assess detection reliability beyond accuracy, we computed confidence-oriented statistical measures including 95% confidence intervals, Matthews correlation coefficient (MCC), balanced accuracy, log loss, and Youden’s index, reported in Table 5. These measures were used to characterize stability, agreement beyond chance, and robustness under multi-class conditions, which are essential for operational DDoS detection.
4.4.6 Explainability and Reliability Support
Beyond internal confidence statistics, reliability was further examined through post-hoc explainability analysis. Grad-CAM was employed to inspect spatial localization patterns used by each model to support its predicted class, while SHAP was used to quantify feature-attribution contributions. Together, these explainability methods provide complementary evidence that models rely on consistent, interpretable structures within the transformed traffic representations, supporting trust and transparency in security decision-making.
5 Results and Evaluations
In our empirical evaluation, we evaluate the pre-trained models performance, cost, and reliability.
5.1 Cost Evaluation
For cost evaluation, we focus on implementation cost from two perspectives: (i) computational demand, which reflects hardware requirements and energy consumption, and (ii) time cost, which directly affects operational responsiveness. We compared the models based on total training time and average test time per sample, as inference time is a strong indicator of operational latency and energy cost during deployment.
| Model | No. Layers | 20% Unfreeze | Trainable Param. | Non-trainable Param. |
| MobileNet | 89 | 17 | 1,924,404 | 1,371,840 |
| MobileNetV2 | 157 | 33 | 1,609,164 | 731,584 |
| MobileNetV3 | 279 | 58 | 2,907,564 | 1,401,632 |
| DenseNet121 | 430 | 88 | 1,785,548 | 5,318,336 |
| DenseNet169 | 598 | 122 | 3,780,428 | 8,969,792 |
| EfficientNet-B0 | 240 | 50 | 2,388,060 | 1,744,275 |
| EfficientNetB1 | 342 | 70 | 4,229,676 | 2,428,327 |
We compared the models for the time required for training and the average test time per sample, which are significant indicators of the energy cost to prepare and execute the models. Table 3 shows the total training time (in minutes) and average test time per sample (in seconds).
| Model | Train Time (m) | Avg. test time/sample (s) |
|---|---|---|
| MobileNet | 61.745 | 0.000530 |
| MobileNetV2 | 109.633 | 0.000864 |
| MobileNetV3 | 140.915 | 0.001093 |
| DenseNet121 | 248.882 | 0.002191 |
| DenseNet169 | 345.697 | 0.003050 |
| EfficientNet-B0 | 183.157 | 0.001427 |
| EfficientNetB1 | 240.622 | 0.001972 |
5.2 Performance Evaluation
In our empirical study, we measured the models’ performance using multiple metrics. Table 4 shows a comparison between the pretrained models, including accuracy, precision, recall, F1-score, Area under the curve (AUC), standard error (SE), Cohen’s kappa coefficient (), and Hamming loss (HL). Cohen’s Kappa () was used to measure the agreement between predicted and true labels beyond chance. Kappa () is calculated by:
| (2) |
where is the observed agreement (overall accuracy), and is the expected agreement by chance. For multi-class classification:
| (3) |
| (4) |
where is the number of classes, is the total number of samples, total actual samples of class , is the total predicted samples of class , and is the correctly classified samples for class .
| Model | Accuracy | Precision | Recall | F1-Score | AUC (ROC) | SE | Kappa | HL |
|---|---|---|---|---|---|---|---|---|
| MobileNet | 98.476% | 0.90895 | 0.9008 | 0.90434 | 0.94621 | 0.00163 | 0.89711 | 0.09144 |
| MobileNetV2 | 98.43% | 0.9058 | 0.9058 | 0.89591 | 0.94364 | 0.00166 | 0.89399 | 0.0942 |
| MobileNetV3 | 98.059% | 0.89205 | 0.87209 | 0.88353 | 0.93506 | 0.00182 | 0.86870 | 0.11647 |
| DenseNet121 | 98.25% | 0.89142 | 0.88689 | 0.88814 | 0.93863 | 0.00174 | 0.88187 | 0.10498 |
| DenseNet169 | 98.298% | 0.89788 | 0.89007 | 0.89788 | 0.94036 | 0.00172 | 0.88509 | 0.10212 |
| EfficientNet-B0 | 93.156% | 0.58938 | 0.59623 | 0.58938 | 0.77878 | 0.00279 | 0.53711 | 0.41062 |
| EfficientNetB1 | 85.998% | 0.1599 | 0.21485 | 0.17463 | 0.56816 | 0.00208 | 0.05826 | 0.8401 |


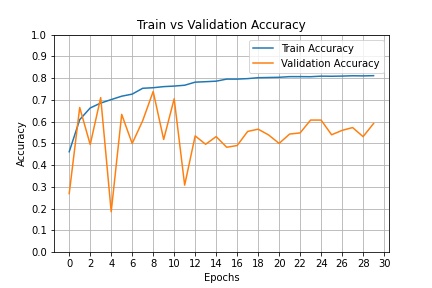
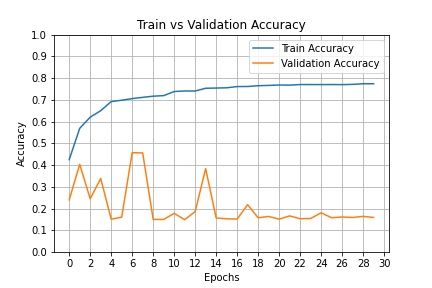
Figure 5 presents the training and validation accuracy curves for all evaluated architectures, illustrated as subfigures for direct comparison. DenseNet121 and DenseNet169 demonstrate stable convergence behavior, with training and validation accuracies increasing steadily and maintaining a minimal generalization gap throughout the epochs. Similarly, MobileNet and MobileNetV3 exhibit consistent learning dynamics, achieving high validation accuracy with only slight divergence from their training performance, indicating strong generalization. In contrast, MobileNetV2 shows greater variability during early epochs before stabilizing at a lower validation accuracy level. EfficientNet-B0 and EfficientNet-B1 exhibit noticeable fluctuations in validation accuracy across epochs, with larger gaps between training and validation performance, suggesting less stable convergence. Overall, the learning curves indicate that DenseNet-based models achieve the most stable and consistent optimization among the evaluated architectures.
The Receiver Operating Characteristic (ROC) curves for the pre-trained models (Figure 6) demonstrate strong discriminative performance across the twelve traffic classes. For DenseNet121 and DenseNet169, the curves closely approach the upper-left corner of the ROC space, with most class-wise AUC values reaching 1.00 and only minimal deviation for a few categories (e.g., AUC 0.99). Similarly, MobileNet and MobileNetV3 exhibit near-perfect separability for the majority of classes, with AUC values predominantly equal to 1.00 and slight reductions ( 0.95–0.99) for specific traffic types. EfficientNet-B0 and EfficientNet-B1 also show strong overall classification performance, with most classes achieving AUC values near 1.00, though minor declines are observed for some categories ( 0.95–0.97). In contrast, MobileNetV2 presents comparatively lower performance variability across several classes, with AUC values ranging more broadly (e.g., 0.84–0.99) and one class exhibiting substantially reduced separability. Overall, the ROC curves indicate that most architectures achieve excellent class discrimination, with DenseNet and MobileNetV3 demonstrating the most consistently high AUC values across all traffic categories.


5.3 Confidence Internal Evaluation
Model reliability is evaluated using confidence-oriented statistical measures. Table 5 reports additional analysis, including the 95% confidence interval, Matthews Correlation Coefficient (MCC), balanced accuracy (macro true positive rate), cross-entropy (log loss), and Youden Index. The Matthews Correlation Coefficient (MCC) was employed due to its robustness to class imbalance and its ability to summarize the confusion matrix into a single correlation value. Additionally, Youden’s Index was calculated to evaluate the overall discriminative power by combining sensitivity and specificity into a single statistic.
For our multi-class classification task, the Multi-Class Generalized (MCC) is calculated by:
| (5) |
where is the confusion matrix, is the correct classifications (diagonal elements of the confusion matrix), is the total true instances of class , is the total predicted instances of class , and is the total samples not in class . The Youden index for binary classes is calculated by:
| (6) |
where the true positive rate (sensitivity) , and the true negative rate (specificity) TNR = . In our multiclass task, the Youden Index is calculated by:
| (7) |
where is the number of classes, is the sensitivity of class , and is the specificity of class .
| Model | 95% CI | MCC | Balanced Acc | Log Loss | Youden Index |
|---|---|---|---|---|---|
| MobileNet | (0.90536,0.91177) | 0.89718 | 0.9008 | 3.28369 | 0.89242 |
| MobileNetV2 | (0.90255, 0.90905) | 0.89425 | 0.94364 | 3.28699 | 0.88728 |
| MobileNetV3 | (0.87997,0.88710) | 0.87077 | 0.93063 | 3.32906 | 0.86127 |
| DenseNet121 | (0.89161, 0.89843) | 0.88212 | 0.93863 | 3.28696 | 0.87726 |
| DenseNet169 | (0.89452, 0.90125) | 0.88523 | 0.94036 | 3.28484 | 0.88071 |
| EfficientNet-B0 | (0.58391, 0.59485) | 0.55983 | 0.77878 | 2.89804 | 0.55756 |
| EfficientNetB1 | (0.15582, 0.16397) | 0.06944 | 0.56816 | 5.47480 | 0.13631 |
6 Model Interpretability and Explainability Analysis
To ensure the reliability and transparency of the proposed pretrained DDoS detection models, an interpretability analysis was conducted using Grad-CAM techniques for spatial localization and SHAP explanations for quantitative feature attribution.
6.1 Grad-CAM Spatial Attention Analysis
To visualize class-discriminative regions used by each model, Grad-CAM heatmaps (Figure 7 were generated for all twelve traffic categories. The top row of each figure shows the original traffic image, and the bottom row shows the corresponding Grad-CAM heatmap.


DenseNet Architectures
As illustrated in Fig. 7(d) and Fig. 7(e), DenseNet121 and DenseNet169 demonstrate highly compact and class-specific activation maps. The models consistently focus on dense vertical packet-structure bands corresponding to attack signatures while suppressing background stripes. DenseNet169 shows slightly stronger activation compactness than DenseNet121, indicating enhanced feature reuse and discriminative amplification due to deeper dense connectivity.
MobileNet Family
The Grad-CAM visualizations for the MobileNet family (Figures 7(a), 7(b), and 7(c) ) show clear differences in spatial attention behavior across the three variants. The original MobileNet exhibits moderate localization capability, with activation maps generally highlighting discriminative vertical packet structures, albeit with noticeable diffusion into adjacent background regions. MobileNetV2 shows comparatively weaker activation intensities and a broader attention distribution, indicating less precise spatial discrimination. In contrast, MobileNetV3 shows improved compactness and consistency of activation patterns, with more concentrated focus on class-relevant regions and reduced background interference. Overall, among the lightweight architectures evaluated, MobileNetV3 achieves the most effective spatial localization and interpretability.
EfficientNet Family
The Grad-CAM visualizations in Figures 7(f) and 7(g) indicate that the EfficientNet architectures produce comparatively smoother and more spatially diffused activation patterns. While the models successfully identify relevant vertical packet structures associated with attack signatures, the attention maps extend across broader regions, reflecting less concentrated localization. This diffusion is accompanied by weaker suppression of non-informative background areas, suggesting a more distributed evidence aggregation strategy rather than sharp feature discrimination. Among all evaluated models, EfficientNet-B1 exhibits the most widely distributed activation behavior, indicating the lowest degree of spatial compactness and discriminative focus.
| Model | Spatial Compactness | Class Consistency | Background Suppression | Interpretability Level |
|---|---|---|---|---|
| DenseNet169 | Very High | Very High | Strong | Excellent |
| DenseNet121 | High | High | Strong | Very Good |
| MobileNetV3 | Moderate to High | Moderate to High | Moderate | Good |
| MobileNet | Moderate | Moderate | Moderate | Fair–Good |
| MobileNetV2 | Moderate | Moderate | Moderate to Low | Moderate |
| EfficientNet-B0 | Low to Moderate | Moderate | Weak | Moderate |
| EfficientNet-B1 | Low | Moderate | Weak | Limited |
As shown in Table 6, DenseNet169 demonstrates the highest spatial compactness and class consistency, whereas EfficientNetB1 exhibits the lowest degree of discriminative localization.
The qualitative categories reported in Table 6 are defined based on visual and structural assessment of the Grad-CAM heatmaps across all twelve classes. Spatial compactness refers to the degree to which activation regions are tightly concentrated around discriminative packet-density structures rather than diffused across adjacent areas. Models categorized as Very High exhibit sharply localized vertical activation bands with minimal spread, whereas models categorized as Low exhibit broad, diffuse attention patterns. Class consistency evaluates the stability of activation behavior across different attack categories. A Very High rating indicates consistent localization patterns across all classes, while Moderate reflects variability in attention precision depending on the attack type. Background suppression measures the model’s ability to avoid activating non-informative regions (e.g., low-density or blank traffic areas). A Strong rating corresponds to clear suppression of irrelevant regions, whereas Weak indicates noticeable activation outside meaningful packet structures. These categorical assessments are derived from comparative visual inspection of heatmap compactness, intensity concentration, and suppression behavior across all models and classes. The interpretability level is then assigned based on the combined performance across these three criteria.


6.2 SHAP Feature Attribution Analysis
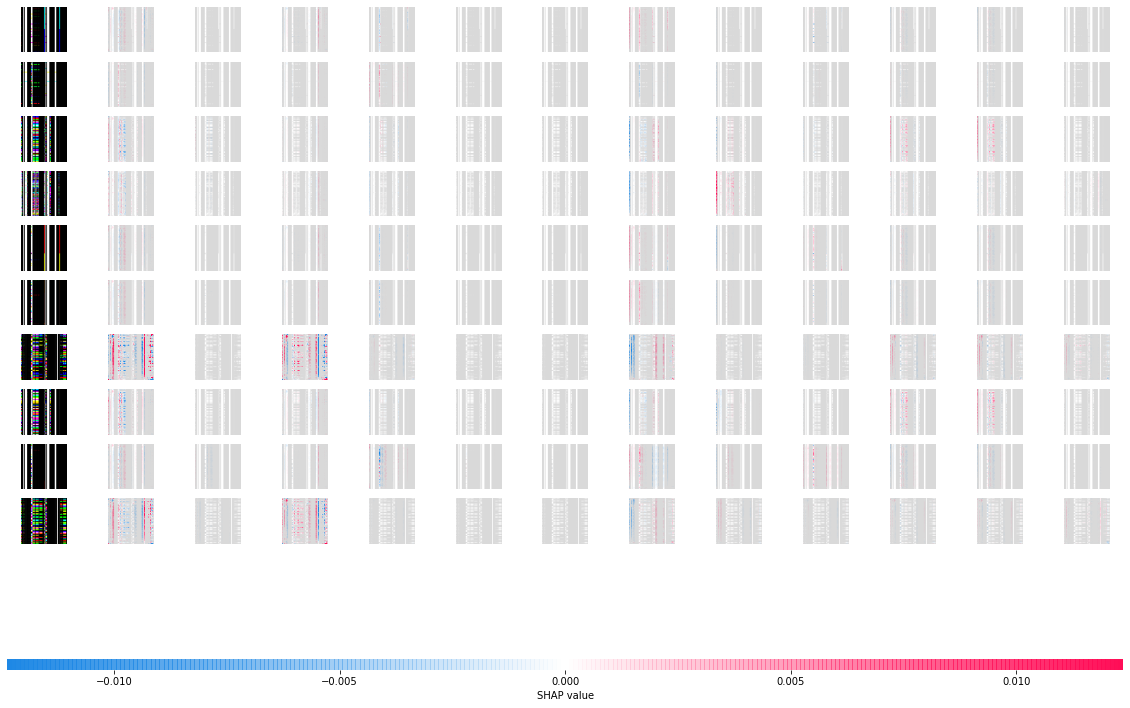
To quantitatively assess the contribution of individual spatial regions to model predictions, SHAP (SHapley Additive exPlanations) values were computed for representative samples from each traffic class. Unlike Grad-CAM, which highlights spatial attention regions, SHAP provides a feature-level attribution score indicating the magnitude and direction of each region’s contribution toward the final class prediction. Positive SHAP values correspond to features that support the predicted class, whereas negative values indicate suppression or counter-evidence. The SHAP visualizations for each evaluated architecture are presented in Figure 8.
DensNet Architectures
As observed in Figure 8(d) and Figure 8(e), the DenseNet architectures exhibit the highest SHAP magnitude range, reaching approximately 0.03. The attribution maps reveal highly concentrated contribution regions aligned with dense vertical packet-structure bands corresponding to attack signatures. Moreover, there is a clear, consistent separation between positive regions that reinforce the predicted attack class and negative regions that suppress non-informative background regions.
This pattern indicates reliance on a decisive feature and strong discriminative capability. The compactness of SHAP contributions demonstrates that DenseNet models amplify localized, class-specific patterns rather than distributing evidence broadly across the image. Such behavior reflects confident and structured decision-making and aligns with their superior predictive performance.
MobileNet Family
Figures 8(a), 8(b), and 8(c) show that MobileNet and MobileNetV3 exhibit moderate SHAP magnitudes, generally around 0.02, while MobileNetV2 displays a lower magnitude range of approximately 0.01. The attribution maps for these models are moderately compact but display some diffusion across adjacent spatial regions.
MobileNetV3 demonstrates improved feature selectivity compared to MobileNetV2, with stronger concentration around discriminative packet structures and clearer suppression of irrelevant regions. In contrast, MobileNetV2 shows weaker attribution intensity and more distributed contribution patterns, indicating less decisive feature usage. Overall, the MobileNet family strikes a balance between computational efficiency and moderate interpretability, with MobileNetV3 being the most interpretable among the lightweight architectures.
EfficientNet Family
Figures 8(f) and 8(g) illustrate the SHAP attribution behavior of EfficientNet-B0 and EfficientNet-B1. EfficientNet-B0 exhibits moderate magnitude contributions (approximately 0.02), but the attribution patterns are noticeably more diffused compared to DenseNet models. Although relevant regions are activated, contributions are distributed across broader spatial areas, suggesting smoother evidence aggregation rather than sharp discriminative emphasis.
EfficientNet-B1 demonstrates the smallest SHAP magnitude range (approximately 0.006) among all evaluated models. The attribution maps show highly diffused contributions with limited strong positive or negative peaks. This indicates that the model relies on distributed evidence across many regions rather than concentrating on a few decisive features. While such behavior may enhance generalization stability, it reduces interpretability, clarity, and decisiveness.
Table 7 presents quantitative SHAP attribution characteristics across all evaluated architectures.
| Model | SHAP Magnitude | Attribution Concentration | Negative Suppression | Attribution Strength |
|---|---|---|---|---|
| DenseNet169 | 0.03 | Very Compact | Strong | Very Strong |
| DenseNet121 | 0.03 | Compact | Strong | Strong |
| MobileNetV3 | 0.02–0.025 | Moderate | Moderate | Moderate–Strong |
| MobileNet | 0.02 | Moderate | Moderate | Moderate |
| EfficientNet-B0 | 0.02 | Diffused | Moderate–Weak | Moderate |
| MobileNetV2 | 0.01 | Less Compact | Moderate–Weak | Weak–Moderate |
| EfficientNet-B1 | 0.006 | Highly Diffused | Weak | Weak |
6.3 Integrated Interpretability Comparison
The combined Grad-CAM and SHAP analyses demonstrate strong methodological agreement. Architectures that exhibit compact, well-localized spatial attention patterns in Grad-CAM also show higher SHAP magnitudes and clearer positive–negative feature separation. This cross-method consistency strengthens the validity of the interpretability conclusions.
DenseNet169 consistently achieves the highest spatial compactness, the strongest SHAP attribution magnitude, and the most effective background suppression. DenseNet121 follows closely, demonstrating similarly compact but slightly less intense attribution behavior. MobileNetV3 represents the strongest lightweight architecture in terms of interpretability, while EfficientNet-B1 exhibits the lowest degree of discriminative localization and feature decisiveness.
These interpretability findings align closely with quantitative evaluation metrics such as the Matthews Correlation Coefficient (MCC) and the Youden Index, further reinforcing the relationship between discriminative localization and classification robustness.
Table 8 summarizes the overall interpretability ranking derived from the integrated analysis.
| Model | Rank |
|---|---|
| DenseNet169 | 1 |
| DenseNet121 | 2 |
| MobileNetV3 | 3 |
| MobileNet | 4 |
| EfficientNet-B0 | 5 |
| MobileNetV2 | 6 |
| EfficientNet-B1 | 7 |
6.4 Class-wise Detection Analysis
To further assess detection reliability across heterogeneous attack categories, confusion matrices were generated for all evaluated architectures. Figure 9 presents the multi-class confusion matrices for the seven pre-trained models under the CICDDoS2019 dataset.


Across the evaluated models, amplification-based attacks such as DNS, NTP, and SSDP exhibit consistently high true-positive rates, as reflected by strong diagonal dominance in the corresponding matrix rows. DenseNet architectures demonstrate the cleanest diagonal concentration with minimal cross-class leakage, indicating stable discrimination across heterogeneous attack categories. MobileNet and MobileNetV3 maintain strong class separation, with limited misclassification, primarily among protocol-based floods that exhibit similar statistical characteristics. In contrast, EfficientNet-B1 shows increased off-diagonal dispersion, reflecting instability in distinguishing certain attack categories and benign traffic. These findings reinforce the reliability metrics reported in Tables 4 and 5.
Results indicate that amplification-style attacks (e.g., DNS, NTP, SSDP) are detected with consistently high true-positive rates, reflecting distinct traffic structures in the image representation. Misclassifications are more likely between traffic classes with similar statistical behavior, particularly between protocol-based floods and benign traffic, suggesting overlapping visual patterns in the transformed feature space.
6.5 Implications for Cybersecurity Deployment
Interpretability plays a critical role in intrusion detection systems, particularly in cybersecurity contexts where both false positives and false negatives can have significant operational consequences. Models that exhibit compact spatial localization and decisive feature attribution provide clearer justification for detection decisions and improve system transparency.
DenseNet architectures demonstrate superior explainability through both concentrated Grad-CAM localization and strong SHAP contribution magnitude. Such behavior indicates structured and confident decision-making, which is desirable in security-sensitive environments where auditability and trust are essential. In contrast, architectures exhibiting diffused attribution patterns may still perform adequately but offer less transparent reasoning pathways.
Consequently, from an explainability and deployment perspective, DenseNet-based architectures appear more suitable for real-world DDoS detection systems requiring interpretable and defensible decision-making processes.
7 Discussion
In this section, we synthesize the empirical findings across detection performance, computational cost, reliability metrics, and model interpretability, with emphasis on practical deployment for IoT-driven systems and fog-level intrusion detection. The evaluation spans three architecture families (MobileNet, DenseNet, EfficientNet). It integrates conventional performance metrics (Table 4), computational cost indicators (Table 3), reliability-oriented statistics (Table 5), and explainability evidence from Grad-CAM and SHAP analyses (Figures 7 and 8, Tables 6 and 7).
7.1 Performance Trade-offs Across Architectures
Across the evaluated architectures, MobileNet, DenseNet121, and DenseNet169 achieve consistently high overall accuracy (approximately 98%) and strong macro-level performance (Table 4), indicating that transfer learning on image-encoded network traffic captures discriminative structure for multi-class DDoS recognition. Among these, MobileNet attains the highest reported accuracy (98.476%), whereas DenseNet169 maintains comparable accuracy (98.298%) with strong agreement statistics (Kappa 0.885) and robust correlation-based reliability (MCC 0.885; Table 5). These results suggest that DenseNet connectivity offers a favorable inductive bias for exploiting repeated packet-structure patterns introduced by the tabular-to-image transformation (Figure 4).
In contrast, EfficientNet architectures underperform in this setting, especially EfficientNet-B1, which exhibits a marked drop in accuracy (85.998%), low agreement (Kappa 0.058), weak MCC (0.069), and high Hamming loss (0.8401; Table 4). This indicates that despite EfficientNet’s reputation for accuracy–efficiency trade-offs in natural image recognition, it does not transfer robustly to the highly structured, synthetic-like texture patterns represented in network traffic images under the current fine-tuning scheme. EfficientNet-B0 performs better than B1 but remains substantially lower than MobileNet and DenseNet models, with reduced precision/recall and lower discriminative capacity (AUC 0.779; Table 4).
7.2 ROC Behavior and Class-wise Separability
The ROC subfigures in Figure 6 corroborate the above findings at the class level. DenseNet121 and DenseNet169 display curves that closely approach the upper-left corner for most classes, with class-wise AUC values near 1.00 and limited degradation for only a small subset of categories. MobileNet and MobileNetV3 similarly show near-perfect separability for most classes, with only minor AUC declines (approximately 0.95–0.99) for a few traffic types. These patterns imply strong separability of the learned representations across attack categories under the proposed image encoding.
MobileNetV2 shows greater variability in class-wise AUC values and includes at least one category with noticeably reduced separability, aligning with its slightly weaker macro-level results and reduced explainability coherence. EfficientNet-B0 and EfficientNet-B1 exhibit greater class-dependent deviations, suggesting that the learned evidence for some classes is either less discriminative or more unstable in feature attribution, a claim further supported by the interpretability results discussed later.
7.3 Training Dynamics and Generalization Stability
The train-versus-validation learning curves (Figure 5) provide complementary evidence about optimization stability and generalization. DenseNet121 and DenseNet169 exhibit smooth convergence and a small, stable generalization gap across epochs, indicating consistent optimization and robust generalization under the selected fine-tuning strategy. MobileNet and MobileNetV3 similarly converge steadily with high validation accuracy and limited divergence from training behavior, suggesting that these architectures generalize effectively while maintaining computational efficiency.
In contrast, EfficientNet-B0 and EfficientNet-B1 display noticeable validation oscillations and larger train–validation gaps. Such instability is consistent with their lower performance and reliability statistics (Tables 4 and 5) and suggests sensitivity to hyperparameters, fine-tuning depth, or mismatch between pretraining priors and the target domain. MobileNetV2 also shows higher early-epoch variability before stabilization, which may partially explain its weaker discriminative and interpretability behavior relative to MobileNetV3.
7.4 Cost and Efficiency for Fog-level Deployment
From a deployment perspective, the cost evaluation demonstrates a clear trade-off between latency and accuracy across the model families. MobileNet achieves the lowest inference time per sample (0.000530 s), followed by MobileNetV2 and MobileNetV3 (Table 3), making MobileNet variants highly attractive for resource-constrained IoT/fog nodes. DenseNet models, while robust and explainable, exhibit higher inference time (DenseNet169: 0.003050 s), reflecting the computational overhead of deeper dense connectivity. EfficientNet-B0 and EfficientNet-B1 fall between MobileNet and DenseNet in inference time, but their performance and reliability limitations reduce their practical suitability under strict operational constraints.
Training time also varies substantially, with MobileNet requiring roughly 62 minutes and DenseNet169 requiring approximately 346 minutes (Table 3). While training costs may be amortized in many deployment scenarios, they become more important in scenarios with frequent model updates, online adaptation, or edge personalization. Therefore, a pragmatic deployment strategy may involve selecting MobileNetV3 when low latency is critical, and selecting DenseNet169 when interpretability and reliability are prioritized.
7.5 Reliability Metrics and Decision Confidence
These reliability gaps are important in operational IoT environments because risk is not determined solely by average accuracy. The reliability-oriented statistics in Table 5 strengthen the interpretation of the performance results. Models with high MCC and Youden Index provide more trustworthy multi-class decision behavior, particularly under uneven class distributions. DenseNet169 and MobileNet achieve strong MCC values near 0.885–0.897 and high Youden Index values near 0.88–0.89, supporting their suitability for operational deployment. In contrast, EfficientNet-B1 demonstrates extremely low MCC and Youden Index values, indicating unreliable class discrimination and weak sensitivity–specificity balance under the evaluated conditions.
These reliability gaps are important in operational environments because operational risk is not governed solely by average accuracy. A model that appears accurate but has weak MCC/Youden scores can still systematically fail for certain critical attack categories, leading to service disruption or undetected intrusions.
7.6 Explainability: Agreement Between Grad-CAM and SHAP
A core contribution of this work is the explainability-aware evaluation of transfer learning architectures for DDoS detection. The Grad-CAM results (Figure 7 and Table 6) show that DenseNet architectures produce the most compact and class-consistent spatial localization patterns, with strong background suppression. MobileNetV3 demonstrates improved compactness compared to MobileNetV2 and the base MobileNet, supporting its role as the most interpretable lightweight model. EfficientNet architectures, particularly EfficientNet-B1, show the most diffuse attention with weaker suppression of non-informative regions, indicating less discriminative localization.
The SHAP analysis (Figure 8 and Table 7) quantitatively confirms these trends. DenseNet models achieve the highest attribution magnitude (approximately 0.03) with compact contributions and clear positive–negative separation, reflecting decisive feature reliance and structured evidence. MobileNetV3 exhibits moderate-to-strong attribution magnitude (approximately 0.02–0.025) with improved selectivity relative to MobileNetV2, while EfficientNet-B1 shows the smallest magnitude (approximately 0.006) and highly diffused attribution, indicating weaker decisiveness and less transparent decision logic.
Importantly, the agreement between Grad-CAM (spatial localization) and SHAP (feature attribution magnitude and direction) strengthens confidence in the interpretability conclusions. Models that are compact and consistent in Grad-CAM also exhibit stronger and more separable SHAP patterns, which aligns with the integrated interpretability ranking (Table 8). This multi-method agreement is a practical indicator of trustworthiness: a model that is both accurate and explainable is more suitable for security-sensitive adoption where analysts require defensible explanations.
7.7 Implications for IoT-driven Business Systems
For IoT-driven business systems, the choice of model depends on the balance between operational constraints and trust requirements. Lightweight MobileNet models minimize latency and are well-suited for fog/edge deployment where rapid filtering and early warning are required. Within this family, MobileNetV3 offers a strong compromise, providing high performance and more coherent explanations than MobileNetV2. DenseNet models, particularly DenseNet169, provide the strongest evidence of interpretability and reliability, making them suitable for scenarios where decisions must be auditable and defensible (e.g., regulated infrastructures, critical services, or environments requiring forensic analysis).
EfficientNet architectures are less favorable in the evaluated configuration due to reduced stability, weaker reliability, and lower interpretability clarity. This does not imply that EfficientNet is inherently unsuitable for cybersecurity, but rather that the architectural priors and fine-tuning configuration may require further adaptation for traffic-image representations (e.g., alternative unfreezing strategies, stronger regularization, or architecture-specific preprocessing).
Overall, the results support a deployment-centric recommendation: MobileNetV3 is a practical choice for low-latency edge detection, whereas DenseNet169 is a strong choice for reliability-critical and interpretability-critical detection pipelines where analyst trust and decision transparency are central requirements.
8 Security Robustness and Limitations
While the proposed evaluation demonstrates strong detection performance across multiple DDoS categories, several security-related limitations should be considered.
First, the evaluation is conducted using the CICDDoS2019 benchmark dataset. Although comprehensive, real-world deployments may encounter unseen attack patterns, distribution shifts, or zero-day attack variants that could impact model generalization.
Second, this study assumes a closed-world setting where attack categories are known during training. The detection capability against novel or adversarially modified attacks remains an open research challenge.
Third, the framework does not explicitly evaluate adversarial evasion techniques such as traffic perturbation or adversarial feature manipulation. Future work may explore adversarial robustness and online adaptive learning mechanisms.
Finally, encrypted traffic environments and payload obfuscation may alter feature distributions, potentially affecting detection reliability.
Despite these limitations, the presented evaluation provides a structured security assessment of pre-trained models under realistic IoT deployment constraints.
9 Conclusion
This paper presented a comprehensive empirical evaluation of transfer learning architectures for DDoS detection in IoT-driven business systems, emphasizing not only predictive performance but also computational cost, reliability, and explainability. Using the CICDDoS2019 benchmark and an image-based transformation of network traffic, seven pretrained models were fine-tuned and compared under a unified experimental protocol.
The results demonstrate that MobileNet- and DenseNet-based architectures achieve strong multi-class detection performance (approximately 98% accuracy), with high agreement and reliability indicators, including Cohen’s Kappa, MCC, and Youden Index. DenseNet169 emerges as the most reliable and explainable architecture, exhibiting compact, class-consistent Grad-CAM localization and the strongest SHAP attribution magnitudes, with clear positive-negative separation. MobileNetV3 represents the strongest lightweight alternative, providing high detection capability with improved interpretability coherence compared to MobileNetV2, while also maintaining low inference latency suitable for fog/edge deployment. In contrast, EfficientNet-B0 and especially EfficientNet-B1 exhibit reduced stability, weaker reliability statistics, and more diffuse interpretability patterns under the evaluated configuration, limiting their suitability for resource-constrained and security-sensitive deployment.
From a practical deployment perspective, the findings highlight an actionable trade-off. For real-time fog-level detection under strict latency and resource constraints, MobileNetV3 provides an effective balance between efficiency and explainability. For environments where decision accountability and analyst trust are critical, DenseNet169 delivers the most defensible, transparent detection behavior. Collectively, the evidence suggests that interpretability measures are not merely auxiliary; instead, compact localization and decisive attribution align with stronger reliability metrics and support higher-confidence intrusion detection in operational business systems.
Future work will extend this study by incorporating deeper, confusion-matrix-driven class-specific error analysis, evaluating robustness under distribution shifts (e.g., unseen attack variants), and exploring edge-aware compression and quantization strategies to reduce inference cost further while preserving interpretability and reliability guarantees.
Credit Authorship Contribution Statement
Nelly Elsayed (sole author): Conceptualization, Methodology, Data Curation, Formal Analysis, Investigation, Visualization, Writing, and Original Draft Preparation, Validation, Project Administration, Writing, Review and Editing.
Declaration of competing interest
The authors declare that they have no competing financial or personal interests that could have influenced the work reported in this paper.
Funding
This research did not receive any specific grant from funding agencies in the public, commercial, or not-for-profit sectors.
Data availability
The dataset CIC-DDoS2019 Dataset that has been used in this paper is publicly available at the following links:
- •
- •
The image format of this dataset is publicly available but requires membership to access using the IEEE DataPort the following link:
- •
Declaration of generative AI and AI-assisted technologies in the writing process
During the preparation of this work, the authors used generative AI including ChatGPT, Grammarly, and Gemini tools solely for language refinement to ensure that the texts are free of errors in grammar, spelling, and punctuation. In addition to LaTeX formatting assistance. All generated text was thoroughly reviewed, edited, and verified by the authors, who take full responsibility for the content and integrity of the final manuscript.
References
- (1) E. Ebrahimpour, S. Babaie, International Journal of Information Security 23(3), 1583 (2024)
- (2) F.A. Alaba, M. Othman, I.A.T. Hashem, F. Alotaibi, Journal of network and computer applications 88, 10 (2017)
- (3) T. Kotsiopoulos, P. Radoglou-Grammatikis, Z. Lekka, V. Mladenov, P. Sarigiannidis, International Journal of Information Security 24(4), 157 (2025)
- (4) I. Behnke, H. Austad, IEEE Internet of Things Journal 11(5), 7399 (2023)
- (5) R. Reyes-Acosta, C. Dominguez-Baez, R. Mendoza-Gonzalez, M. Vargas Martin, International Journal of Information Security 24(1), 31 (2025)
- (6) S. Selvaraj, S. Sundaravaradhan, SN Applied Sciences 2(1), 139 (2020)
- (7) Z. ElSayed, M. Ozer, N. Elsayed, A. Abdelgawad, arXiv preprint arXiv:2305.19347 (2023)
- (8) M.A. Azzawi, R. Hassan, K.A.A. Bakar, International Journal of Applied Engineering Research 11(20), 10216 (2016)
- (9) L. Jayashree, G. Selvakumar, in Getting Started with Enterprise Internet of Things: Design Approaches and Software Architecture Models (Springer, 2020), pp. 71–96
- (10) W. Wijesundara, J.S. Lee, D. Tith, E. Aloupogianni, H. Suzuki, T. Obi, International Journal of Information Security 23(3), 1927 (2024)
- (11) S.S.I. Samuel, in 2016 3rd MEC International conference on big data and smart city (ICBDSC) (IEEE, 2016), pp. 1–4
- (12) M. Alaa, A.A. Zaidan, B.B. Zaidan, M. Talal, M.L.M. Kiah, Journal of network and computer applications 97, 48 (2017)
- (13) N.B. Jones, C.M. Graham, Bulletin of Science, Technology & Society 38(1-2), 3 (2018)
- (14) Y.S. Jeong, Journal of Convergence for Information Technology 7(2), 83 (2017)
- (15) K. Shetty, M. Mudholkar, P. Mudholkar, M. LB, S. TN, et al., in 2024 Second International Conference Computational and Characterization Techniques in Engineering & Sciences (IC3TES) (IEEE, 2024), pp. 1–5
- (16) Y.Y. Shaheen, M.J. Hornos, C. Rodríguez-Domínguez, International Journal of Information Security 24(6), 236 (2025)
- (17) I. Nappi, G. de Campos Ribeiro, Journal of Corporate Real Estate 22(1), 71 (2020)
- (18) P. Sun, Y. Wan, Z. Wu, Z. Fang, Q. Li, Computers & Security 148, 104097 (2025)
- (19) R. Vishwakarma, A.K. Jain, Telecommunication systems 73(1), 3 (2020)
- (20) L. Dzamesi, N. Elsayed, in 2025 IEEE 4th International Conference on Computing and Machine Intelligence (ICMI) (IEEE, 2025), pp. 01–08
- (21) CISCO. What is a ddos attack? (2025). URL https://www.cisco.com/c/en/us/products/security/what-is-a-ddos-attack.html. Accessed: 19 February 2025
- (22) Z. ElSayed, A. Abdelgawad, N. Elsayed, arXiv preprint arXiv:2501.18549 (2025)
- (23) L.F. Eliyan, R. Di Pietro, Future Generation Computer Systems 122, 149 (2021)
- (24) E. Džaferović, A. Sokol, A. Abd Almisreb, S.M. Norzeli, Sustainable Engineering and Innovation 1(1), 43 (2019)
- (25) National Cybersecurity Center of Excellence (NCCoE) and National Institute of Standards and Technology (NIST). NIST Special Publication 1800-26A: Data Integrity: Detecting and Responding to Ransomware and Other Destructive Events, Volume A: Executive Summary. https://www.nccoe.nist.gov/publication/1800-26/VolA/1800-26A.html (2020)
- (26) S. Samonas, D. Coss, Journal of Information System Security 10(3) (2014)
- (27) VERCARA. Vercara ddos analysis reports (2024). URL https://vercara.com/resources/reports. Accessed: 19 February 2025
- (28) P. Kumari, A.K. Jain, Computers & Security 127, 103096 (2023)
- (29) J. Yan, H. Zhou, W. Wang, Information Systems Frontiers pp. 1–20 (2025)
- (30) Y. Al-Hadhrami, F.K. Hussain, World Wide Web 24(3), 971 (2021)
- (31) D.M. Sharif, H. Beitollahi, Computers & Security 135, 103511 (2023)
- (32) E. Alomari, S. Manickam, B.B. Gupta, S. Karuppayah, R. Alfaris, arXiv preprint arXiv:1208.0403 (2012)
- (33) N. Elsayed, Z. ElSayed, M. Bayoumi, in 2023 IEEE World AI IoT Congress (AIIoT) (IEEE, 2023), pp. 0134–0142
- (34) N. Pandey, P.K. Mishra, Computers & Security 150, 104199 (2025)
- (35) N. Hoque, D.K. Bhattacharyya, J.K. Kalita, IEEE Communications Surveys & Tutorials 17(4), 2242 (2015)
- (36) F. Brezo, I. Santos, P.G. Bringas, J.L. del Val, in 2011 22nd International Workshop on Database and Expert Systems Applications (IEEE, 2011), pp. 95–101
- (37) T. Al-Shurbaji, M. Anbar, S. Manickam, I.H. Hasbullah, N. Alfriehat, B.A. Alabsi, A.R. Alzighaibi, H. Hashim, IEEE Access 13, 11792 (2025)
- (38) I. Sharafaldin, A.H. Lashkari, S. Hakak, A.A. Ghorbani, in 2019 international carnahan conference on security technology (ICCST) (IEEE, 2019), pp. 1–8
- (39) B.A. Khalaf, S.A. Mostafa, A. Mustapha, M.A. Mohammed, W.M. Abduallah, IEEE Access 7, 51691 (2019)
- (40) S. Ghazanfar, F. Hussain, A.U. Rehman, U.U. Fayyaz, F. Shahzad, G.A. Shah, in 2020 International Conference on Emerging Trends in Smart Technologies (ICETST) (IEEE, 2020), pp. 1–6
- (41) R. Doshi, N. Apthorpe, N. Feamster, in 2018 IEEE security and privacy workshops (SPW) (IEEE, 2018), pp. 29–35
- (42) Z.S. Zaghloul, N. Elsayed, C. Li, M. Bayoumi, in 2021 IEEE 7th World Forum on Internet of Things (WF-IoT) (IEEE, 2021), pp. 628–632
- (43) W. Almobaideen, O. Abu Alghanam, M. Abdullah, S.B. Hussain, U. Alam, International Journal of Information Security 24(3), 110 (2025)
- (44) N. Elsayed, L. Dzamesi, Z. ElSayed, M. Ozer, arXiv preprint arXiv:2507.05132 (2025)
- (45) S.M. Doğan, A. Koçak, M. Alkan, International Journal of Information Security 24(5), 209 (2025)
- (46) S. Kaur, A.K. Sandhu, A. Bhandari, International Journal of Information Security 22(6), 1949 (2023)
- (47) N. Elsayed, Z. ElSayed, A. Abdelgawad, in The International FLAIRS Conference Proceedings, vol. 38 (2025), vol. 38
- (48) M. Mittal, K. Kumar, S. Behal, Soft computing 27(18), 13039 (2023)
- (49) S. Hizal, U. Cavusoglu, D. Akgun, Internet of Things 28, 101336 (2024)
- (50) M. Roopak, G.Y. Tian, J. Chambers, in 2020 10th annual computing and communication workshop and conference (CCWC) (IEEE, 2020), pp. 0562–0567
- (51) A. Agrawal, P. Baniya, E.M. Alazzawi, N. Rakesh, B. Bhushan, A. Jamil, in 2024 2nd International Conference on Artificial Intelligence, Blockchain, and Internet of Things (AIBThings) (IEEE, 2024), pp. 1–5
- (52) V.E. Quincozes, S.E. Quincozes, J.F. Kazienko, S. Gama, O. Cheikhrouhou, A. Koubaa, International Journal of Information Security 23(3), 1975 (2024)
- (53) Z. ElSayed, N. Elsayed, C. Li, M. Bayoumi, in 2022 IEEE 8th World Forum on Internet of Things (WF-IoT) (IEEE, 2022), pp. 1–5
- (54) R. Alenezi, S.A. Ludwig, in 2021 IEEE symposium series on computational intelligence (SSCI) (IEEE, 2021), pp. 01–10
- (55) F. Tempel, D. Groos, E.A.F. Ihlen, L. Adde, I. Strümke, Applied Intelligence 55(17), 1107 (2025)
- (56) M. Tatam, B. Shanmugam, S. Azam, K. Kannoorpatti, Heliyon 7(1), e05969 (2021). DOI 10.1016/j.heliyon.2021.e05969. URL https://linkinghub.elsevier.com/retrieve/pii/S2405844021000748
- (57) G. Apruzzese, M. Andreolini, L. Ferretti, M. Marchetti, M. Colajanni, Digital Threats: Research and Practice 3(3), 1–19 (2022). DOI 10.1145/3469659. URL https://dl.acm.org/doi/10.1145/3469659
- (58) T. Böttger, L. Braun, O. Gasser, F. Von Eye, H. Reiser, G. Carle, in International Workshop on Traffic Monitoring and Analysis (Springer, 2015), pp. 205–218
- (59) M. Antonakakis, T. April, M. Bailey, M. Bernhard, E. Bursztein, J. Cochran, Z. Durumeric, J.A. Halderman, L. Invernizzi, M. Kallitsis, D. Kumar, C. Lever, Z. Ma, J. Mason, D. Menscher, C. Seaman, N. Sullivan, K. Thomas, Y. Zhou, in Proceedings of the 26th USENIX Security Symposium (2017), pp. 1093–1110
- (60) C. Rossow, Proceedings of the Network and Distributed System Security Symposium (NDSS) (2014)
- (61) J. Mirkovic, P. Reiher, ACM SIGCOMM Computer Communication Review 34(2), 39 (2004)
- (62) Z. Durumeric, E. Wustrow, J.A. Halderman, Proceedings of the Network and Distributed System Security Symposium (NDSS) (2015)
- (63) C. Kolias, G. Kambourakis, A. Stavrou, J. Voas, Computer 50(7), 80 (2017)
- (64) B. Biggio, F. Roli, Pattern Recognition 84, 317 (2018)
- (65) C.M. Giattino, L. Kwong, C. Rafetto, N.A. Farahany, in Proceedings of the 2019 AAAI/ACM Conference on AI, Ethics, and Society (ACM, Honolulu HI USA, 2019), p. 397–402. DOI 10.1145/3306618.3314269. URL https://dl.acm.org/doi/10.1145/3306618.3314269
- (66) I. Stojmenovic, S. Wen, Proceedings of the 2014 Federated Conference on Computer Science and Information Systems pp. 1–8 (2014)
- (67) S. Yi, C. Li, Q. Li, Proceedings of the 2015 Workshop on Mobile Big Data pp. 37–42 (2015)
- (68) T.T. Nguyen, G. Armitage, IEEE Communications Surveys & Tutorials 10(4), 56 (2008). DOI 10.1109/SURV.2008.080406
- (69) A.W. Moore, D. Zuev, ACM SIGMETRICS Performance Evaluation Review 33(1), 50 (2005)
- (70) S. García, M. Grill, J. Stiborek, A. Zunino, Computers & Security 45, 100 (2014). DOI https://doi.org/10.1016/j.cose.2014.05.011. URL https://www.sciencedirect.com/science/article/pii/S0167404814000923
- (71) R. Sommer, V. Paxson, in 2010 IEEE Symposium on Security and Privacy (2010), pp. 305–316. DOI 10.1109/SP.2010.25
- (72) S. Axelsson, Technical Report, Chalmers University (2000)
- (73) M. Tavallaee, E. Bagheri, W. Lu, A.A. Ghorbani, in 2009 IEEE Symposium on Computational Intelligence for Security and Defense Applications (2009), pp. 1–6. DOI 10.1109/CISDA.2009.5356528
- (74) M.A. Jabraeil Jamali, B. Bahrami, A. Heidari, P. Allahverdizadeh, F. Norouzi, M.A. Jabraeil Jamali, B. Bahrami, A. Heidari, P. Allahverdizadeh, F. Norouzi, Towards the Internet of Things: Architectures, Security, and Applications pp. 9–31 (2020)
- (75) F. Olivier, G. Carlos, N. Florent, Procedia Computer Science 52, 1028 (2015)
- (76) S.W. Azumah, N. Elsayed, V. Adewopo, Z.S. Zaghloul, C. Li, in 2021 IEEE 7th World Forum on Internet of Things (WF-IoT) (IEEE, 2021), pp. 836–841
- (77) H.F. Atlam, G.B. Wills, Digital twin technologies and smart cities pp. 123–149 (2020)
- (78) X. Li, Q. Wei, Z. Wu, W. Guo, in Proceedings of the 2023 2nd International Conference on Networks, Communications and Information Technology (ACM, Qinghai China, 2023), p. 35–41. DOI 10.1145/3605801.3605808. URL https://dl.acm.org/doi/10.1145/3605801.3605808
- (79) M. Conti, A. Dehghantanha, K. Franke, S. Watson, Future Generation Computer Systems 78, 544 (2018)
- (80) (Prentice Hall Professional Technical Reference, Upper Saddle River, N.J, 2005)
- (81) S.M. Specht, R.B. Lee, Proceedings of the International Workshop on Security in Parallel and Distributed Systems (2004)
- (82) J. Czyz, K. Allman, J. Zhang, E. Osterweil, M. Bailey, M. Karir, in Proceedings of the 2014 ACM Conference on Internet Measurement Conference (IMC) (2014)
- (83) M.J. Farooq, Q. Zhu, IEEE Transactions on Information Forensics and Security 14(9), 2412 (2019). DOI 10.1109/TIFS.2019.2898817
- (84) B. Bala, S. Behal, Computer science review 52, 100631 (2024)
- (85) S. Kaur, K. Kumar, N. Aggarwal, G. Singh, Computers & Security 110, 102423 (2021)
- (86) A. Sanmorino, H. Di Kesuma, Bulletin of Electrical Engineering and Informatics 13(2), 1362 (2024)
- (87) A. Sanmorino, L. Marnisah, H. Di Kesuma, Engineering, Technology & Applied Science Research 14(5), 16444 (2024)
- (88) A. Kachavimath, S. Vaishyar, A. Chugani, S. Joshi, S.A. More, G. Narayan, in International Conference on Data Science and Applications (Springer, 2025), pp. 13–23
- (89) G. Somani, M.S. Gaur, D. Sanghi, M. Conti, R. Buyya, Computer communications 107, 30 (2017)
- (90) X. Liu, Z. Tang, B. Yang, in 2019 IEEE 5th Intl Conference on Big Data Security on Cloud (BigDataSecurity), IEEE Intl Conference on High Performance and Smart Computing,(HPSC) and IEEE Intl Conference on Intelligent Data and Security (IDS) (IEEE, 2019), pp. 61–66
- (91) F. Hussain, S.G. Abbas, M. Husnain, U.U. Fayyaz, F. Shahzad, G.A. Shah, in 2020 IEEE 23rd International Multitopic Conference (INMIC) (IEEE, 2020), pp. 1–6
- (92) W. Liu, X. Liu, X. Di, H. Qi, in 2019 1st international conference on Industrial Artificial Intelligence (IAI) (IEEE, 2019), pp. 1–6
- (93) Z. Li, Z. Qin, K. Huang, X. Yang, S. Ye, in International conference on neural information processing (Springer, 2017), pp. 858–866
- (94) S. Klein, J.P. Pluim, M. Staring, M.A. Viergever, International journal of computer vision 81, 227 (2009)
- (95) E.M. Dogo, O. Afolabi, N. Nwulu, B. Twala, C. Aigbavboa, in 2018 international conference on computational techniques, electronics and mechanical systems (CTEMS) (IEEE, 2018), pp. 92–99