Calibration Is Not Enough: Evaluating Confidence Estimation Under Language Variations
Abstract
Confidence estimation (CE) indicates how reliable the answers of large language models are and impacts user trust and decision-making. Existing evaluations mainly concern the alignment between confidence and correctness, but ignore the variability of language: confidence estimates should remain consistent under semantically equivalent prompts or answer variations, while changing when answer meaning differs, as this may indicate a change in correctness. Therefore, we introduce a novel evaluation framework based on three complementary properties: robustness to prompt perturbations, stability across semantically equivalent answers, and sensitivity to semantically different answers. We show that these metrics are largely independent from existing CE metrics, and that common CE methods often fail on them: while most methods achieve high robustness and stability, they struggle to distinguish semantically different answers, potentially because they do not effectively leverage generation-side information. Overall, our framework exposes overlooked limitations of current CE evaluations and provides guidance for selecting confidence estimators for real-world applications.
Calibration Is Not Enough: Evaluating Confidence Estimation Under Language Variations
Yuxi Xia1,2, Dennis Ulmer3, Terra Blevins4, Yihong Liu5, Hinrich Schütze5, Benjamin Roth1,2 1Faculty of Computer Science, UniVie Doctoral School Computer Science, 2Faculty of Philological and Cultural Studies, University of Vienna, Austria 3ILLC, University of Amsterdam, Netherlands 4Khoury College of Computer Sciences, Northeastern University, USA 5LMU Munich, Munich Center for Machine Learning (MCML), Germany Correspondence: yuxi.xia@univie.ac.at
1 Introduction

Large Language Models (LLMs) are effective at answering fact-based questions across domains such as medicine, law, and education Alqahtani et al. (2023); Alfertshofer et al. (2024); Xiao et al. (2025). In these high-stakes settings, it is paramount to improve user trust and support safer human–AI interactions Kadavath et al. (2022); Zhang et al. (2024) to avoid harm and achieve positive outcomes. To this end, confidence estimation (CE; Kadavath et al., 2023; Tian et al., 2023; Chen and Mueller, 2024) can help by indicating how certain and therefore reliable a model’s answer is.
Existing works on CE Guo et al. (2017); Osawa et al. (2019); Ovadia et al. (2019); Groot and Valdenegro - Toro (2024); Ni et al. (2025); Xiong et al. (2024) mainly focus on evaluating calibration (whether stated confidences match expected model accuracy), or discrimination (whether it ranks right answers higher than wrong ones). This overlooks a key property of language (models): Language is extremely variable, and while the surface form, i.e. a particular choice of words, might change, the meaning of an expression can stay untouched (Baan et al., 2023). However, a method may be well-calibrated yet produce confidence values that fluctuate under minor prompt variations Sclar et al. (2024); Xia et al. (2025a), or fail to adapt to answers with different surface forms and / or meanings, as we exemplify in Figure˜1.
This paper presents a novel evaluation paradigm for LLM CE methods that takes language variation into account, including three novel dimensions: Robustness (P-RB) measures whether CE methods can ignore semantically irrelevant changes to the prompt and output the same confidence score. Stability (A-STB) requires CE methods to assign consistent confidences to semantically equivalent answers, and sensitivity (A-SST) measures whether confidence estimates change accordingly when the answer meaning changes. In summary, we make four main contributions: (1) we propose three novel and complementary metrics that go beyond calibration to evaluate CE methods under realistic language variation; (2) we conduct a large-scale evaluation of 10 diverse CE methods across 11 LLMs from five model families; (3) we show empirically that while most confidence estimators are robust and stable, they exhibit a striking lack of sensitivity, potentially because generation-side information is not effectively utilized; (4) we provide practical guidance on selecting confidence estimators for target applications and open-source the code.111Code will be made available upon acceptance.
2 Related Work
Confidence Estimation in LLMs.
CE has emerged as a crucial research direction for improving user trust and model interpretability (Tian et al., 2023; Chen et al., 2024b). Currently, there are 5 common approaches Geng et al. (2024); Shorinwa et al. (2025); Vashurin et al. (2025); Testoni and Calixto (2026) to estimate LLM confidence: (1) logit-based, such as token-level probability Zhu et al. (2023); Huang et al. (2025); (2) linguistic confidence Lin et al. (2022); Xiong et al. (2024); Ulmer et al. (2025), which elicits verbalized confidence directly from the model; (3) auxiliary-based methods Ulmer et al. (2024); Xia et al. (2025a); Zhu et al. (2026), which employ an auxiliary model trained to predict the confidence of a target LLM based on answer content and predicted correctness; (4) internal states-based, Sriramanan et al. (2024) derive model uncertainty from attention heads, other methods (Liu et al., 2024; Burns et al., 2023; Kadavath et al., 2022) train probes which comprise smaller, often linear classifiers on internal model representations. Lastly, (5) consistency-based methods (Lin et al., 2024; Manakul et al., 2023; Xiong et al., 2024) rely on multiple stochastic generations obtained by prompting the LLM with loose temperatures and diverse prompts. Confidence is then estimated based on the similarity or frequency of the generated outputs. Since our proposed metrics themselves rely on comparing the confidence of multiple different responses under perturbation, consistency-based methods are not applicable in our framework.
Evaluation of Confidence Estimators.
LLMs are typically evaluated using task-level metrics (Le Bronnec et al., 2024; Moe et al., 2025; Xia et al., 2025b), which are not suitable for CE methods. Instead, calibration metrics, including ECE (Guo et al., 2017) and its variants (Kumar et al., 2019; Nixon et al., 2019; Kirchenbauer et al., 2022; Błasiok and Nakkiran, 2024), and Brier score (Brier, 1950), are used to measure the alignment between predicted confidence and actual correctness (Groot and Valdenegro - Toro, 2024; Zhou et al., 2024; Stengel-Eskin and Durme, 2023). Ranking-based metrics such as AUROC and AUPRC (Bradley, 1997) further evaluate whether CE methods can distinguish correct from incorrect responses (Vazhentsev et al., 2022; Tian et al., 2023; Ulmer et al., 2024), in-distribution from out-of-distribution inputs (Ovadia et al., 2019; Charpentier et al., 2020; Ulmer et al., 2022), or whether loss correlates with decreased confidence (Ulmer et al., 2022). However, existing metrics do not assess the robustness of CE methods to prompt perturbations, as studied for LLM outputs, for instance by ProSA (Zhuo et al., 2024), or their ability to distinguish between (dis)similar responses.
3 Background
Notation.
We use to denote an input sequence, for a language model prompt, and for a model response. We write for the intended or correct response, and in cases where there are multiple correct responses, we denote the corresponding set by . Then, we write a confidence estimator as a function that predicts a confidence value conditioned on , and , written .222So e.g. for sequence likelihood, involves passing , to the LLM to obtain token probabilities. For e.g. an auxiliary model, , can be directly equated with the secondary model.
3.1 Preliminaries
One common metric for evaluating CE is the expected calibration error Guo et al. (2017):
| (1) |
where the expectation is typically approximated by binning test predictions into buckets of equal size by their predicted confidence. The ECE has been criticized for not being a proper scoring rule, i.e. trivial predictors other than the true distribution can minimize it (Liu et al., 2023). An actual proper scoring rule is the Brier score Brier (1950):
| (2) |
Both ECE and Brier score evaluate whether the confidence score aligns with (expected) correctness. However, one might also be interested in whether confidence helps us to distinguish between correct and incorrect predictions. This is commonly evaluated through the area under the receiver-operating characteristic curve (AUROC; Bradley, 1997), where error detection is framed as a binary classification task, and the ratio of the true to false positive rate is measured under all possible thresholds. However, none of these metrics incorporates the variability of natural language.
3.2 An Illustrative Example
To intuitively demonstrate why global calibration metrics fail to catch localized insensitivity to language, we construct a controlled simulation evaluating a baseline that completely ignores answer text. For each out of samples, we obtain generations each. We sample “difficulty” for every and simulate answer correctness of each by , such that higher tend to result in a smaller chance to be correct. We now define confidence estimators, namely an oracle which returns the actual correctness: ; a constant estimator predicts the difficulty per input, ignoring the generation and its correctness. Similarly, a prior estimator stoically estimates the expected difficulty across the whole dataset s.t. . Lastly, a random estimator independently samples a confidence of or from the same distribution as .
| ECE | Brier | AUROC | A-STB | A-SST | |
|---|---|---|---|---|---|
| 0.00 | 0.00 | 1.00 | 1.00 | 1.00 | |
| 0.01 | 0.17 | 0.83 | 1.00 | 0.00 | |
| 0.33 | 0.33 | 0.67 | 0.72 | 0.18 | |
| 0.00 | 0.25 | 0.50 | 1.00 | 0.00 |
Results.
We run a simulation with and and show the results in Table˜1.333For the metrics introduced in Section 4, we assume that with the same have the same meaning. Unsurprisingly, achieves perfect results, and the scores above-chance AUROC, but with the worst calibration. The scores perfect ECE, a relatively low Brier score of and an AUROC of . shows random-chance AUROC due to only predicting a single value, but reaches perfect ECE and a Brier score of , demonstrating that ECE is not a proper scoring rule. Although these predictors are deliberately simplified, the implications for LLM CE are staggering: A random baseline that predicts and according to answer difficulty alone can achieve above-random AUROC, but more importantly, , which predicts question difficulty alone and ignores any information from answers, can perform well in both calibration and discrimination. A CE method that behaves randomly or that predicts the same confidence, both independently of the actual answer, is uninformative in a practical setting. There are also two extremes that motivate our novel metrics: Stability (STB) measures whether an estimator predicts the same confidence for semantically equivalent answers, while sensitivity (SST) captures whether an estimator changes its prediction upon encountering a different answer.

4 Methodology
We investigate whether estimated confidences are reliable based on three qualities: robustness ensures that the estimated confidence is robust towards irrelevant prompt perturbations; stability and sensitivity quantify how much the CE methods respond to semantically (dis)similar answers. The computation of all metrics is visualized in Figure˜2.
4.1 Robustness Under Prompt Perturbation
Motivation.
Prompt formatting is known to influence LLM outputs (Min et al., 2022; Wang et al., 2023; Sclar et al., 2024; Feng et al., 2024), and Xia et al. (2025a) shows that it can affect the performance of CE methods. In practice, prompts are often modified across applications and users. However, while works on verbalized confidence (e.g. Tian et al., 2023; Xiong et al., 2024) have varied prompt formats, the robustness of other confidence estimators has not been systematically examined. We propose that an ideal CE method should provide consistent confidences when prompts are altered, but responses stay the same: To isolate prompt variance from generation noise, Robustness is measured by holding the generated response constant while perturbing the instruction format.
Definition 4.1 (Robustness).
Let be a set of semantically equivalent prompts. A confidence estimator is robust to prompt perturbations iff
Robustness Metric (P-RB).
In practice, we measure robustness given a prompt set , assuming a “default” prompt . We use a semantic equivalence operation (Kuhn et al., 2023)444While Kuhn et al. (2023) use a bi-directional entailment classifier to determine semantic equivalence, we use LLM-as-a-judge with the prompt in Section C.2. to identify the set of all answers that are equivalent to the answer using . Thus, given , we define an index set . Robustness is then computed by measuring the standard deviation of scores across prompts producing equivalent answers and averaging across samples:
|
|
(3) |
with needed for Definition˜4.1 to hold (see Appendix˜A).
4.2 Stability and Sensitivity Under Answer Variation
Motivation.
Setting aside different prompts, LLMs already produce a variety of responses when using stochastic decoding.
A confidence estimator should incorporate answer semantics:
If the semantics remain unchanged, so should its expected correctness, and thus its confidence.
If the answer differs in meaning, the confidence should be adjusted accordingly.
As we saw in Section˜3.2, a constant predictor can be well-calibrated, but is unreliable by ignoring semantic changes.
Conversely, a random predictor is sensitive (since the confidence is random each time), but lacks stability when meaning stays constant.
To define these notions more formally, let us again have a set of generated responses for a given input and a (single) prompt . Then, given some predicted answer , we can define . Now we can outline two new desiderata in the face of answer variation: To evaluate how an estimator handles generation-side variance alone, we freeze the prompt and analyze stochastically sampled outputs.
Definition 4.2 (Stability).
Let be one out of responses given a prompt , and a set of semantically equivalent responses to . Then, a confidence estimator is stable iff
From this, we define the complementary notion of sensitivity, namely that semantically different answers should receive different scores:
Definition 4.3 (Sensitivity).
Let be a finite partition of s.t. and . Then, given an input , prompt a set of semantically equivalent responses , a confidence estimator is sensitive iff
Stability Metric (A-STB).
Practically, we do not check all sets , but just restrict ourselves to the most meaningful ones: For each sample, the largest set of answers is denoted as , while the set with the fewest ones is . We then again compute the standard deviation over confidence scores among semantically equivalent answers in over data points:
|
|
(4) |
Applying the same argument as for robustness, we show in Appendix˜A that must hold for Definition˜4.2.
Sensitivity Metric (A-SST)
To quantify how effectively a confidence estimator distinguishes semantically different answers relative to semantically equivalent ones, we compute
|
|
(5) |
where, using as a shorthand,
| (6) |
When the confidence estimator is both stable and sensitive according to Definitions˜4.2 and 4.3, then this metric is bounded by , as we derive in Appendix˜A. A high value of indicates that the score differences between semantically different answers are larger than among equivalent answers, and the confidence estimator is therefore sensitive. It should be noted that our metrics do not require any information about the correctness of a response, in contrast to other common metrics in Figure˜3. This is especially attractive in cases where automated correctness judgments are expensive, difficult or noisy, e.g. ambiguous questions (Min et al., 2020) or time-sensitive questions (Pletenev et al., 2025).

5 Experiments
In our experiments section, we aim to answer the following three research questions:
RQ1:
How do our proposed metrics relate to established metrics for the evaluation of confidence estimators? Do they measure something different?
RQ2:
RQ3:
Combining all metrics, which confidence estimators perform best across different model families and datasets?
5.1 Setup
Our experiments are conducted on an aggregation of four question answering datasets and nine LLMs across different model families and sizes.
Evaluated Methods.
We benchmark 10 CE methods across 4 categories: (1) Output logit-based: Sequence likelihood (Seq. Likelihood) aggregates the token probabilities of the generated answer. Platt Scaling (Platt, 1999) learns a scale and shift scalar to calibrate sequence likelihood (in our case on the training set). Boosted Prob. by Dinh and Niehues (2025) identifies dominant token probabilities in the output sequence. P(True) prompts the LLMs to judge if the response is true, and uses the normalized probability of the “True” token Kadavath et al. (2022). (2) Linguistic features: Verbalized Conf. (Tian et al., 2023; Xiong et al., 2024) prompts the LLM to state how certain it is about its answer. (3) Auxiliary models: Calib-1-Focal (Calib1) trains an auxiliary classifier (Ulmer et al., 2024; Xia et al., 2025a), uses response correctness as training targets. (4) Internal states-based: Attention Score and Hidden Score (Sriramanan et al., 2024) are derived from the mean log-determinant of attention heads and hidden representations, respectively; P(IK) (Kadavath et al., 2022) and SAPLMA (Azaria and Mitchell, 2023) train probe classifiers on last-layer hidden states from different token positions. Implementation details are in Section˜C.4.
Datasets.
We test on four open-ended question-answering benchmarks covering diverse topics. They include 2,000 randomly sampled training examples each from Natural Questions (NQ; Kwiatkowski et al., 2019), SciQ Welbl et al. (2017), TriviaQA Joshi et al. (2017), and PopQA Mallen et al. (2023). All methods are evaluated on 1,000 randomly sampled test questions each.
LLMs.
We evaluate 11 LLMs spanning five major families, including Mistral (Mistral AI, 2024, 2025), Llama 3 (Meta AI, 2024), Qwen 2.5 (Yang et al., 2024b), OLMo 2 (Team OLMo et al., 2024) and GPT-4o (OpenAI, 2024) models, whose known sizes range from 7B to 123B and include both instruction and reasoning models. More details are given in Section˜C.3.
Experimental Design.
For measuring prompt robustness, we use greedy decoding to ensure that any variability is solely driven by prompt perturbations, for which we test the variants shown in Table˜17 (Section˜C.1). To not introduce ambiguity, we keep the question fixed and perturb only the instructions. Variants include forms such as “answer the question” and “provide an answer to the question.” Each prompt also enforces conciseness, with phrases like “give ONLY the answer,” “no other words or explanation,” etc. For stability and sensitivity, we set the model temperature to 0.7 to generate sampled answers.
5.2 Comparing Evaluation Metrics

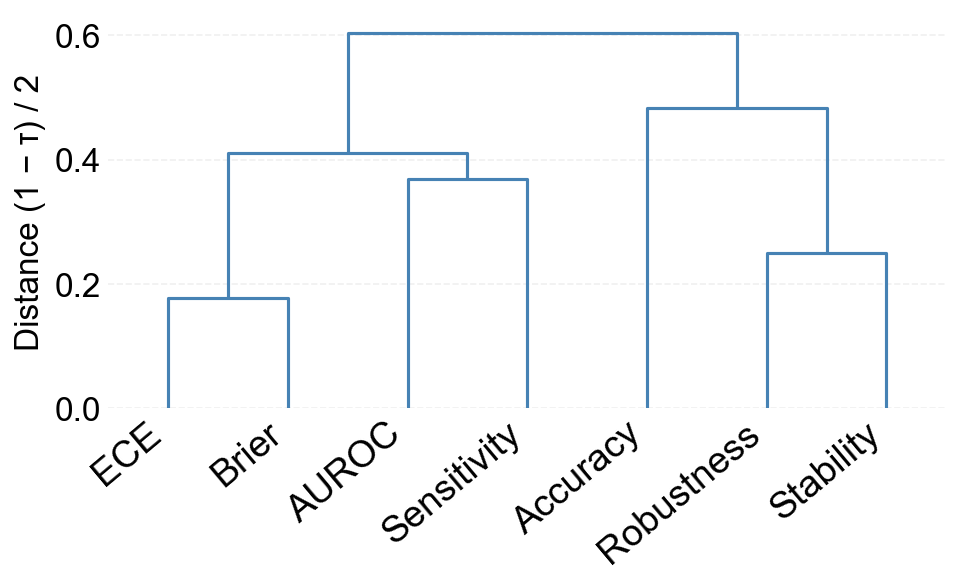
We first compare the similarity of CE evaluation metrics by pooling results across models and confidence estimators, computing Kendall’s (Kendall, 1938) correlation coefficient between them, and then averaging the result across our four datasets. We then run hierarchical clustering over the results, treating correlation (as ) as a distance measure to identify closely related metrics.

| SciQ | PopQA | ||||||||||||
| Method | ECE | Brier | AUROC | P-RB | A-STB | A-SST | ECE | Brier | AUROC | P-RB | A-STB | A-SST | |
| Logit-based | Seq. Likelihood | ||||||||||||
| Boosted Prob. | |||||||||||||
| Platt Scaling | |||||||||||||
| P(True) | |||||||||||||
| Internal States | Attention Score | ||||||||||||
| Hidden Score | |||||||||||||
| SAPLMA | |||||||||||||
| P(IK) | |||||||||||||
| Ling. | Verbalized Conf. | ||||||||||||
| Aux. | Calib1 | ||||||||||||
Results.
Figure˜4(a) shows only mild correlation between our and established metrics: We find a for sensitivity and AUROC, which is much lower than e.g. between Brier score and ECE. In contrast, our metrics’ correlation coefficients with each other range from to . Interestingly, no metric has a meaningful correlation with accuracy. Using the hierarchical clustering in Figure˜4(b), we can further observe that robustness and stability are clustered together, albeit their similarity is still trumped by ECE and Brier score; sensitivity remains grouped with AUROC. In Figure˜8 in Section˜B.3, we plot metric distributions, showing strongly skewed results for robustness and stability on all datasets, contrasted by an overall lack of sensitivity, all the while distributions appear very distinct from ECE, AUROC, and Brier score. Addressing RQ1, we take this as evidence that our metrics measure novel and so-far overlooked properties of confidence estimators.
5.3 Scaling Laws for Confidence Estimates
Prior literature has repeatedly shown that larger models tend to be better calibrated (Ahuja et al., 2022; Zhu et al., 2023; Xiong et al., 2024; Tao et al., 2025). To test whether the same is true for our metrics, we plot the distribution of metric scores per model across datasets and CE methods, using parameter size in billions as a reference point.555We remove Calib1 since it uses an auxiliary model. Since metric score distributions differ between confidence estimators and datasets, we apply -score normalization across measurements for the same CE method and dataset from the same model family. This isolates the general improvement of metric scores, even if dataset difficulty and the performance of specific CE methods differ.
Results.
We show trends for our metrics in Figure˜5, demonstrating a mild improvement with model size.666Figure 9 (Section B.4) shows the plots for ECE, Brier score, and AUROC, where we mostly corroborate existing findings. The weaker improvements with scale do not contradict prior work, since often only specific estimators such as token/sequence likelihood (Zhu et al., 2023; Tao et al., 2025) or verb. confidence (Kadavath et al., 2022) are considered. This trend by estimator is often inconsistent depending on the type of method and model, as we show in more detailed graphs in Figure˜10 in Section˜B.4. For RQ2, scaling may improve confidence quality with respect to language variation; however, the substantial differences across estimators and models highlight the need for careful evaluation in practical settings.

5.4 Comparing Confidence Estimators
To test whether any confidence estimators reign supreme across all models and datasets, we first analyze the evaluation results per metric and dataset, averaged across models. For each CE method, we then compute the mean reciprocal rank (MRR), where means that it outperformed all others.
Results.
Table˜2 shows the result for SciQ and PopQA, with the remaining dataset results shown in Table˜3 in Section˜B.1. Overall, no method outperforms any other on all metrics. Well-calibrated methods also seem to struggle with sensitivity and vice versa. At the same time, while all confidence estimator scores high on robustness (P-RB) and stability (A-SST), most fail on sensitivity (A-SST). By overall MRR, as shown in Figure˜6 across all datasets and in Figure˜11 in Section˜B.5 per dataset, achieves the best overall MRR, but with low ranking on robustness and sensitivity. Regarding RQ3, this highlights that the choice of the best CE method will be highly dependent on the specific dataset, model, and other constraints, such as different priorities of certain metrics.
5.5 Why Is Sensitivity So Low?
In the previous section, we found that almost all CE methods scored high on robustness and stability, but very low on sensitivity. This means that in practice, confidence estimates fail to adapt to semantically different responses. This is worrying, since a different response likely also implies a change in output quality or correctness, and therefore a miscalibrated confidence. To investigate this phenomenon, we display specific responses in detail (see Tables˜6, 7 and 8 in Section˜B.6). We hypothesize that CE methods leveraging information closer to the response generation exhibit higher sensitivity to answer changes. Estimators trained solely on the question’s final token (like ) are inherently blind to the generated text, resulting in low sensitivity; in contrast, methods evaluating the response’s final token (like SAPLMA) achieve much higher sensitivity. Similarly, methods that directly rely on output logits without post-hoc scaling, such as sequence likelihood and P(True), tend to be more sensitive to changes in the generated answer, as shown by the rankings in Figure˜6. This aligns with results by Eusebi et al. (2026), showing that correctness information is incrementally encoded during generations.
6 Discussion
Since our results in Section˜5.4 found no universally superior confidence estimator, the choice of method depends on the target application, as different settings require trade-offs between robustness, stability, and sensitivity. For instance, user-facing QA systems prioritize robustness to maintain consistent abstention behavior under evolving prompts. In contrast, multi-candidate reranking settings, such as LLM-as-a-judge (Wagner et al., 2024; Jung et al., 2025) or reward models (Yang et al., 2024a), rely more on stability and sensitivity to assess competing responses. Conditional computation and model cascades (Gupta et al., 2024) emphasize sensitivity to detect low-confidence predictions for escalation to stronger models. Multi-agent collaboration (Chen et al., 2024a; Yang et al., 2024c) requires balancing all three properties, while in controlled environments with fixed prompts and limited answer variation, traditional calibration metrics are sufficient. Importantly, however, the observed lack of sensitivity across all confidence estimators implies that methods should better exploit relevant information across generation time steps (Eusebi et al., 2026) and model components (Shelmanov et al., 2025).
7 Conclusion
We introduced three novel complementary metrics (robustness, stability and sensitivity) to evaluate whether confidence estimates remain reliable under language variation. Our results show that these metrics are largely independent of traditional CE metrics for calibration, suggesting that existing evaluations capture only a limited view of confidence quality. While most CE methods achieve high calibration, robustness and stability, they remain insensitive to changes in answer meaning. This raises concerns for downstream applications such as multi-candidate reranking. We further show that scaling alone does not resolve this issue, and our findings suggest that incorporating more answer-side information may improve sensitivity. As no CE method consistently dominates, we highlight fundamental trade-offs between these metrics, suggesting that the “best” confidence estimator depends strongly on the target application.
Limitations
While our study provides a comprehensive evaluation of LLM confidence estimation across robustness, stability, sensitivity, calibration, and discrimination, several limitations remain.
First, our analysis is limited to English and fact-based question answering tasks; extending to multilingual or open-ended domains (e.g., reasoning, dialogue, multi-choice, or creative generation) may reveal different findings. Second, although we designed a diverse set of prompting strategies, they do not exhaustively capture all linguistic and contextual variations that may influence confidence expression. In particular, it remains challenging to construct more aggressive prompt perturbations that preserve identical semantic meaning and avoid ambiguity across all questions and datasets. Third, part of our evaluation relies on GPT-4o as a judge model to assess answer correctness and semantic equivalence. While this enables scalable annotation, it may introduce model-specific biases (Bavaresco et al., 2025). Fourth, we do not include consistency-based confidence estimation methods, since our metrics themselves rely on multiple samples to be computed, and are therefore incompatible with self-consistency. Consistency-based methods are not naturally superior on our metrics; for instance, they could easily assign the same confidence score to two semantically different answers appearing at the same frequency in the sampling pool. In the end, our contribution is not comprehensively benchmark all existing CE methods, but to instead highlight overlooked aspects regarding language variation using our proposed metrics. Finally, our evaluation is static; future work could explore dynamic or interactive settings where models can revise their confidence based on feedback or uncertainty cues.
Acknowledgments
This research has been funded by the Vienna Science and Technology Fund (WWTF)[10.47379/VRG19008] “Knowledge infused Deep Learning for Natural Language Processing”, and is supported by the Dutch National Science Foundation (NWO Vici VI.C.212.053).
References
- On the calibration of massively multilingual language models. In Proceedings of the 2022 Conference on Empirical Methods in Natural Language Processing, pp. 4310–4323. Cited by: §5.3.
- Sailing the seven seas: a multinational comparison of chatgpt’s performance on medical licensing examinations. Annals of Biomedical Engineering 52 (6), pp. 1542–1545. External Links: Link Cited by: §1.
- The emergent role of artificial intelligence, natural learning processing, and large language models in higher education and research. Research in social and administrative pharmacy 19 (8), pp. 1236–1242. External Links: Link Cited by: §1.
- The internal state of an LLM knows when it’s lying. In Findings of the Association for Computational Linguistics: EMNLP 2023, H. Bouamor, J. Pino, and K. Bali (Eds.), Singapore, pp. 967–976. External Links: Link, Document Cited by: 9th item, §5.1.
- Uncertainty in natural language generation: from theory to applications. arXiv preprint arXiv:2307.15703. External Links: Link Cited by: §1.
- Llms instead of human judges? a large scale empirical study across 20 nlp evaluation tasks. In Proceedings of the 63rd Annual Meeting of the Association for Computational Linguistics (Volume 2: Short Papers), pp. 238–255. Cited by: Limitations.
- Smooth ECE: principled reliability diagrams via kernel smoothing. In The Twelfth International Conference on Learning Representations, External Links: Link Cited by: §2.
- The use of the area under the roc curve in the evaluation of machine learning algorithms. Pattern Recognition 30 (7), pp. 1145–1159. External Links: ISSN 0031-3203, Document, Link Cited by: §2, §3.1.
- Verification of forecasts expressed in terms of probability. Monthly Weather Review 78 (1), pp. 1 – 3. External Links: Document, Link Cited by: §2, §3.1.
- Discovering latent knowledge in language models without supervision. In The Eleventh International Conference on Learning Representations, External Links: Link Cited by: §2.
- Posterior network: uncertainty estimation without ood samples via density-based pseudo-counts. Advances in neural information processing systems 33, pp. 1356–1367. External Links: Link Cited by: §2.
- Quantifying uncertainty in answers from any language model and enhancing their trustworthiness. In Proceedings of the 62nd Annual Meeting of the Association for Computational Linguistics (Volume 1: Long Papers), L. Ku, A. Martins, and V. Srikumar (Eds.), Bangkok, Thailand, pp. 5186–5200. External Links: Link, Document Cited by: §1.
- Reconcile: round-table conference improves reasoning via consensus among diverse llms. In Proceedings of the 62nd Annual Meeting of the Association for Computational Linguistics (Volume 1: Long Papers), pp. 7066–7085. Cited by: §6.
- Quantifying and mitigating unimodal biases in multimodal large language models: a causal perspective. In Findings of the Association for Computational Linguistics: EMNLP 2024, Y. Al-Onaizan, M. Bansal, and Y. Chen (Eds.), Miami, Florida, USA, pp. 16449–16469. External Links: Link, Document Cited by: §2.
- On the effects of transformer size on in-and out-of-domain calibration. In Findings of the Association for Computational Linguistics: EMNLP 2021, pp. 2096–2101. Cited by: §5.
- Are generative models underconfident? better quality estimation with boosted model probability. In Proceedings of the 2025 Conference on Empirical Methods in Natural Language Processing, C. Christodoulopoulos, T. Chakraborty, C. Rose, and V. Peng (Eds.), Suzhou, China, pp. 3364–3382. External Links: Link, Document, ISBN 979-8-89176-332-6 Cited by: 2nd item, §5.1.
- Reading calibrated uncertainty from language model trajectories. External Links: 2605.22864, Link Cited by: §5.5, §6.
- Perception of probability words. Note: Manuscript, University of Illinois Urbana-Champaign External Links: Link Cited by: §B.8.
- Unveiling and manipulating prompt influence in large language models. In \texttoblueThe Twelfth International Conference on Learning Representations, ICLR 2024, Vienna, Austria, May 7-11, 2024, External Links: Link Cited by: §4.1.
- A survey of confidence estimation and calibration in large language models. In Proceedings of the 2024 Conference of the North American Chapter of the Association for Computational Linguistics: Human Language Technologies (Volume 1: Long Papers), K. Duh, H. Gomez, and S. Bethard (Eds.), Mexico City, Mexico, pp. 6577–6595. External Links: Link, Document Cited by: §2.
- Overconfidence is key: verbalized uncertainty evaluation in large language and vision-language models. In Proceedings of the 4th Workshop on Trustworthy Natural Language Processing (TrustNLP 2024), A. Ovalle, K. Chang, Y. T. Cao, N. Mehrabi, J. Zhao, A. Galstyan, J. Dhamala, A. Kumar, and R. Gupta (Eds.), Mexico City, Mexico, pp. 145–171. External Links: Link, Document Cited by: §1, §2.
- On calibration of modern neural networks. In Proceedings of the 34th International Conference on Machine Learning - Volume 70, ICML’17, pp. 1321–1330. Cited by: §1, §2, §3.1.
- Language model cascades: token-level uncertainty and beyond. arXiv preprint arXiv:2404.10136. Cited by: §6.
- Look before you leap: an exploratory study of uncertainty analysis for large language models. IEEE Transactions on Software Engineering 51 (2), pp. 413–429. External Links: ISSN 2326-3881, Link, Document Cited by: §2.
- TriviaQA: a large scale distantly supervised challenge dataset for reading comprehension. In Proceedings of the 55th Annual Meeting of the Association for Computational Linguistics (Volume 1: Long Papers), pp. 1601–1611. Cited by: §5.1.
- Trust or escalate: llm judges with provable guarantees for human agreement. In International Conference on Learning Representations, Vol. 2025, pp. 3101–3125. Cited by: §6.
- Prompting GPT-3 to be reliable. In Proceedings of the 11th International Conference on Learning Representations (ICLR), External Links: Link Cited by: §1.
- Language models (mostly) know what they know. External Links: 2207.05221 Cited by: 10th item, 4th item, §1, §2, §5, §5.1, footnote 6.
- A new measure of rank correlation. Biometrika 30 (1-2), pp. 81–93. Cited by: §5.2.
- What Is Your Metric Telling You? Evaluating Classifier Calibration under Context-specific Definitions of Reliability. ArXiv preprint abs/2205.11454. External Links: Link Cited by: §2.
- Semantic uncertainty: linguistic invariances for uncertainty estimation in natural language generation. In Proceedings of the 11th International Conference on Learning Representations (ICLR), External Links: Link Cited by: §4.1, footnote 4.
- Verified Uncertainty Calibration. In Advances in Neural Information Processing Systems 32: Annual Conference on Neural Information Processing Systems 2019, NeurIPS 2019, December 8-14, 2019, Vancouver, BC, Canada, H. M. Wallach, H. Larochelle, A. Beygelzimer, F. d’Alché-Buc, E. B. Fox, and R. Garnett (Eds.), pp. 3787–3798. External Links: Link Cited by: §2.
- Natural questions: a benchmark for question answering research. Transactions of the Association for Computational Linguistics 7, pp. 453–466. Cited by: §5.1.
- Exploring precision and recall to assess the quality and diversity of LLMs. In Proceedings of the 62nd Annual Meeting of the Association for Computational Linguistics (Volume 1: Long Papers), L. Ku, A. Martins, and V. Srikumar (Eds.), Bangkok, Thailand, pp. 11418–11441. External Links: Link, Document Cited by: §2.
- Teaching models to express their uncertainty in words. Transactions on Machine Learning Research. Note: External Links: ISSN 2835-8856, Link Cited by: §2.
- Generating with confidence: uncertainty quantification for black-box large language models. Transactions on Machine Learning Research. Note: External Links: ISSN 2835-8856, Link Cited by: §2.
- A simple approach to improve single-model deep uncertainty via distance-awareness. Journal of Machine Learning Research 24 (42), pp. 1–63. Cited by: §3.1.
- LitCab: lightweight language model calibration over short- and long-form responses. In Proceedings of the Twelfth International Conference on Learning Representations, External Links: Link Cited by: §2.
- When not to trust language models: investigating effectiveness of parametric and non-parametric memories. In Proceedings of the 61st Annual Meeting of the Association for Computational Linguistics (Volume 1: Long Papers), A. Rogers, J. Boyd-Graber, and N. Okazaki (Eds.), Toronto, Canada, pp. 9802–9822. External Links: Link, Document Cited by: §5.1.
- SelfCheckGPT: zero-resource black-box hallucination detection for generative large language models. External Links: 2303.08896 Cited by: §2.
- Introducing meta llama 3: the most capable openly available llm to date. Note: Accessed: 2025-05-01 External Links: Link Cited by: 2nd item, §5.1.
- Rethinking the role of demonstrations: what makes in-context learning work?. In Proceedings of the 2022 Conference on Empirical Methods in Natural Language Processing, pp. 11048–11064. Cited by: §4.1.
- AmbigQA: answering ambiguous open-domain questions. In Proceedings of the 2020 Conference on Empirical Methods in Natural Language Processing (EMNLP), B. Webber, T. Cohn, Y. He, and Y. Liu (Eds.), Online, pp. 5783–5797. External Links: Link, Document Cited by: §4.2.
- Revisiting the calibration of modern neural networks. Advances in neural information processing systems 34, pp. 15682–15694. Cited by: §5.
- Mistral large instruct 2411. Note: Accessed: 2025-05-01 External Links: Link Cited by: 1st item, §5.1.
- Ministral-3-8b-reasoning-2512. Note: https://huggingface.co/mistralai/Ministral-3-8B-Reasoning-2512Hugging Face model card, accessed 2026-05-22 Cited by: 1st item, §5.1.
- Mitigating class imbalance in fact-checking datasets through llm-based synthetic data generation. In Proceedings of the 4th ACM International Workshop on Multimedia AI against Disinformation, MAD’ 25, New York, NY, USA, pp. 73–80. External Links: ISBN 9798400718915, Link, Document Cited by: §2.
- Calibrating deep neural networks using focal loss. Advances in Neural Information Processing Systems 33, pp. 15288–15299. Cited by: 5th item.
- Are large language models more honest in their probabilistic or verbalized confidence?. In Information Retrieval, X. He, Z. Ren, and R. Tang (Eds.), Singapore, pp. 124–135. External Links: ISBN 978-981-96-1710-4 Cited by: §1.
- Measuring Calibration in Deep Learning. In IEEE Conference on Computer Vision and Pattern Recognition Workshops, CVPR Workshops 2019, Long Beach, CA, USA, June 16-20, 2019, pp. 38–41. Cited by: §2.
- Hello gpt-4o. Note: Accessed: 2025-05-01 External Links: Link Cited by: 5th item, §5.1.
- Practical deep learning with bayesian principles. Advances in neural information processing systems 32. Cited by: §1.
- Can you trust your model’s uncertainty? evaluating predictive uncertainty under dataset shift. Advances in neural information processing systems 32. Cited by: §1, §2.
- Probabilistic outputs for support vector machines and comparisons to regularized likelihood methods. Advances in Large Margin Classifiers 10 (3), pp. 61–74. Cited by: 3rd item, §5.1.
- Will it still be true tomorrow? multilingual evergreen question classification to improve trustworthy QA. In Proceedings of the 2025 Conference on Empirical Methods in Natural Language Processing, C. Christodoulopoulos, T. Chakraborty, C. Rose, and V. Peng (Eds.), Suzhou, China, pp. 8603–8620. External Links: Link, Document, ISBN 979-8-89176-332-6 Cited by: §4.2.
- Quantifying language models’ sensitivity to spurious features in prompt design or: how I learned to start worrying about prompt formatting. In \texttoblueThe Twelfth International Conference on Learning Representations, ICLR 2024, Vienna, Austria, May 7-11, 2024, External Links: Link Cited by: §1, §4.1.
- A head to predict and a head to question: pre-trained uncertainty quantification heads for hallucination detection in llm outputs. In Proceedings of the 2025 Conference on Empirical Methods in Natural Language Processing, pp. 35700–35719. Cited by: §6.
- A survey on uncertainty quantification of large language models: taxonomy, open research challenges, and future directions. ACM Comput. Surv. 58 (3). External Links: ISSN 0360-0300, Link, Document Cited by: §2.
- LLM-check: investigating detection of hallucinations in large language models. In Advances in Neural Information Processing Systems, A. Globerson, L. Mackey, D. Belgrave, A. Fan, U. Paquet, J. Tomczak, and C. Zhang (Eds.), Vol. 37, pp. 34188–34216. External Links: Document, Link Cited by: 7th item, 8th item, §2, §5.1.
- Calibrated interpretation: confidence estimation in semantic parsing. External Links: 2211.07443 Cited by: §2.
- Revisiting uncertainty estimation and calibration of large language models. arXiv preprint arXiv:2505.23854. Cited by: §5, §5.3, footnote 6.
- 2 olmo 2 furious. arXiv preprint arXiv:2501.00656. External Links: Link Cited by: 4th item, §5.1.
- Mind the gap: benchmarking LLM uncertainty and calibration with specialty-aware clinical QA and reasoning-based behavioural features. In Proceedings of the 19th Conference of the European Chapter of the Association for Computational Linguistics (Volume 1: Long Papers), V. Demberg, K. Inui, and L. Marquez (Eds.), Rabat, Morocco, pp. 2364–2382. External Links: Link, Document, ISBN 979-8-89176-380-7 Cited by: §2.
- Just ask for calibration: strategies for eliciting calibrated confidence scores from language models fine-tuned with human feedback. In Proceedings of the 2023 Conference on Empirical Methods in Natural Language Processing, H. Bouamor, J. Pino, and K. Bali (Eds.), Singapore, pp. 5433–5442. External Links: Link, Document Cited by: §B.8, §B.8, 6th item, §1, §2, §2, §4.1, §5.1.
- Exploring predictive uncertainty and calibration in NLP: a study on the impact of method & data scarcity. In Findings of the Association for Computational Linguistics: EMNLP 2022, Y. Goldberg, Z. Kozareva, and Y. Zhang (Eds.), Abu Dhabi, United Arab Emirates, pp. 2707–2735. External Links: Link, Document Cited by: §2.
- Calibrating large language models using their generations only. In Proceedings of the 62nd Annual Meeting of the Association for Computational Linguistics (Volume 1: Long Papers), L. Ku, A. Martins, and V. Srikumar (Eds.), Bangkok, Thailand, pp. 15440–15459. External Links: Link, Document Cited by: §2, §2, §5.1.
- Anthropomimetic uncertainty: what verbalized uncertainty in language models is missing. arXiv preprint arXiv:2507.10587. Cited by: §2.
- Benchmarking uncertainty quantification methods for large language models with lm-polygraph. Transactions of the Association for Computational Linguistics 13, pp. 220–248. External Links: ISSN 2307-387X, Document, Link, https://direct.mit.edu/tacl/article-pdf/doi/10.1162/tacl_a_00737/2511955/tacl_a_00737.pdf Cited by: §2.
- Uncertainty estimation of transformer predictions for misclassification detection. In Proceedings of the 60th Annual Meeting of the Association for Computational Linguistics (Volume 1: Long Papers), pp. 8237–8252. Cited by: §2.
- VLLM: a high-throughput and memory-efficient llm serving library. Note: https://github.com/vllm-project/vllmAccessed: 2025-01 Cited by: §C.5.
- Black-box uncertainty quantification method for llm-as-a-judge. arXiv preprint arXiv:2410.11594. Cited by: §6.
- Label words are anchors: an information flow perspective for understanding in-context learning. In Proceedings of the 2023 Conference on Empirical Methods in Natural Language Processing, pp. 9840–9855. Cited by: §4.1.
- Crowdsourcing multiple choice science questions. In Proceedings of the 3rd Workshop on Noisy User-generated Text, L. Derczynski, W. Xu, A. Ritter, and T. Baldwin (Eds.), Copenhagen, Denmark, pp. 94–106. External Links: Link, Document Cited by: §5.1.
- Influences on LLM calibration: a study of response agreement, loss functions, and prompt styles. In Proceedings of the 63rd Annual Meeting of the Association for Computational Linguistics (Volume 1: Long Papers), W. Che, J. Nabende, E. Shutova, and M. T. Pilehvar (Eds.), Vienna, Austria, pp. 3740–3761. External Links: Link, Document, ISBN 979-8-89176-251-0 Cited by: 5th item, §1, §2, §4.1, §5.1.
- Learn to pick the winner: black-box ensembling for textual and visual question answering. In Proceedings of the 21st Conference on Natural Language Processing (KONVENS 2025): Long and Short Papers, C. Wartena and U. Heid (Eds.), Hannover, Germany, pp. 12–26. External Links: Link Cited by: §2.
- Can llms assist computer education? an empirical case study of deepseek. External Links: 2504.00421, Link Cited by: §1.
- Can llms express their uncertainty? an empirical evaluation of confidence elicitation in llms. In Proceedings of the 12th International Conference on Learning Representations (ICLR), External Links: Link Cited by: §1, §2, §4.1, §5, §5.1, §5.3.
- Bayesian reward models for llm alignment. arXiv preprint arXiv:2402.13210. Cited by: §6.
- Qwen2.5 technical report. arXiv preprint arXiv:2412.15115. External Links: Link Cited by: 3rd item, §5.1.
- Confidence calibration and rationalization for llms via multi-agent deliberation. In ICLR 2024 Workshop on Reliable and Responsible Foundation Models, Cited by: §6.
- Calibrating the confidence of large language models by eliciting fidelity. In Proceedings of the 2024 Conference on Empirical Methods in Natural Language Processing, Y. Al-Onaizan, M. Bansal, and Y. Chen (Eds.), Miami, Florida, USA, pp. 2959–2979. External Links: Link, Document Cited by: §1.
- Relying on the unreliable: the impact of language models’ reluctance to express uncertainty. In Proceedings of the 62nd Annual Meeting of the Association for Computational Linguistics (Volume 1: Long Papers), L. Ku, A. Martins, and V. Srikumar (Eds.), Bangkok, Thailand, pp. 3623–3643. External Links: Link, Document Cited by: §2.
- On the calibration of large language models and alignment. In Findings of the Association for Computational Linguistics: EMNLP 2023, pp. 9778–9795. Cited by: §2, §5, §5.3, footnote 6.
- Towards generation-efficient uncertainty estimation in large language models. arXiv preprint arXiv:2605.06053. Cited by: §2.
- ProSA: assessing and understanding the prompt sensitivity of LLMs. In Findings of the Association for Computational Linguistics: EMNLP 2024, Y. Al-Onaizan, M. Bansal, and Y. Chen (Eds.), Miami, Florida, USA, pp. 1950–1976. External Links: Link, Document Cited by: §2.
Appendix A Theoretical Results
In this section, we directly relate the definitions we lay out in Section˜4 to our proposed metrics. To this end, we formally prove lower bounds that our metrics have to exceed in order for the definitions to hold. We start with Definition˜4.1 and the prompt robustness metric in Equation˜3.
Theorem A.1.
Given a set of semantically equivalent prompts and a robust confidence estimator according to Definition˜4.1 s.t.
| (7) |
then it must hold for the robustness metric defined in Equation˜3 that
| (8) |
Proof.
In the following, we will use the shorthand for . Because of Definition˜4.1, we know that any two cannot lie more than apart. Since standard deviation and variance are metrics of dispersion, they are invariant to translation, meaning that they will stay constant if the data is shifted by a constant amount. Therefore, let us assume that . Since we would like to find the maximum dispersion possible under Equation˜7, let us further assume that points are equal to , and equal , where refers to number of generations that are equivalent to the default generation , including . Therefore, their mean becomes . Correspondingly, we can evaluate their variance as
| (9) | ||||
| (10) | ||||
| (11) | ||||
| (12) |
Next, we would like to identify the that maximizes , we can easily be identified as . Reinserting it into the previous expression yields
| (13) | |||
| (14) |
By plugging this result into the definition of robustness in Definition˜4.1, we can show that since the biggest standard deviation for which Equation˜7 still holds is leads robustness to amount to
| (15) |
∎
Since Definition˜4.2 and the stability metric in Equation˜4 follow the same structure, the matching theorem follows naturally.
Theorem A.2.
Given a set of responses given a prompt , a set of semantically equivalent responses to and a stable* confidence estimator according to Definition˜4.2 s.t.
Then it must hold for the stability metric defined in Equation˜3 that
| (16) |
Proof.
The proof follows the same argument as Theorem˜A.1 without loss of generality. ∎
Lastly, we would like to prove a similar bound for the sensitivity metric in Equation˜5, which we do below.
Theorem A.3.
Let denote a set of generated responses for a given input and a (single) prompt s.t. . Also let be a finite partition of s.t. and and let be a sensitive confidence estimator according to Definition˜4.3 s.t.
| (17) |
and that is stable according to Definition˜4.2 s.t.
Then it must hold for the sensitivity metric A-SST defined in Equation˜5 that
| (18) |
Proof.
We start by restating the definition of sensitivity from Equation˜5:
| (19) |
where are the biggest and smallest set within the partition respectively, with corresponding to a specific input in the dataset. We treat each of the terms in the difference separately next. Firstly, we have
| (20) | |||
| (21) | |||
| (22) |
where the last step follows from Definition˜4.3. We can also simplify by noticing that from the differences considered, of them will amount to when an element is compared to itself. Using the definition of stability in Definition˜4.2, we also know that the remaining comparisons amount to at most each. Therefore,
| (23) | ||||
| (24) |
Putting the two arts together, we obtain
| A-SST | (25) | |||
| (26) | ||||
| (27) |
∎
Appendix B Additional results
B.1 Additional Dataset Results of Metric Values
Similar to Table˜2, Table˜3 presents the results on the NQ and TriviaQA datasets averaged across all models. Overall, we observe trends highly consistent with those of our proposed metrics on SciQ and PopQA.
| NQ | TriviaQA | ||||||||||||
| Method | ECE | Brier | AUROC | P-RB | A-STB | A-SST | ECE | Brier | AUROC | P-RB | A-STB | A-SST | |
| Logit-based | Seq. Likelihood | ||||||||||||
| Boosted Prob. | |||||||||||||
| Platt Scaling | |||||||||||||
| P(True) | |||||||||||||
| Internal States | Attention Score | ||||||||||||
| Hidden Score | |||||||||||||
| SAPLMA | |||||||||||||
| P(IK) | |||||||||||||
| Ling. | Verbalized Conf. | ||||||||||||
| Aux. | Calib1 | ||||||||||||
B.2 Accuracy of Models

We present the detailed model accuracy on each benchmark dataset in Figure˜7. Overall, all models achieve the strongest performance on SciQ and the weakest on PopQA, with the performance gap between the two datasets reaching nearly 50%. This highlights the substantial diversity and varying difficulty of the evaluated benchmarks.
B.3 Distribution of Metric Values
Figure˜8 shows the distribution of metric values across models and CE methods for each dataset. The results demonstrate that CE performance varies substantially across datasets, with no single dataset consistently yielding higher metric values across all metrics. Moreover, each metric exhibits distinct distributional characteristics: robustness and stability are consistently skewed toward high values, whereas sensitivity remains uniformly low across datasets. At the same time, the distributions of our proposed metrics differ markedly from those of ECE, AUROC, and Brier score, further suggesting that they capture complementary aspects of confidence quality.

B.4 Detailed Scaling Results
We present more detailed scaling results in Figure˜10. For linguistic CE methods, such as verbalized confidence, scaling generally improves robustness and stability, while sensitivity exhibits inconsistent trends. In contrast, the trends for the other CE method families are substantially less consistent across metrics and model scales. Overall, the results suggest that the effect of scaling strongly depends on both the CE method type and the underlying model family.


B.5 Detailed Reciprocal Rank of CE Methods
The overall mean reciprocal rank (MRR) of different CE methods for each dataset is shown in Figure˜11. We observe that CE method performance varies across datasets, and that no single method consistently performs best across all datasets and metrics.
Compared to ECE, Brier score, and AUROC, the cross-dataset variation is smaller for robustness, stability, and sensitivity. We hypothesize that this is because traditional calibration and discrimination metrics are more directly tied to correctness, and are therefore more strongly affected by dataset difficulty.

B.6 Case Study
Robustness.
We show two robustness examples in Table˜4 and Table˜5. The results indicate that, across all prompts (–), the Qwen-14B and Mistral models generate semantically equivalent answers. Although the confidence scores produced by different CE methods vary, most methods remain robust to prompt perturbations. In contrast, P(True) and Verbalized Conf. are noticeably less robust in these two cases (P-RB = 0.5), consistent with the trend observed in the main paper. We hypothesize that methods relying more heavily on prompt formatting are more impacted by prompt perturbations.
Stability and Sensitivity.
We present three qualitative examples illustrating stability and sensitivity in Table˜6-Table˜8. For stability, SAPLMA is the least stable method across semantically equivalent answers. We hypothesize that this is because SAPLMA is trained on the hidden state of the final generated token; therefore, small lexical changes at the end of the response can substantially alter the estimated confidence. For example, in Table˜6, the semantically equivalent answers “Concave lens” and “Concave” end with different tokens, resulting in confidence scores of 0.07 and 1.00, respectively.
For sensitivity, P(True), which directly leverages generation-side information, performs best, followed by SAPLMA, which focuses on the final generated token. Methods such as sequence likelihood also use generation-side information, but since all candidate answers remain highly likely generations, the resulting confidence differences are relatively small. Post-hoc scaling methods, such as Platt scaling, further compress these differences and therefore reduce sensitivity. In contrast, methods that do not use answer-side information, such as P(IK), which is trained only on the hidden states of the final token of the question, are almost completely insensitive to answer changes (A-SST = 0). Although Calib1 conditions on both the question and answer, the short-form nature of our datasets likely reduces the contribution of the answer representation, resulting in moderate but still limited sensitivity.
| The electrode at which oxidation occurs is called? : the anode. Corr.: 1.00 | |||||||||||||
|---|---|---|---|---|---|---|---|---|---|---|---|---|---|
| CE | P-RB | ||||||||||||
| Qwen-14B | SciQ | Seq. Likelihood | 0.96 | 0.72 | 0.98 | 1.00 | 1.00 | 1.00 | 0.99 | 0.89 | 1.00 | 1.00 | 0.92 |
| Boosted Prob. | 1.00 | 1.00 | 1.00 | 1.00 | 1.00 | 1.00 | 1.00 | 1.00 | 1.00 | 1.00 | 1.00 | ||
| Platt Scaling | 0.75 | - | 0.75 | 0.75 | 0.75 | 0.75 | 0.75 | 0.73 | 0.75 | 0.75 | 0.99 | ||
| P(True) | 1.00 | 1.00 | 0.00 | 0.00 | 1.00 | 1.00 | 0.00 | 1.00 | 0.00 | 0.00 | 0.50 | ||
| Attention Score | 0.81 | 0.81 | 0.80 | 0.81 | 0.81 | 0.81 | 0.80 | 0.80 | 0.81 | 0.81 | 1.00 | ||
| Hidden Score | 0.85 | 0.86 | 0.84 | 0.84 | 0.83 | 0.86 | 0.84 | 0.85 | 0.83 | 0.83 | 0.99 | ||
| SAPLMA | 1.00 | 1.00 | 1.00 | 0.99 | 0.99 | 1.00 | 1.00 | 1.00 | 0.99 | 0.98 | 0.99 | ||
| P(IK) | 0.90 | 0.89 | 0.88 | 0.91 | 0.91 | 0.91 | 0.89 | 0.89 | 0.93 | 0.95 | 0.98 | ||
| Verbalized Conf. | 0.95 | 0.95 | 0.95 | 0.95 | 0.95 | 0.95 | 0.95 | 0.95 | 0.95 | 0.95 | 1.00 | ||
| Calib1 | 0.77 | 0.76 | 0.77 | 0.76 | 0.76 | 0.78 | 0.77 | 0.75 | 0.74 | 0.76 | 0.99 | ||
| With an atomic weight of 22, what element, named for members of Greek mythology, uses the symbol Ti? | |||||||||||||
|---|---|---|---|---|---|---|---|---|---|---|---|---|---|
| : Titanium ore. Corr.: 1.00 | |||||||||||||
| CE | P-RB | ||||||||||||
| Mistral-123B | TriviaQA | Seq. Likelihood | 0.99 | 0.87 | 0.90 | 0.92 | 0.79 | 1.00 | 0.91 | 0.99 | 0.90 | 0.84 | 0.93 |
| Boosted Prob. | 1.00 | 0.99 | 1.00 | 0.99 | 0.97 | 1.00 | 1.00 | 1.00 | 0.99 | 0.99 | 0.99 | ||
| Platt Scaling | 0.73 | 0.70 | 0.71 | 0.71 | 0.68 | 0.73 | 0.71 | 0.73 | 0.71 | 0.70 | 0.99 | ||
| P(True) | 0.08 | 0.01 | 0.05 | 0.01 | 0.65 | 0.08 | 0.03 | 0.08 | 0.02 | 0.84 | 0.72 | ||
| Attention Score | 0.69 | 0.71 | 0.73 | 0.71 | 0.70 | 0.69 | 0.71 | 0.69 | 0.71 | 0.71 | 0.99 | ||
| Hidden Score | 0.72 | 0.76 | 0.76 | 0.76 | 0.76 | 0.72 | 0.76 | 0.73 | 0.76 | 0.76 | 0.98 | ||
| SAPLMA | 0.98 | 0.22 | 0.00 | 0.30 | 0.07 | 0.96 | 0.02 | 0.94 | 0.38 | 0.13 | 0.62 | ||
| P(IK) | 0.70 | 0.51 | 0.45 | 0.70 | 0.67 | 0.69 | 0.52 | 0.42 | 0.76 | 0.57 | 0.89 | ||
| Verbalized Conf. | 1.00 | 0.00 | 0.00 | 0.00 | 1.00 | 1.00 | 0.00 | 1.00 | 0.00 | 1.00 | 0.50 | ||
| Calib1 | 0.61 | 0.61 | 0.61 | 0.61 | 0.61 | 0.61 | 0.61 | 0.61 | 0.61 | 0.61 | 1.00 | ||
| What type of lens is thicker at the edges than it is in the middle? : concave lens | |||||||
|---|---|---|---|---|---|---|---|
| Convex | Concave lens | Concave | |||||
| CE | A-STB | A-SST | |||||
| Llama-70B | SciQ | Seq. Likelihood | 0.59 | 0.59 | 0.82 | 0.90 | 0.17 |
| Boosted Prob. | 1.00 | 1.00 | 1.00 | 1.00 | 0.00 | ||
| Platt Scaling | 0.67 | 0.67 | 0.73 | 0.98 | 0.04 | ||
| P(True) | 0.32 | 0.00 | 0.00 | 1.00 | 0.32 | ||
| Attention Score | 0.84 | 0.84 | 0.84 | 1.00 | 0.00 | ||
| Hidden Score | 0.90 | 0.77 | 0.78 | 1.00 | 0.11 | ||
| SAPLMA | 1.00 | 0.07 | 1.00 | 0.60 | 0.23 | ||
| P(IK) | 0.90 | 0.90 | 0.90 | 1.00 | 0.00 | ||
| Verbalized Conf. | 1.00 | 0.00 | 0.00 | 1.00 | 1.00 | ||
| Calib1 | 0.87 | 0.81 | 0.78 | 0.99 | 0.09 | ||
| where was the world chess tournament 2017 held? : Tbilisi, Georgia | ||||||||
|---|---|---|---|---|---|---|---|---|
| New York City, USA | Riyadh, Saudi Arabia | New York City | Carlsen vs. Caruana 2018 | |||||
| CE | A-STB | A-SST | ||||||
| Mistral-123B | NQ | Seq. Likelihood | 0.61 | 0.69 | 0.74 | 0.64 | 0.94 | 0.03 |
| Boosted Prob. | 0.99 | 0.99 | 0.99 | 0.98 | 1.00 | 0.00 | ||
| Platt Scaling | 0.60 | 0.62 | 0.63 | 0.61 | 0.99 | 0.01 | ||
| P(True) | 0.05 | 0.87 | 0.04 | 0.01 | 0.99 | 0.03 | ||
| Attention Score | 0.53 | 0.53 | 0.53 | 0.53 | 1.00 | 0.00 | ||
| Hidden Score | 0.47 | 0.52 | 0.52 | 0.47 | 0.98 | 0.02 | ||
| SAPLMA | 0.39 | 0.01 | 0.97 | 0.00 | 0.74 | 0.57 | ||
| P(IK) | 0.79 | 0.79 | 0.80 | 0.80 | 1.00 | 0.00 | ||
| Verbalized Conf. | 1.00 | 1.00 | 1.00 | 0.00 | 1.00 | 1.00 | ||
| Calib1 | 0.59 | 0.59 | 0.56 | 0.41 | 0.99 | 0.15 | ||
| What is the capital of Cao Wei? : Luoyang | |||||||
|---|---|---|---|---|---|---|---|
| 洛阳 | Luo Yin | Luoyang | |||||
| CE | A-STB | A-SST | |||||
| Qwen-14B | PopQA | Seq. Likelihood | 0.47 | 0.46 | 0.61 | 0.94 | 0.01 |
| Boosted Prob. | 1.00 | 0.97 | 1.00 | 1.00 | 0.03 | ||
| Platt Scaling | 0.49 | 0.49 | 0.52 | 0.99 | 0.00 | ||
| P(True) | 1.00 | 0.00 | 1.00 | 1.00 | 1.00 | ||
| Attention Score | 0.36 | 0.24 | 0.18 | 0.92 | 0.03 | ||
| Hidden Score | 0.39 | 0.16 | 0.18 | 0.91 | 0.09 | ||
| SAPLMA | 0.00 | 0.40 | 0.92 | 0.59 | 0.06 | ||
| P(IK) | 0.23 | 0.23 | 0.23 | 1.00 | 0.00 | ||
| Verbalized Conf. | 0.95 | 0.85 | 0.95 | 1.00 | 0.10 | ||
| Calib1 | 0.49 | 0.21 | 0.57 | 0.96 | 0.27 | ||
B.7 Results of GPT-4o
We report the aggregated results for GPT-4o in Table˜9. Due to limited access to the commercial model, we evaluate only five CE methods. Nevertheless, the observed trends are largely consistent with the main results reported in the paper. Note that, consistent with the main paper, we also use GPT-4o to judge the correctness of GPT-4o responses. However, since our proposed metrics do not depend on correctness labels, this setup does not affect our findings.
| Method | ECE | Brier | AUROC | P-RB | A-STB | A-SST |
|---|---|---|---|---|---|---|
| Seq. Likelihood | 0.264 | 0.275 | 0.678 | 0.949 | 0.916 | 0.216 |
| Platt Scaling | 0.076 | 0.216 | 0.649 | 0.990 | 0.982 | 0.047 |
| Verbalized Conf. | 0.258 | 0.262 | 0.701 | 0.962 | 0.985 | 0.109 |
| P(True) | 0.295 | 0.296 | 0.733 | 0.976 | 0.988 | 0.226 |
| Calib1 | 0.104 | 0.208 | 0.704 | 0.982 | 0.960 | 0.091 |
B.8 Robustness: Confidence-elicit Prompts for Verbalized Confidence
In the main paper, we first use an answer-elicit prompt (Ans-elicit) that instructs the LLM to produce an answer to the input question. At this stage, all the methods except verbalized confidence can already estimate confidence scores based on the generated answer. In contrast, verbalized confidence requires an additional confidence-elicit prompt (Conf-elicit) to guide the LLM in verbalizing its confidence regarding the produced answer. To further investigate the effect of prompt perturbations on confidence estimation, we conduct additional experiments for verbalized confidence that only perturb the confidence-elicit prompts instead. This design allows us to explore the robustness of verbalized confidence under two prompt perturbation settings: (1) perturb the answer-elicit prompts and (2) perturb the confidence-elicit prompts.
Perturbation of confidence-elicitation prompt.
To evaluate the robustness of verbalized confidence, we design seven variants of the confidence-elicitation prompt (see Table 10), grouped into three types: (i) Scale variants, which elicit confidence using numerical ranges of 0–1, 0–100%, and 0–10; (ii) Lexical variants, which vary the key term used to request a score between 0 and 1 (“probability”, “certainty” and “confidence”); and (iii) Linguistic expressions, following Tian et al. (2023), which elicit confidence using predefined verbal scales from “Almost No Chance” to “Almost certain”, and a corresponding multiple-choice format (e.g., “a: Almost No Chance”). Those selected expressions are converted to numerical scores according to the rules in the next paragraph. All confidence outputs are normalized to a 0–1 scale for comparison.
| Concept | Prompt Name | Prompt |
|---|---|---|
| Scale Variants | P(1) | Provide the probability that your answer is correct. Give ONLY the probability between 0.0 and 1.0, no other words or explanation. |
| P(%) | Provide the probability that your answer is correct. Give ONLY the probability between 0% and 100%, no other words or explanation. | |
| P(10) | Provide the probability that your answer is correct. Give ONLY the probability between 0 and 10, no other words or explanation. | |
| Lexical Variants | CF(1) | Provide the confidence that your answer is correct. Give ONLY the confidence between 0.0 and 1.0, no other words or explanation. |
| CT(1) | Provide the certainty that your answer is correct. Give ONLY the confidence between 0 and 10, no other words or explanation. | |
| Linguistic Expressions | L. | Describe how likely it is that your answer is correct as one of the following expressions: [’Almost No Chance’, ’Highly Unlikely’, ’Chances are Slight’, ’Little Chance’, ’Unlikely’, ’Probably Not’, ’About Even’, ’Better than Even’, ’Likely’, ’Probably’, ’Very Good Chance’,’Highly Likely’, ’Almost Certain’]. Give ONLY the chosen expression, no other words or explanation. |
| L. MC | Describe how likely it is that your answer is correct by choosing one of the following options: [a: ’Almost No Chance’, b: ’Highly Unlikely’, c: ’Chances are Slight’, d: ’Little Chance’, e:’Unlikely’, f: ’Probably Not’, g: ’About Even’, h: ’Better than Even’, i: ’Likely’, j: ’Probably’, k; ’Very Good Chance’, l: ’Highly Likely’, m: ’Almost Certain’]. Give ONLY the chosen option, no other words or explanation. |
| Dataset | Ans-elicit | Conf-elicit |
|---|---|---|
| NQ | 0.985 | 0.907 |
| PopQA | 0.984 | 0.895 |
| SciQ | 0.990 | 0.928 |
| TriviaQA | 0.985 | 0.921 |
| AVG | 0.986 | 0.913 |
Mapping of Linguistic Prompts.
For the linguistic prompts, we followed Tian et al. (2023) to map the linguistic expressions to numerical scores. The specific mapping are [“Almost No Chance”, “Highly Unlikely”, “Chances are Slight”, “Little Chance”, “Unlikely”, “Probably Not”, “About Even”, “Better than Even”, “Likely”, “Probably”, “Very Good Chance”, “Highly Likely”, ’Almost Certain”] to [0.02, 0.05, 0.1, 0.1, 0.2, 0.25, 0.5, 0.6, 0.7, 0.7, 0.8, 0.9, 0.95] according to Fagen-Ulmschneider (2023).
Results and Analysis.
As shown in Table 11, when perturb only the answer-elicit prompts (Ans-elicit), verbalized confidence produces more stable confidence estimates () compared to perturb confidence-elicit prompts are used (). We hypothesize that this difference in stability arises because the generated answers remain largely consistent across perturbed answer-elicit prompts, leading to nearly identical instructions when subsequently eliciting confidence for those answers. In contrast, perturbations to the confidence-elicit prompts directly alter how the model is instructed to express its confidence, thereby introducing greater variability in the resulting confidence scores.
Prompt-wise Confidence Analysis for Verbalized Confidence.
To further analyze the reason of the low robustness of verbalized confidence, we conduct a prompt-wise confidence analysis on selected models by examining the pairwise correlations of confidences between conf-elicit prompts for individual models (shown by Figure˜12). We found that larger models maintain higher stability of confidence, demonstrating their ability to respond to diverse confidence-eliciting prompts. LLMs remain stable with the change of scales and lexical words in prompts. Specifically, prompts that perturbed with scale and lexical words change tend to have more correlated verbalized confidence compared to adding linguistic expressions in the prompt. Small models (<= 32B) struggle more in maintaining robustness, especially with the multi-choice linguistic expression prompts.


B.9 Sensitivity: Alternative Sets of Semantically Different Answers
Table˜12 reports sensitivity results obtained by using all semantically different answers outside (denoted as ), instead of the original setting that compares with . The results remain stable under this alternative definition and do not affect the main findings of the paper.
| Method | ||
|---|---|---|
| Seq. Likelihood | 0.182 | 0.171 |
| Boosted Prob. | 0.037 | 0.035 |
| Platt Scaling | 0.039 | 0.037 |
| P(True) | 0.228 | 0.227 |
| Attention Score | 0.032 | 0.032 |
| Hidden Score | 0.034 | 0.034 |
| SAPLMA | 0.180 | 0.178 |
| P(IK) | 0.000 | 0.000 |
| Verbalized Conf. | 0.057 | 0.054 |
| Calib1 | 0.065 | 0.065 |
B.10 Instruction vs Reasoning Models
We compare the averaged results of instruction-tuned and reasoning models across all datasets; the results are shown in Table˜13-Table˜16. Overall, both model types exhibit highly similar trends. We hypothesize that this is because the evaluated tasks consist of short-form question answering, which requires limited multi-step reasoning and therefore yields only minor differences between instruction-tuned and reasoning models.
| Instruction Model | Reasoning Model | |||||||||||
|---|---|---|---|---|---|---|---|---|---|---|---|---|
| Method | ECE | Brier | AUROC | P-RB | A-STB | A-SST | ECE | Brier | AUROC | P-RB | A-STB | A-SST |
| Seq. Likelihood | 0.410 | 0.387 | 0.707 | 0.952 | 0.975 | 0.169 | 0.378 | 0.321 | 0.750 | 0.949 | 0.938 | 0.146 |
| Boosted Prob. | 0.556 | 0.536 | 0.712 | 0.989 | 0.996 | 0.031 | 0.615 | 0.568 | 0.715 | 0.982 | 0.976 | 0.041 |
| Platt Scaling | 0.217 | 0.275 | 0.707 | 0.990 | 0.995 | 0.035 | 0.270 | 0.266 | 0.750 | 0.990 | 0.987 | 0.030 |
| P(True) | 0.332 | 0.350 | 0.716 | 0.925 | 0.970 | 0.190 | 0.401 | 0.366 | 0.742 | 0.947 | 0.940 | 0.205 |
| Attention Score | 0.045 | 0.233 | 0.575 | 0.987 | 0.994 | 0.027 | 0.042 | 0.199 | 0.614 | 0.986 | 0.987 | 0.030 |
| Hidden Score | 0.049 | 0.228 | 0.612 | 0.981 | 0.992 | 0.045 | 0.044 | 0.200 | 0.603 | 0.987 | 0.985 | 0.022 |
| SAPLMA | 0.263 | 0.277 | 0.743 | 0.870 | 0.969 | 0.199 | 0.226 | 0.235 | 0.774 | 0.885 | 0.928 | 0.145 |
| P(IK) | 0.207 | 0.274 | 0.631 | 0.958 | 1.000 | 0.000 | 0.182 | 0.236 | 0.689 | 0.962 | 1.000 | 0.000 |
| Verbalized Conf. | 0.524 | 0.511 | 0.597 | 0.985 | 0.995 | 0.055 | 0.644 | 0.617 | 0.632 | 0.987 | 0.982 | 0.027 |
| Calib1 | 0.067 | 0.223 | 0.644 | 0.984 | 0.991 | 0.070 | 0.051 | 0.187 | 0.713 | 0.981 | 0.962 | 0.051 |
| Instruction Model | Reasoning Model | |||||||||||
|---|---|---|---|---|---|---|---|---|---|---|---|---|
| Method | ECE | Brier | AUROC | P-RB | A-STB | A-SST | ECE | Brier | AUROC | P-RB | A-STB | A-SST |
| Seq. Likelihood | 0.087 | 0.149 | 0.677 | 0.937 | 0.969 | 0.172 | 0.038 | 0.151 | 0.705 | 0.942 | 0.941 | 0.147 |
| Boosted Prob. | 0.177 | 0.179 | 0.723 | 0.995 | 0.999 | 0.010 | 0.175 | 0.184 | 0.732 | 0.992 | 0.996 | 0.017 |
| Platt Scaling | 0.097 | 0.154 | 0.677 | 0.986 | 0.993 | 0.040 | 0.092 | 0.161 | 0.705 | 0.987 | 0.986 | 0.035 |
| P(True) | 0.163 | 0.170 | 0.726 | 0.949 | 0.992 | 0.182 | 0.111 | 0.153 | 0.739 | 0.971 | 0.989 | 0.190 |
| Attention Score | 0.017 | 0.150 | 0.551 | 0.991 | 0.997 | 0.019 | 0.017 | 0.160 | 0.560 | 0.991 | 0.996 | 0.015 |
| Hidden Score | 0.038 | 0.148 | 0.584 | 0.981 | 0.996 | 0.044 | 0.034 | 0.156 | 0.607 | 0.977 | 0.987 | 0.043 |
| SAPLMA | 0.148 | 0.165 | 0.752 | 0.906 | 0.984 | 0.217 | 0.180 | 0.189 | 0.719 | 0.842 | 0.950 | 0.180 |
| P(IK) | 0.051 | 0.143 | 0.688 | 0.976 | 1.000 | 0.000 | 0.108 | 0.165 | 0.666 | 0.976 | 1.000 | 0.000 |
| Verbalized Conf. | 0.143 | 0.166 | 0.618 | 0.990 | 0.999 | 0.034 | 0.162 | 0.178 | 0.710 | 0.992 | 0.996 | 0.027 |
| Calib1 | 0.089 | 0.157 | 0.598 | 0.984 | 0.995 | 0.073 | 0.118 | 0.170 | 0.614 | 0.991 | 0.982 | 0.043 |
| Instruction Model | Reasoning Model | |||||||||||
|---|---|---|---|---|---|---|---|---|---|---|---|---|
| Method | ECE | Brier | AUROC | P-RB | A-STB | A-SST | ECE | Brier | AUROC | P-RB | A-STB | A-SST |
| Seq. Likelihood | 0.277 | 0.285 | 0.688 | 0.951 | 0.985 | 0.206 | 0.266 | 0.272 | 0.757 | 0.945 | 0.960 | 0.173 |
| Boosted Prob. | 0.370 | 0.361 | 0.701 | 0.993 | 0.999 | 0.029 | 0.434 | 0.410 | 0.761 | 0.986 | 0.994 | 0.049 |
| Platt Scaling | 0.079 | 0.232 | 0.688 | 0.990 | 0.997 | 0.046 | 0.177 | 0.252 | 0.757 | 0.988 | 0.991 | 0.039 |
| P(True) | 0.263 | 0.279 | 0.686 | 0.944 | 0.992 | 0.283 | 0.288 | 0.297 | 0.753 | 0.960 | 0.986 | 0.259 |
| Attention Score | 0.031 | 0.230 | 0.564 | 0.989 | 0.998 | 0.035 | 0.040 | 0.249 | 0.535 | 0.987 | 0.994 | 0.027 |
| Hidden Score | 0.019 | 0.232 | 0.517 | 0.995 | 0.999 | 0.014 | 0.025 | 0.247 | 0.538 | 0.990 | 0.995 | 0.024 |
| SAPLMA | 0.255 | 0.284 | 0.659 | 0.867 | 0.985 | 0.239 | 0.253 | 0.282 | 0.713 | 0.830 | 0.932 | 0.178 |
| P(IK) | 0.094 | 0.228 | 0.628 | 0.959 | 1.000 | 0.000 | 0.141 | 0.240 | 0.706 | 0.952 | 1.000 | 0.000 |
| Verbalized Conf. | 0.348 | 0.350 | 0.589 | 0.984 | 0.998 | 0.092 | 0.458 | 0.450 | 0.660 | 0.989 | 0.996 | 0.043 |
| Calib1 | 0.062 | 0.230 | 0.586 | 0.991 | 0.998 | 0.053 | 0.078 | 0.242 | 0.631 | 0.984 | 0.984 | 0.063 |
| Instruction Model | Reasoning Model | |||||||||||
|---|---|---|---|---|---|---|---|---|---|---|---|---|
| Method | ECE | Brier | AUROC | P-RB | A-STB | A-SST | ECE | Brier | AUROC | P-RB | A-STB | A-SST |
| Seq. Likelihood | 0.407 | 0.334 | 0.832 | 0.950 | 0.988 | 0.206 | 0.301 | 0.209 | 0.877 | 0.955 | 0.971 | 0.157 |
| Boosted Prob. | 0.584 | 0.531 | 0.857 | 0.982 | 0.996 | 0.068 | 0.537 | 0.427 | 0.882 | 0.968 | 0.980 | 0.091 |
| Platt Scaling | 0.264 | 0.257 | 0.832 | 0.990 | 0.998 | 0.041 | 0.328 | 0.236 | 0.877 | 0.991 | 0.994 | 0.033 |
| P(True) | 0.307 | 0.307 | 0.797 | 0.921 | 0.990 | 0.257 | 0.421 | 0.354 | 0.795 | 0.953 | 0.980 | 0.229 |
| Attention Score | 0.053 | 0.205 | 0.612 | 0.986 | 0.997 | 0.049 | 0.043 | 0.174 | 0.623 | 0.989 | 0.992 | 0.033 |
| Hidden Score | 0.049 | 0.210 | 0.573 | 0.993 | 0.998 | 0.035 | 0.038 | 0.178 | 0.552 | 0.994 | 0.995 | 0.021 |
| SAPLMA | 0.133 | 0.152 | 0.876 | 0.920 | 0.992 | 0.113 | 0.152 | 0.153 | 0.875 | 0.934 | 0.972 | 0.063 |
| P(IK) | 0.080 | 0.162 | 0.816 | 0.965 | 1.000 | 0.000 | 0.083 | 0.129 | 0.857 | 0.976 | 1.000 | 0.000 |
| Verbalized Conf. | 0.585 | 0.562 | 0.650 | 0.983 | 0.996 | 0.077 | 0.708 | 0.677 | 0.684 | 0.988 | 0.996 | 0.028 |
| Calib1 | 0.083 | 0.175 | 0.768 | 0.984 | 0.997 | 0.075 | 0.106 | 0.136 | 0.817 | 0.989 | 0.985 | 0.064 |
Appendix C Reproducibility Details
C.1 Detailed Answer-elicit Prompts
| Concept | Prompt Name | Prompt |
|---|---|---|
| Answer | A1 | Answer the question, give ONLY the answer, no other words or explanation: |
| A2 | Answer the question, give ONLY the answer without explanation: | |
| A3 | Answer the question, give ONLY the answer: | |
| A4 | Answer the question as short as possible: | |
| A5 | Answer the question with minimal words: | |
| Provide | P1 | Provide an answer for the question, give ONLY the answer, no other words or explanation: |
| P2 | Provide an answer for the question without explanation: | |
| P3 | Provide an answer for the question, give ONLY the answer: | |
| P4 | Provide as short an answer as possible to the question: | |
| P5 | Provide an answer with minimal words for the question: |
In the main paper, all the CE methods are evaluated under the prompt variations in Table˜17 for robustness.
C.2 LLM-as-a-Judge Prompts
We use GPT-4o as a judge model (see prompt in Table˜18 and Table˜19) to determine the semantic equivalence between LLM responses and target answers for correctness evaluation, as well as the semantic equivalence among sampled responses when computing stability and sensitivity metrics.
C.3 Evaluated LLMs
We evaluate 11 LLMs spanning five major families, which consist of instruction and reasoning models.
- •
-
•
From Llama, we test Llama-70B (Llama-3.3-70B-Instruct; Meta AI, 2024) .
-
•
From Qwen, we cover three model sizes: Qwen2.5-72B, Qwen2.5-32B, and Qwen2.5-14B (Qwen2.5-Instruct, Yang et al., 2024b).
-
•
From OLMo, we assess a broad range of models Team OLMo et al. (2024), including OLMo-2-0325-32B-Instruct (OLMo-32B), OLMo-2-1124-13B (OLMo-13B), and OLMo-2-1124-7B (OLMo-7B).
-
•
From GPT, we include GPT-4o (gpt-4o-2024-11-20) (OpenAI, 2024), as it is a commercial model, confidence estimation methods (such as Boosted Prob. and internal states-based methods) that require beyond the top 20 output logits are not applicable.
C.4 Implementing Detail
Confidence Estimation Methods.
Below are implementation details of the evaluated CE methods.
-
•
Seq. Likelihood. We use the normalized probability of the generated response as a likelihood-based baseline. Specifically, we sum token log-probabilities over generated tokens only, excluding prompt tokens, and divide by the response length.
-
•
Boosted Prob. Boosted probability is computed from generated-token probabilities following prior probability-based uncertainty estimators (Dinh and Niehues, 2025). We extract logits only for generated tokens and compute the boosted-probability statistic over the model’s output distribution.
-
•
Platt Scaling (Platt, 1999). Platt scaling trains two scalars over sequence likelihood and correctness labels. The input feature is sequence-likelihood, and the scalars learn a one-dimensional affine transformation followed by a sigmoid.
-
•
P(True) (Kadavath et al., 2022). P(True) is implemented as a self-evaluation query to the same language model. We construct a binary verification prompt containing the question and proposed answer, ending with a request to choose whether the proposed answer is “True” or “False”. We then compute the normalized probability of the True option from the model’s next-token log probabilities.
-
•
Calib1 (Xia et al., 2025a). Calib1 is implemented as a supervised text-pair calibrator. We encode the question and answer with a BERT-style encoder and train a classifier to predict answer correctness. The calibrator operates only on the textual question-answer pair and does not require access to internal states of the target LLM. We train the classifier with focal loss (Mukhoti et al., 2020) and use the predicted positive-class probability as the confidence score.
-
•
Verbalized Confidence (Tian et al., 2023). Verbalized confidence is implemented as a second-stage prompting method. After the model produces an answer, we ask it to explicitly report a confidence value.
-
•
Attention Score (Sriramanan et al., 2024). The attention score is implemented as a white-box statistic over transformer attention. During local inference, we extract attention from a mid-to-late layer, approximately 70% through the model depth. We immediately reduce the attention tensor to a scalar using an eigenspectrum-based statistic. The scalar attention feature is then mapped to a confidence score with a logistic regression calibrator trained on correctness labels.
-
•
Hidden Score (Sriramanan et al., 2024). Similar to the attention score, the hidden score is implemented from the same mid-to-late layer hidden representations. We extract the relevant hidden-state vector and compute a singular-value-based scalar statistic. We then train a logistic regression calibrator over this scalar feature to produce a normalized confidence score.
-
•
SAPLMA (Azaria and Mitchell, 2023). SAPLMA is implemented as a learned probe over the language model’s final-layer hidden state. For each generated answer, we use the hidden state associated with the final generated-token position. We train an MLP classifier on these fixed representations to predict correctness. The LLM parameters are frozen throughout training; only the MLP probe is optimized. The confidence score is the classifier’s positive-class probability.
-
•
P(IK) (Kadavath et al., 2022). P(IK) is implemented as a pre-generation linear probe. Instead of using a representation from the generated answer, we use the final-layer hidden state corresponding to the question’s last token. A single linear layer with sigmoid output is trained to predict whether the model will answer correctly. The language model remains frozen, and only the linear head is trained.
C.5 Technical Details
We use the vLLM vLLM Contributors (2023) library for LLM inference and serving. All our experiments are conducted on NVIDIA HGX H100, which requires approximately 600 GPU hours to replicate.
C.6 Use of AI Assistants
AI-based assistants were used to support code debugging, language polishing, grammar correction, and improving the clarity of presentation. All scientific contributions, experimental design, analyses, and conclusions were developed and verified by the authors. AI assistants were not used to generate experimental results or annotations without human oversight and verification.