Two-dimensional RMSD projections for reaction path visualization and validation
Institute IMX and Lab-COSMO
École polytechnique fédérale de Lausanne (EPFL)
Station 12, CH-1015 Lausanne, Switzerland
and
TurtleTech ehf., 107 Reykjavík, Iceland
rgoswami@ieee.org
Abstract
Transition state or minimum energy path finding methods constitute a routine component of the computational chemistry toolkit. Standard analysis involves trajectories conventionally plotted in terms of the relative energy to the initial state against a cumulative displacement variable, or the image number. These dimensional reductions obscure structural rearrangements in high dimensions and are often history dependent. This precludes the ability to compare optimization histories of different methods beyond the number of calculations, time taken, and final saddle geometry. We present a method mapping trajectories onto a two-dimensional projection defined by a permutation corrected root mean square deviation from the reactant and product configurations. Energy is represented as an interpolated color-mapped surface constructed from all optimization steps using a gradient aware derivative Gaussian Process. This representation highlights optimization trajectories, identifies endpoint basins, and diagnoses convergence concerns invisible in one-dimensional profiles. We demonstrate the framework on a cycloaddition reaction, showing that a machine-learned potential saddle and density functional theory reference lie on comparable energy contours despite geometric displacements, along with the ratification of the visualization for more complex reactions, a grignard rearrangement, and a bicyclobutadiene rearrangement.
Keywords Nudged Elastic Band, Saddle Search Methods, Visualization, Transition States
The first order saddle point, is often the first approximation to understand the reaction kinetics of any system of interest. Starting from two known configurations, a series of configurations connected through fictitious springs, that is, the nudged elastic band method [18] is among the most common. The NEB may be coupled with the climbing image [16] and spring variations [1] with machine learned local accelerations [14, 20, 11] and the string family of methods [28, 34, 24]. Together, these form the current Pareto optimal forms to find a saddle.
Beyond difficulties of convergence and the intricacies of the initial points chosen, the resulting path histories are best studied through the “eye-ball norm”, wherein manual inspection of the final path, along with a normal mode analysis for the saddle point estimate are considered sufficient. In turn, this means the most common visual plots, are one dimensional “profile” plots. These may show only the final optimized path, against the image number 111e.g. as found in ASE [21], which obscures any distance measure between the images. Alternatively, a well-known improvement to this involves the cubic Hermite interpolation [16] involving the forces relative to the “reaction coordinate,” defined by the piece-wise sum of the Euclidiean distances between intermediate images. The reaction coordinate depends entirely on the specific path geometry and optimization history. This scalar measure lacks a unique definition and collapses global geometric information onto a single, arbitrary axis. This dimensional reduction precludes rigorous comparison between trajectories generated by differing algorithms, such as NEB versus Frozen String methods, or even identical algorithms with varying parameters. Furthermore, the one-dimensional projection frequently masks the distinction between numerical instability and physical relaxation into alternative basins, creating ambiguity in the validation of stationary points which costs researchers often days of calculations to clarify.
1 Methodology
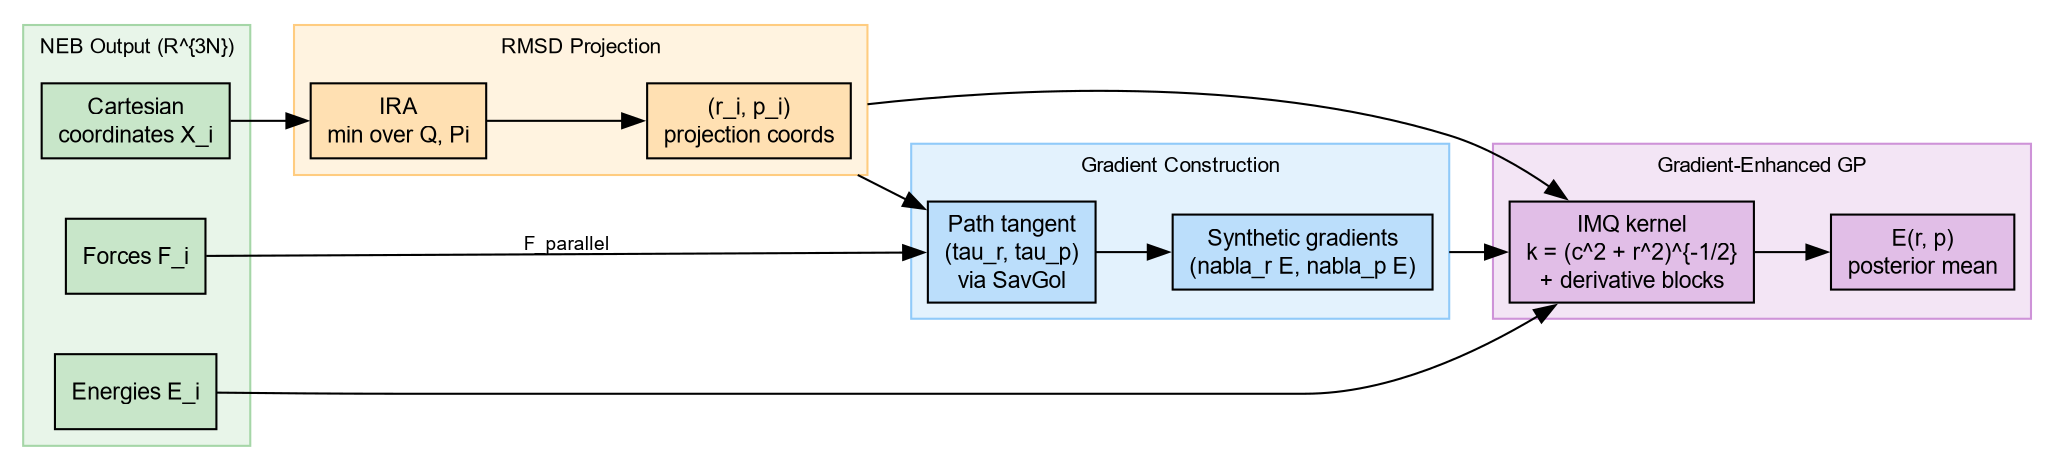
The complete methodology is summarized in Figure 1. We describe the one-dimensional profiles first. Since standard NEB implementations provide discrete images and energies . To reconstruct a physically consistent energy profile along the path, we utilize the available force information. We define the discrete reaction coordinate as the cumulative Euclidean distance:
| (1) |
Instead of simple linear or cubic interpolation, we employ a Piecewise Cubic Hermite Interpolating Polynomial (PCHIP). This method utilizes the tangent forces to constrain the derivative of the energy surface:
| (2) |
where denotes the unit tangent vector along the path.
1.1 Intrinsic Projection Coordinates
To map the high-dimensional optimization trajectory onto a consistent 2D subspace, we define the projection coordinates as the distances from the reactant () and product () reference configurations. To ensure the metric remains robust across automated workflows where atom indexing may vary, we employ a permutation-invariant Root Mean Square Deviation (RMSD) with optimal permutation and rotation determined via the Iterative Rotations and Assignments (IRA) [15] algorithm. This procedure guarantees unique, invariant coordinates regardless of the initial atom indexing or frame orientation [11]. The discrete optimization steps provide a sparse sampling of this geometric subspace.
For a system with atoms having positions , we define the distance metric as:
| (3) |
Here, denotes the Frobenius norm. represents the optimal rotation matrix, and represents the optimal permutation matrix. We solve for and simultaneously. This ensures that the resulting coordinates remain invariant to rigid body rotation, translation, and arbitrary atom index labeling.
Unlike principal component analysis (PCA) [17] or t-distributed stochastic neighbor embedding (t-SNE) [32] applied to covariance matrices [27, 8], which require a priori selection of descriptors (e.g., bond lengths, angles, SOAP vectors [7]), RMSD-based projection operates directly on Cartesian coordinates without feature engineering. PCA-based methods popular in machine learning interatomic potential (MLIP) communities presuppose that the dominant variance directions align with chemically meaningful coordinates, an assumption that frequently fails for complex rearrangements involving concerted bond breaking and formation. Similarly, manifold learning techniques like t-SNE and UMAP [26] optimize for local neighborhood preservation but lack the absolute geometric reference frame necessary for quantitative cross-method comparison. Sketchmap [31] attempts to preserve both local and global distance structure, but requires on the order of $104$– samples to learn a reliable mapping, and even then does not guarantee metric preservation of absolute distances. A single NEB calculation produces geometries at most. Our endpoint-distance coordinates provide a universal, reaction-agnostic metric from exactly these points, with no training phase, no descriptor selection, and no presupposed chemical intuition about the reaction mechanism.
For systems with well-established collective variables (Ramachandran angles for peptides, donor-acceptor distances for proton transfer), such coordinates naturally provide superior physical insight [22]. However, the vast majority of transition state searches lack such convenient coordinates. Surface reactions, where an adatom hops into a subsurface site on a metallic slab, or catalytic processes involving concerted rearrangements of adsorbates, have no obvious low-dimensional collective variable. Constructing a two-dimensional free energy surface for such systems requires extensive sampling and a priori knowledge of the relevant degrees of freedom. In contrast, the RMSD-based projection requires only the Cartesian coordinates already produced by the calculation. Unlike free energy surface methods that mandate pre-specification of reaction coordinates, our approach visualizes arbitrary path based methods post hoc, requiring only the endpoints. This eliminates the circular dependency where one must already understand the mechanism to choose coordinates capable of revealing it.
Our method targets the complementary regime to global PES exploration techniques: we provide geometric validation for individual optimization trajectories ( samples per NEB calculation) rather than exhaustive basin catalogs requiring samples. Most single NEB calculations involve only geometries concentrated along a one-dimensional path connecting a single reactant-product pair. This sampling is insufficient and inappropriate for techniques designed to map complete basin connectivity or construct disconnectivity graphs [33]. Our framework instead answers a distinct question: “Did this specific optimization find a physically reasonable barrier topology?” This diagnostic capability proves critical for MLIP validation, where the goal is verifying that a machine-learned potential reproduces the correct transition pathway, not exhaustively cataloging all possible pathways.
1.2 Energy Landscape Projection
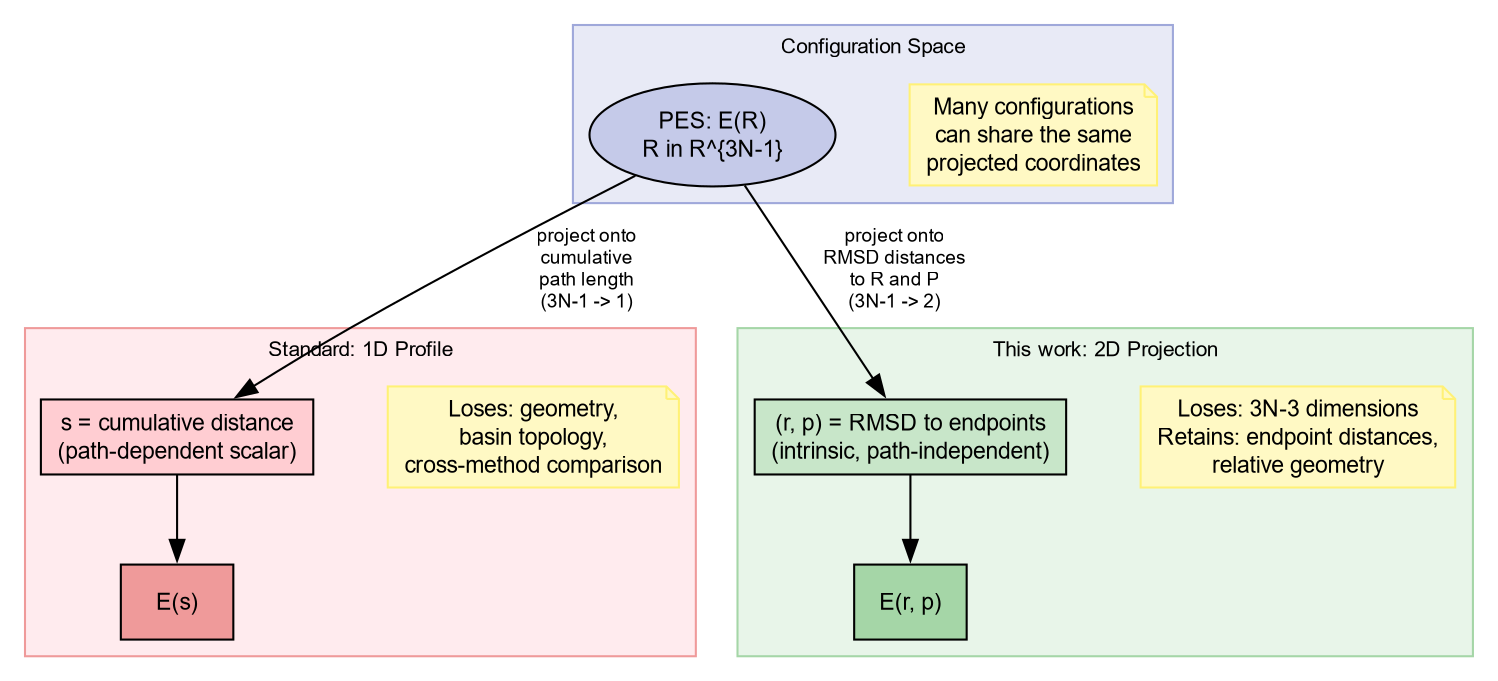
The discrete optimization steps provide a sparse, unstructured sampling of the 2D domain (Figure 2). To visualize slices of the underlying potential energy landscape , in a meaningful way to compare data from disparate calculations, we construct a continuous projection approximating the potential energy surface. Both the 1D and 2D projections are lossy: multiple distinct configurations in can map to the same projected coordinate. The 2D projection retains strictly more information than the 1D reaction coordinate, but it is not and cannot be the full PES.
While forces are available from electronic structure calculations in 3N-dimensional Cartesian space, direct projection via the chain rule would require computing , a quantity complicated by the minimization over permutations and rotations implicit in the RMSD definition. Instead, we construct synthetic gradients in the 2D projection space by combining the path tangent vector with the available parallel force component.
First, we stabilize the tangent calculation via Savitzky-Golay smoothing of the RMSD coordinates themselves:
| (4) |
From the smoothed coordinates, we compute the path tangent:
| (5) |
where the tangent is normalized so . The projected gradient components are then:
| (6) |
where is the force component parallel to the path (column 3 in an eOn .dat file). This construction ensures gradient information respects the local path geometry while remaining tractable to compute from standard NEB output.
Only the tangential force component enters this construction. The full Cartesian force contains orthogonal components encoding local curvature of the true PES. However, projecting these into the subspace requires the Jacobian , which is not analytically available: the RMSD involves a joint minimization over rotations and permutations , making the map from to piecewise smooth at best. The tangential projection is therefore the consistent choice without additional approximations. It still carries non-trivial 2D information because the tangent direction varies along the path, distributing force information across both coordinates in a way not accessible from scalar reaction coordinate plots.
We stress that the interpolated surface is a projected slice of the full $3N$-dimensional PES: many distinct Cartesian configurations map to the same point. The interpolation represents the conditional expectation of the energy given the RMSD coordinates, marginalizing over the unconstrained degrees of freedom. Features of the projected surface, such as apparent alternative pathways in the color map, do not necessarily correspond to physical pathways in the full configuration space. Similarly, the property that MEP images are minima in the orthogonal hyperplane holds in the full-dimensional PES but has no analogue in a two-dimensional lossy projection. The interpolation is reliable near the sampled data and degrades with distance, as with any regression model.
We denote the 2D projection coordinates compactly as . Together with the projected gradients from above, these form the inputs to a Gaussian process regression with derivative observations [13, 23, 9]. We construct the energy surface using the Inverse Multiquadric (IMQ) kernel:
| (7) |
where is a scale parameter. The function is completely monotone on : for all . By Schoenberg’s theorem [30], any kernel of the form with completely monotone is strictly positive definite on for all [6]. This guarantees non-singular interpolation matrices regardless of point configuration.
The gradient-enhanced GP requires derivative kernel blocks. For the IMQ these are:
| (8) | ||||
| (9) |
which assemble into the augmented kernel matrix [19] over the observation vector . In practice, the derivative covariances are computed via automatic differentiation using the JAX library, so extending to other kernels requires only changing the base kernel function.
As , the IMQ kernel decays as , its first derivatives as , and second derivatives as . This polynomial decay contrasts with the exponential decay of the Matérn and squared exponential families. Heavy tails allow the kernel to capture long-range basin structure from sparse path data, and the augmented kernel matrix remains better conditioned than exponentially decaying counterparts. Including derivative observations effectively triples the information content per sampled geometry without additional energy evaluations.
The hyperparameter optimization follows the subset optimization [12] concept from the OT-GPD, here, the points from the final path are used to calculate the length and noise scales, which are subsequently applied while fitting the entire surface. This subsampled approach reduces computational cost from to where (typically vs ), while simultaneously improving robustness by isolating hyperparameter learning from transient optimization dynamics.
The resulting interpolated surface enables direct overlay of reference structures (e.g., DFT-optimized saddle points) onto MLIP-generated landscapes. Visual assessment of whether a potential captures qualitatively correct barrier topology becomes possible even when geometric displacements occur, a capability impossible with 1D energy profiles where the reaction coordinate axis itself depends on path geometry. This addresses a critical gap in current MLIP validation workflows.
2 Results

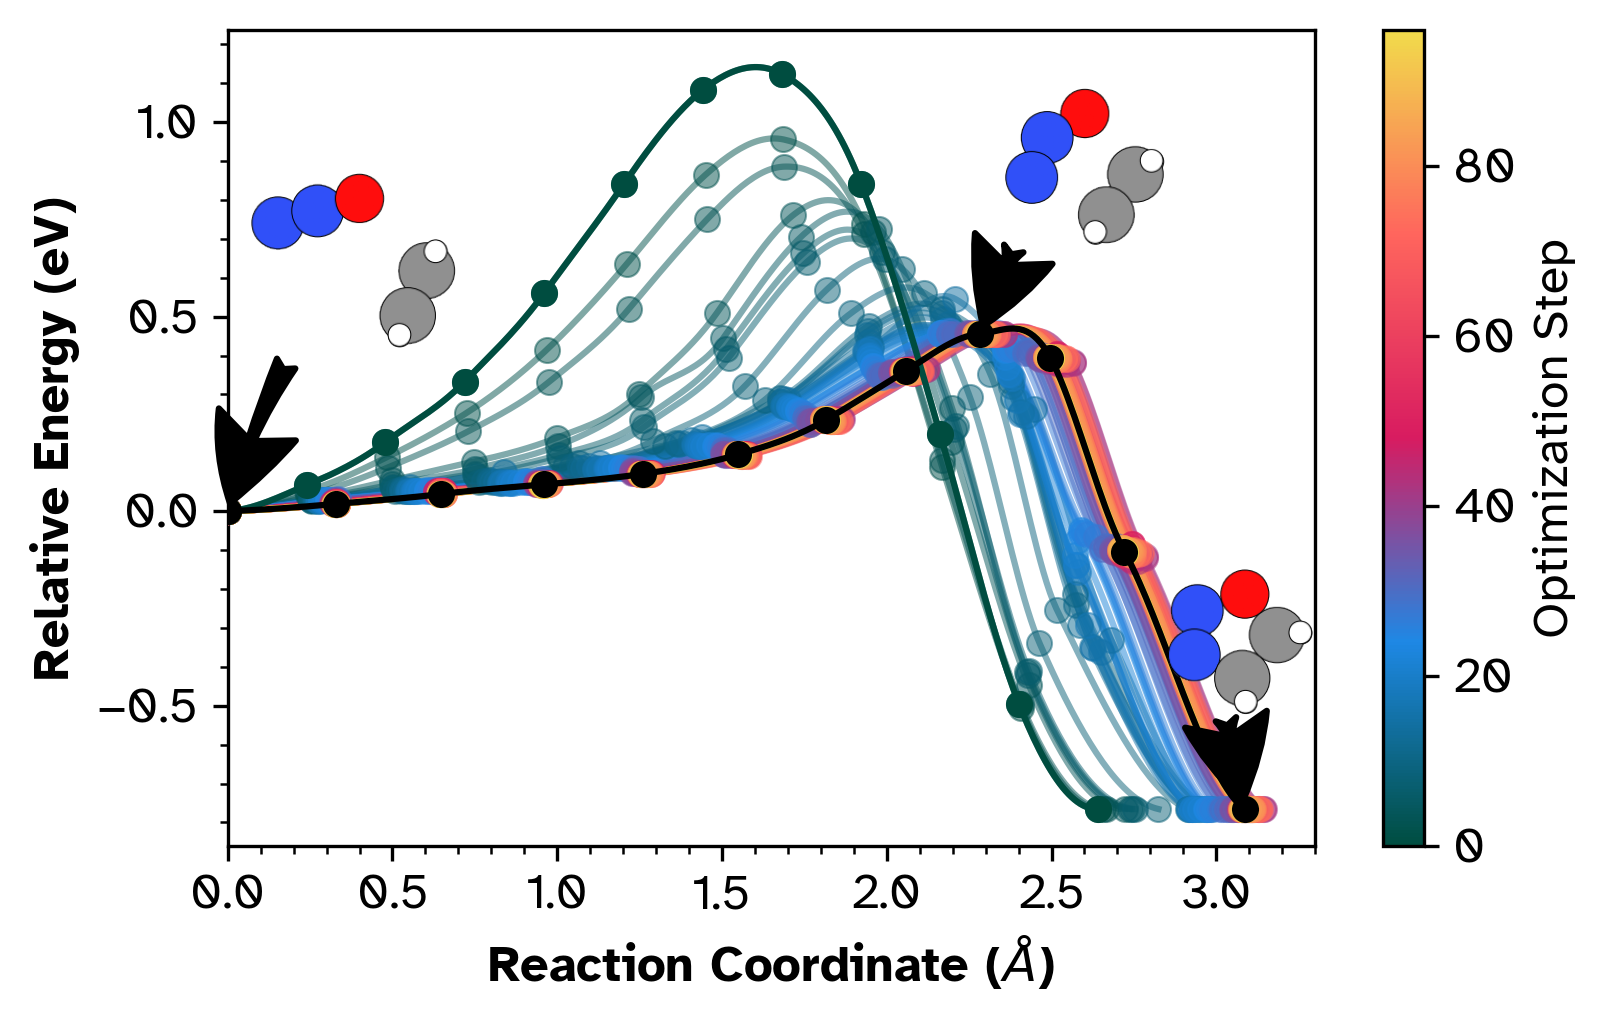
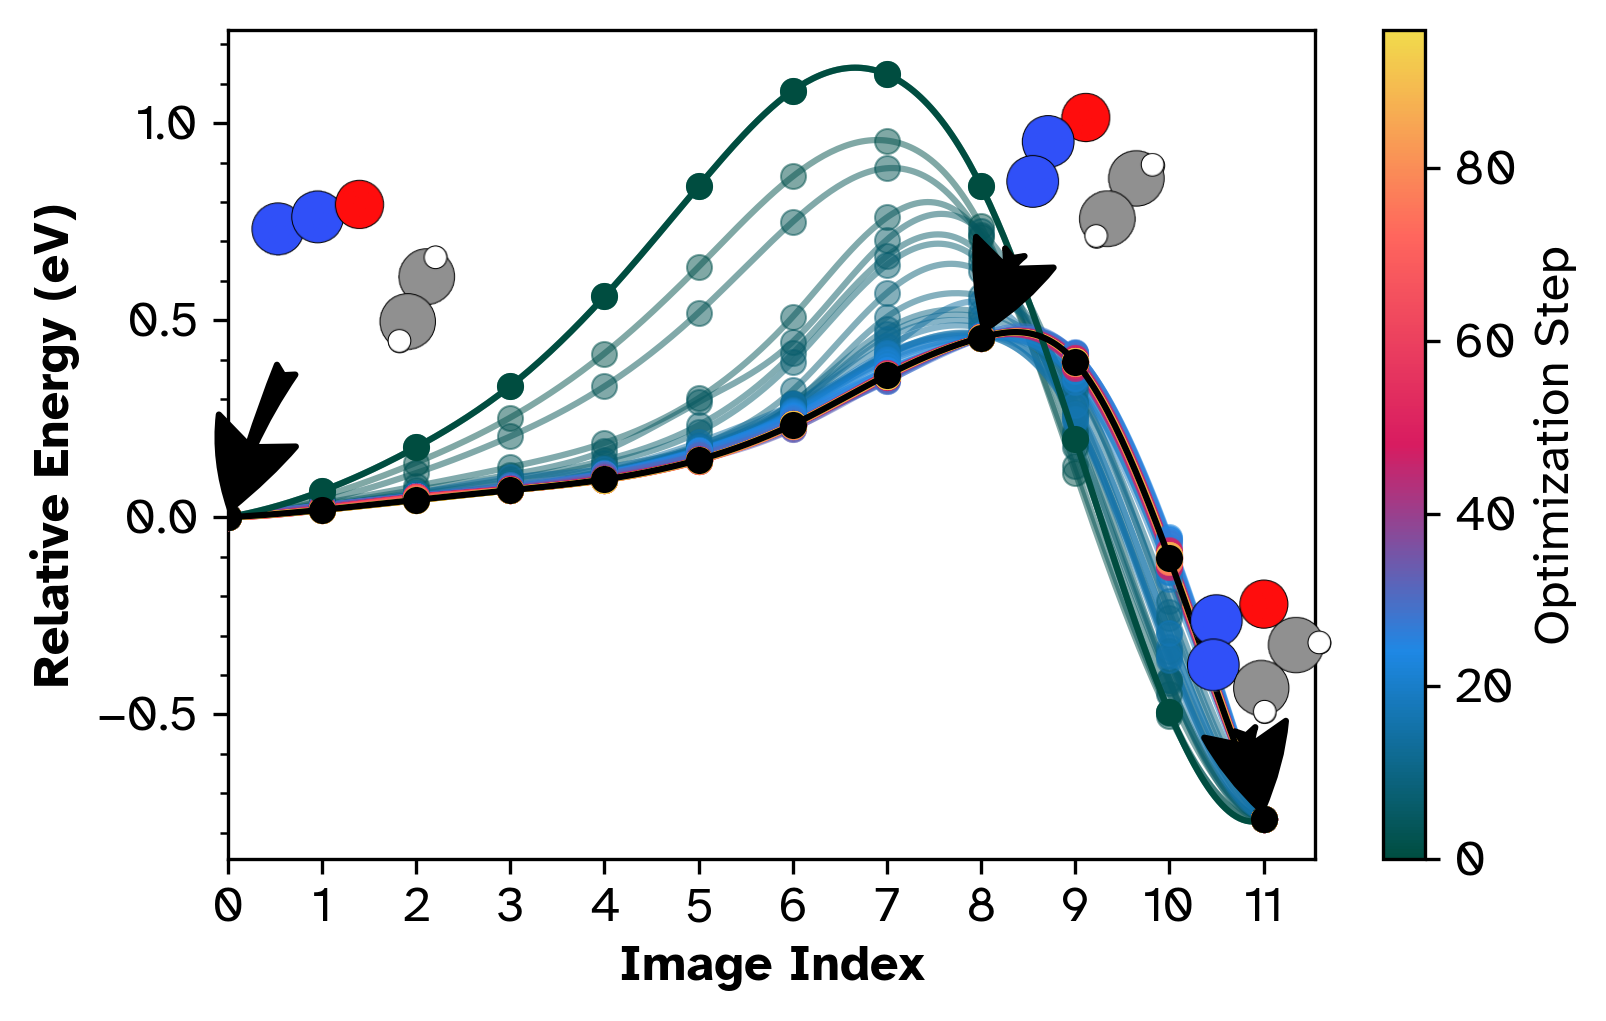
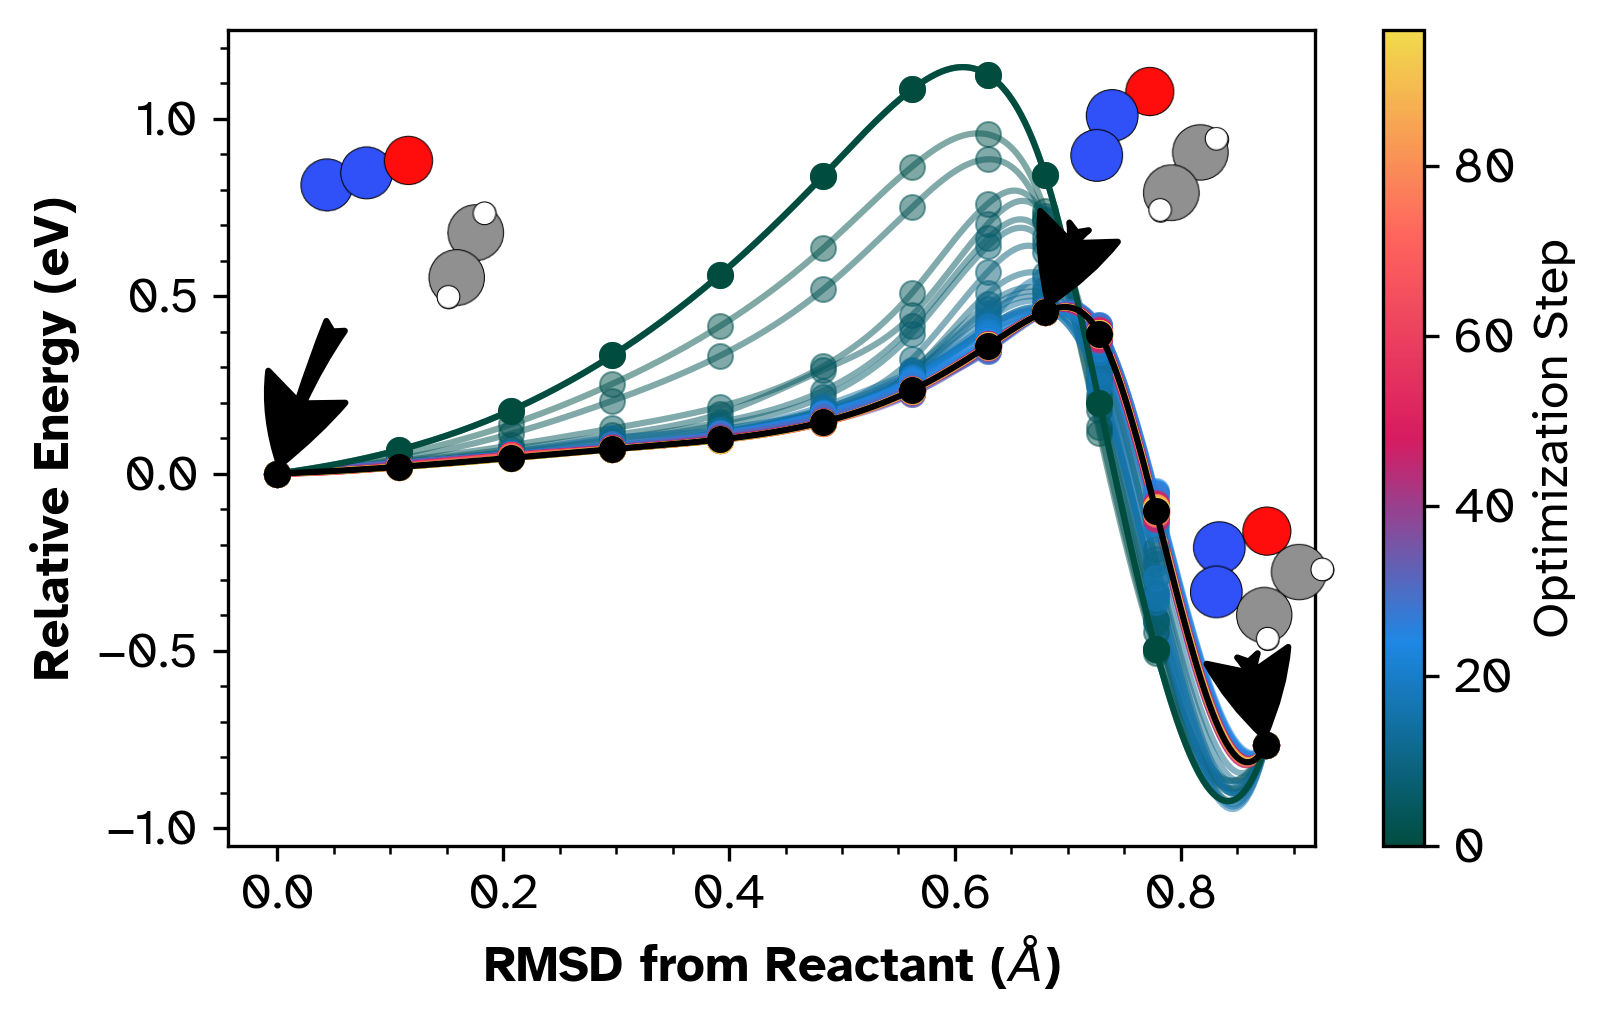
We validate the framework, first contrasting against 1D profiles for a the 1,3-dipolar cycloaddition of ethylene and N2O forming 4,5-dihydro-1,2,3-oxadiazole, a well-studied benchmark reaction for NEB method development [20, 1, 3, 24, 29, 5]. Figure 1 compares conventional one-dimensional representations with the two-dimensional RMSD projection for energy-weighted NEB optimization in eOn [10] 222from https://eondocs.org using the PET-OMAT machine-learned potential [25, 4] using Metatomic [3]. The model has been trained on PBE reference data from the Open Materials dataset [2], with full construction details in the associated publication. For the cycloaddition, we contrast this with a saddle optimized from a different NEB calculation using the B3LYP functional in ORCA [1] projected onto the interpolated landscape.
The conventional profiles (Fig.1, bottom) show optimization from an initial barrier of approximately 1.1 eV to a final value near 0.4 eV over 120 steps, with the product lying approximately 0.8 eV below the reactant. The final path appears smooth and well-converged. These representations provide no information about sampling quality or the broader landscape topology.
The two-dimensional RMSD projection (Fig.1, top) provides some more insight. First, sampled structures (black dots) cluster tightly along the converged path, confirming robust single-pathway convergence. Second, the interpolated energy surface displays clear landscape topology: a barrier region (yellow/orange, approximately 0.4eV) separating the reactant basin (upper-left) from the deeper product basin (blue, lower-right). The projection reveals that the ORCA saddle configuration overlaps with the estimate from the MLIP.
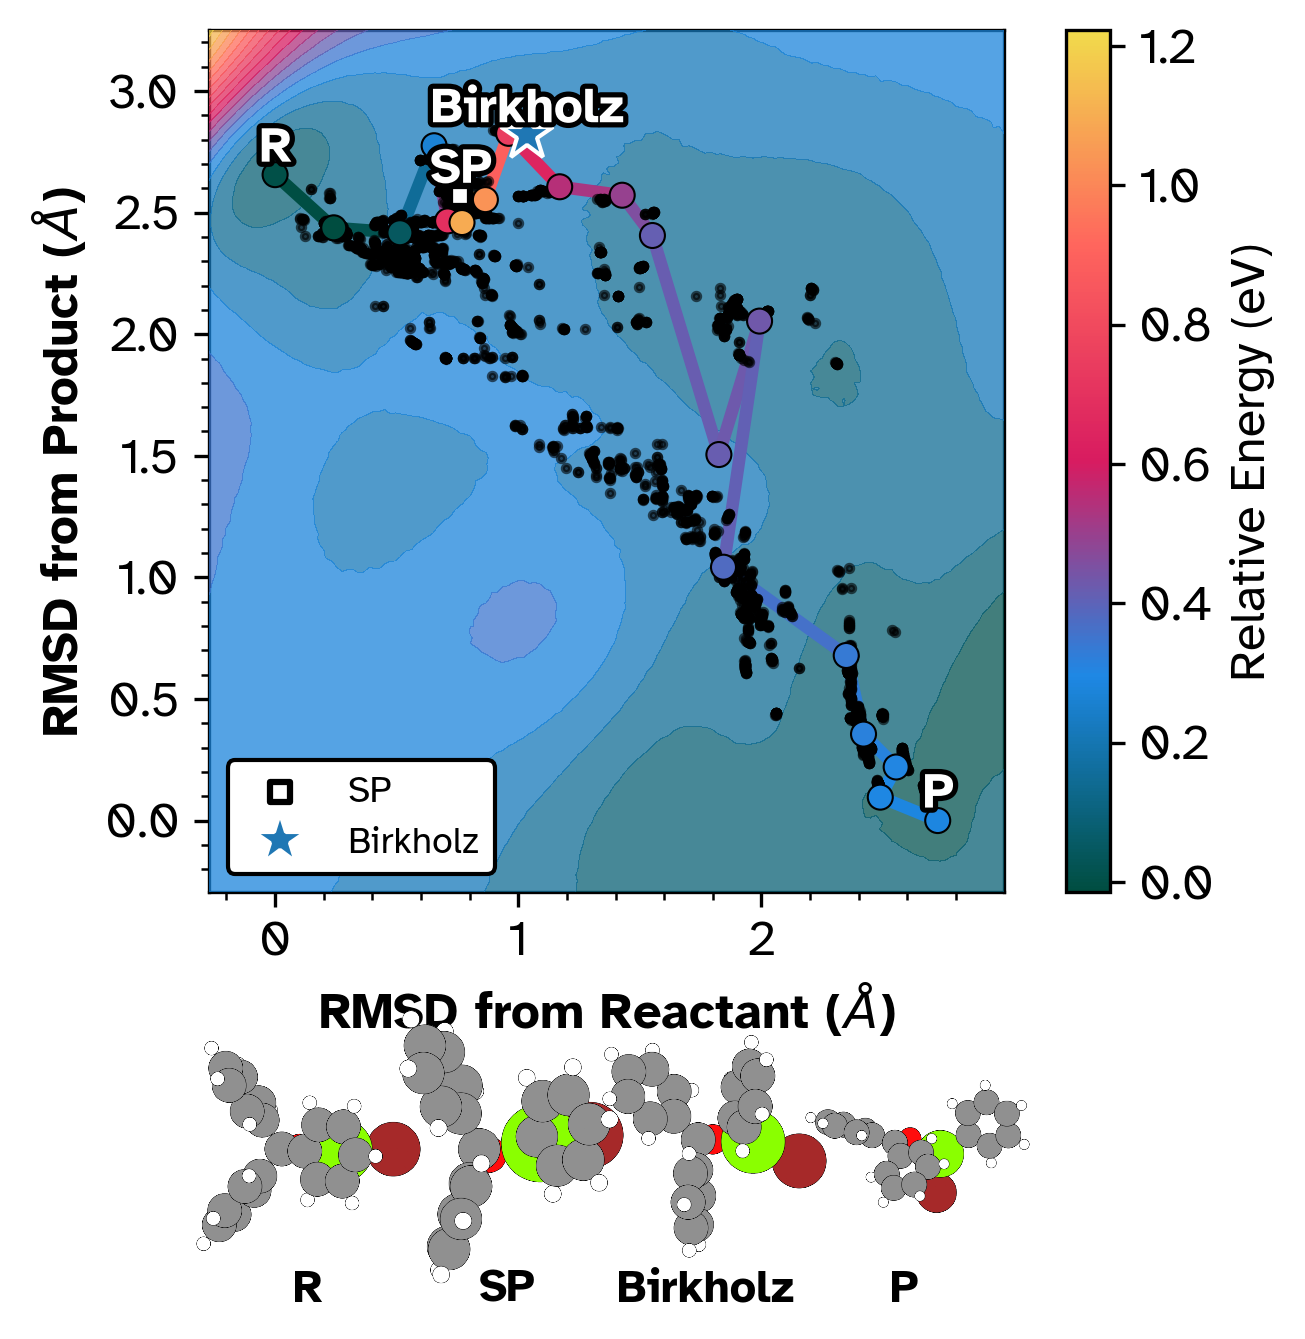

To demonstrate robustness on non-trivial topologies, we analyze the Grignard rearrangement of (Z)-2-phenyl-2-((trimethylsilyl)oxy)hex-4-enenitrile [5] and the electrocyclic ring opening of bicyclobutadiene (Figure 2) [24]. Unlike the linear character of the cycloaddition, these reactions proceed through significant geometric turns. The Grignard pathway (Figure 2a) exhibits a curved trajectory where the path tangent rotates nearly 90 degrees in the plane. The 2D projection clearly captures the optimization noise (scattered black points) in the solvent-mediated reactant region, a diagnostic feature lost in scalar reaction coordinate plots, while demonstrating without explicitly needing to study the structures, the fact that they lie on the same energy contour. Similarly, the bicyclobutadiene isomerization (Figure 2b) displays a sharp geometric “elbow” immediately following the transition state. The interpolated surface correctly places the reference Free String Method (mlFSM) saddle [24] within the barrier region of the MLIP. This confirms that the NEB trajectory found the physically relevant saddle despite the complex topology, a validation that remains ambiguous when observing only the image index or scalar reaction coordinate 333or in practice, would involve normal mode analysis, barrier heights, RMSD, and visual inspection.
To be explicit about what the 2D projection provides beyond standard scalar comparisons: computing energy differences and RMSD values between two saddle points tells one that they differ, but not how they differ relative to the reaction landscape. A 1D energy profile, by construction, collapses all geometric information onto the cumulative displacement axis, making it impossible to distinguish whether two saddle estimates from different methods lie on the same energy contour, sit in different basins, or whether the optimization explored alternative pathways before converging. The 2D projection preserves these geometric relationships. One can immediately see, for example, that the ORCA and MLIP saddles in Figure 1 occupy the same barrier region despite different path histories, or that the optimizer noise in the Grignard case (Figure 2a) is confined to a specific geometric region rather than distributed along the path. These are qualitative assessments, analogous to plotting a trajectory on a map rather than reporting only the total distance traveled.
Furthermore, this framework provides a unified coordinate system for validating potential energy surfaces against higher-level theory. If these disagree, the relative differences between the saddles are apparent. The projections reveal whether resulting structures sit within comparable energy contours. Such an analysis, checking if the energy surface captures the qualitative barrier topology even if the precise saddle geometry differs due to functional sensitivity, is impossible with conventional one-dimensional profiles.
For complete reproduction, the materials archive includes both exact commands, and outputs at the time of submission.
Limitations
The projection is a lossy map from to . Multiple distinct Cartesian configurations can share the same RMSD coordinates, so the interpolated energy surface does not reconstruct the true PES but rather a projected slice of it. Apparent features far from the sampled data, for instance, alternative low-energy pathways visible in the color map, may not correspond to physical pathways in the full configuration space. The interpolation should be read as a qualitative guide near the data, not as a quantitative surrogate for the potential.
Because only the tangential force component enters the gradient projection, the method does not recover curvature information orthogonal to the path. In the full $3N$-dimensional PES, MEP images are by definition minima in the hyperplane orthogonal to the path. This property cannot be enforced or verified in the 2D projection without the Jacobian , which is unavailable in closed form due to the rotation-permutation minimization. Any extension to orthogonal force projection would require differentiable structure matching, which is an open problem.
The choice of IMQ kernel, while theoretically motivated by its positive definiteness and polynomial tail properties, is one of several valid options. The software provides squared exponential, Matern 5/2, and thin plate spline alternatives. Different kernels may be better suited to different reaction topologies, and no single kernel is universally optimal.
Finally, the method is designed for post-hoc visualization of existing calculations. It does not accelerate the NEB computation itself, nor does it replace quantitative analysis (normal mode analysis, barrier heights, vibrational frequencies) required for kinetic rate calculations.
Conclusion
We presented a coordinate-free visualization method for analyzing reaction path optimization trajectories. By projecting high-dimensional pathways onto a surface defined by permutation-invariant RMSD coordinates, the method reveals geometric and energetic features obscured by standard one-dimensional profiles.
In current practice, comparing NEB results across methods or potentials requires either pointwise structural inspection (impractical beyond a handful of images) or scalar summaries (barrier height, RMSD to reference) that discard geometric context. The 2D projection provides a middle ground: a single plot that preserves the geometric relationship between all sampled structures, the converged path, and any reference points, while remaining interpretable at a glance. The benchmarks demonstrate that this representation distinguishes numerical artifacts from physical topology and reveals whether different potentials produce qualitatively similar barrier regions, even when the precise saddle geometries differ.
While we focus on double-ended methods here, the projection operates independently of the path generation algorithm. One can project histories from single-ended saddle search methods, molecular dynamics, or meta-dynamics onto these intrinsic axes post hoc to diagnose path quality and basin hysteresis. The relative energy surfaces from multiple machine learning models could also be compared within such a framework.
Conflict of Interest
We declare no conflicts of interest.
References
- [1] (2021-08) Nudged Elastic Band Method for Molecular Reactions Using Energy-Weighted Springs Combined with Eigenvector Following. Journal of Chemical Theory and Computation 17 (8), pp. 4929–4945. External Links: ISSN 1549-9618, Document Cited by: §2, Two-dimensional RMSD projections for reaction path visualization and validation.
- [2] (2024-10) Open materials 2024 (OMat24) inorganic materials dataset and models. arXiv. External Links: 2410.12771, Document Cited by: §2.
- [3] (2025-08) Metatensor and metatomic: foundational libraries for interoperable atomistic machine learning. arXiv. External Links: 2508.15704, Document Cited by: §2.
- [4] (2026-01) Pushing the limits of unconstrained machine-learned interatomic potentials. arXiv. External Links: 2601.16195, Document Cited by: §2.
- [5] (2015) Using bonding to guide transition state optimization. Journal of Computational Chemistry 36 (15), pp. 1157–1166. External Links: ISSN 1096-987X, Document Cited by: §2, §2.
- [6] (2003) Radial Basis Functions: Theory and Implementations. Cambridge Monographs on Applied and Computational Mathematics, Cambridge University Press, Cambridge. External Links: Document, ISBN 978-0-521-63338-3 Cited by: §1.2.
- [7] (2019-07) Optimizing many-body atomic descriptors for enhanced computational performance of machine learning based interatomic potentials. Physical Review B 100 (2), pp. 024112. External Links: Document Cited by: §1.1.
- [8] (2019-04) Unsupervised machine learning in atomistic simulations, between predictions and understanding. The Journal of Chemical Physics 150 (15), pp. 150901. External Links: ISSN 0021-9606, Document Cited by: §1.1.
- [9] (2018) Scaling gaussian process regression with derivatives. In Advances in Neural Information Processing Systems, S. Bengio, H. Wallach, H. Larochelle, K. Grauman, N. Cesa-Bianchi, and R. Garnett (Eds.), Vol. 31. Cited by: §1.2.
- [10] (2026-02) TheochemUI/eOn: v2.9.0.1. Note: Zenodo External Links: Document Cited by: §2.
- [11] (2026-01) Enhanced climbing image nudged elastic band method with hessian eigenmode alignment. arXiv. External Links: 2601.12630, Document Cited by: §1.1, Two-dimensional RMSD projections for reaction path visualization and validation.
- [12] (2025-11) Adaptive Pruning for Increased Robustness and Reduced Computational Overhead in Gaussian Process Accelerated Saddle Point Searches. ChemPhysChem. External Links: ISSN 1439-7641, Document Cited by: §1.2.
- [13] (2025-07) Efficient Implementation of Gaussian Process Regression Accelerated Saddle Point Searches with Application to Molecular Reactions. Journal of Chemical Theory and Computation. External Links: Document Cited by: §1.2.
- [14] (2025-05) Efficient implementation of gaussian process regression accelerated saddle point searches with application to molecular reactions. arXiv. External Links: 2505.12519, Document Cited by: Two-dimensional RMSD projections for reaction path visualization and validation.
- [15] (2021-11) IRA: a shape matching approach for recognition and comparison of generic atomic patterns. Journal of Chemical Information and Modeling 61 (11), pp. 5446–5457. External Links: ISSN 1549-9596, Document Cited by: §1.1.
- [16] (2000-11) A climbing image nudged elastic band method for finding saddle points and minimum energy paths. The Journal of Chemical Physics 113 (22), pp. 9901–9904. External Links: ISSN 0021-9606, Document Cited by: Two-dimensional RMSD projections for reaction path visualization and validation, Two-dimensional RMSD projections for reaction path visualization and validation.
- [17] (2013) An Introduction to Statistical Learning. Springer Texts in Statistics, Vol. 103, Springer New York, New York, NY. External Links: Document, ISBN 978-1-4614-7137-0 978-1-4614-7138-7 Cited by: §1.1.
- [18] (1998-06) Nudged elastic band method for finding minimum energy paths of transitions. In Classical and Quantum Dynamics in Condensed Phase Simulations, pp. 385–404. External Links: Document, ISBN 978-981-02-3498-0 Cited by: Two-dimensional RMSD projections for reaction path visualization and validation.
- [19] Algorithms for Optimization. Cited by: §1.2.
- [20] (2019-12) Nudged Elastic Band Calculations Accelerated with Gaussian Process Regression Based on Inverse Interatomic Distances. Journal of Chemical Theory and Computation 15 (12), pp. 6738–6751. External Links: ISSN 1549-9618, Document Cited by: §2, Two-dimensional RMSD projections for reaction path visualization and validation.
- [21] (2017-06) The atomic simulation environment—a Python library for working with atoms. Journal of Physics: Condensed Matter 29 (27), pp. 273002. External Links: ISSN 0953-8984, Document Cited by: footnote 1.
- [22] (2021-08) A modified nudged elastic band algorithm with adaptive spring lengths. Journal of Chemical Physics 155 (7), pp. 74103. External Links: ISSN 0021-9606, Document Cited by: §1.1.
- [23] (1996-03) Kriging and splines with derivative information. Biometrika 83 (1), pp. 207–221. External Links: ISSN 0006-3444, Document Cited by: §1.2.
- [24] (2025-11) Incorporation of Internal Coordinates Interpolation into the Freezing String Method. Journal of Chemical Theory and Computation. External Links: ISSN 1549-9618, Document Cited by: §2, §2, Two-dimensional RMSD projections for reaction path visualization and validation.
- [25] (2025-11) PET-MAD as a lightweight universal interatomic potential for advanced materials modeling. Nature Communications 16 (1), pp. 10653. External Links: ISSN 2041-1723, Document Cited by: §2.
- [26] (2018-12) UMAP: Uniform Manifold Approximation and Projection for Dimension Reduction. arXiv:1802.03426 [cs, stat]. External Links: 1802.03426 Cited by: §1.1.
- [27] (2023-02) Learning local equivariant representations for large-scale atomistic dynamics. Nature Communications 14 (1), pp. 579. External Links: ISSN 2041-1723, Document Cited by: §1.1.
- [28] (2004-05) A growing string method for determining transition states: Comparison to the nudged elastic band and string methods. The Journal of Chemical Physics 120 (17), pp. 7877–7886. External Links: ISSN 0021-9606, 1089-7690, Document Cited by: Two-dimensional RMSD projections for reaction path visualization and validation.
- [29] (2022-05) Protocol for Directing Nudged Elastic Band Calculations to the Minimum Energy Pathway: Nurturing Errant Calculations Back to Convergence. Journal of Chemical Theory and Computation 18 (5), pp. 2993–3005. External Links: ISSN 1549-9618, Document Cited by: §2.
- [30] (1938) Metric Spaces and Completely Monotone Functions. Annals of Mathematics 39 (4), pp. 811–841. External Links: 1968466, ISSN 0003-486X, Document Cited by: §1.2.
- [31] (2012-04) Using sketch-map coordinates to analyze and bias molecular dynamics simulations. Proceedings of the National Academy of Sciences 109 (14), pp. 5196–5201. External Links: Document Cited by: §1.1.
- [32] (2008) Visualizing Data using t-SNE. Journal of Machine Learning Research 9 (Nov), pp. 2579–2605. External Links: ISSN ISSN 1533-7928 Cited by: §1.1.
- [33] (2018) Exploring Energy Landscapes. Annual Review of Physical Chemistry 69 (1), pp. 401–425. External Links: Document Cited by: §1.1.
- [34] (2013-05) Growing string method with interpolation and optimization in internal coordinates: Method and examples. The Journal of Chemical Physics 138 (18), pp. 184102. External Links: ISSN 0021-9606, Document Cited by: Two-dimensional RMSD projections for reaction path visualization and validation.