Infrared Signatures of Dusty Tori Formed by MHD-Driven Outflows
We investigate the radial structure of active galactic nuclei (AGN) dusty tori by forward-modeling mid-infrared (MIR) spectra observed with JWST/MIRI-MRS for a sample of 25 AGN. We develop a physically motivated three dimensional radiative transfer framework to test various magnetohydrodynamic (MHD) wind scenarios characterized by radial density laws of the form for . Our Bayesian analysis reveals a pronounced structural dichotomy rather than a single universal density law: a majority (14/25) of the sources favor the flattest profile (), while a significant minority (8/25) statistically prefers the steepest, most compact distribution (). We also identify a systematic redward shift in the silicate emission peak, consistent with the presence of micron-sized, processed grains in the inner regions of the wind. Critically, we find that the inferred AGN fractional contribution, , is highly sensitive to the assumed radial index, exhibiting up to a four-fold systematic shift between and . This p-degeneracy highlights that static structural assumptions can significantly bias AGN power estimates. The identified structural diversity suggests that MHD-driven winds may exist in multiple dynamical states, though the precise physical drivers governing these configurations remain to be uniquely determined. These results underscore the limitations of single-profile models and emphasize the need for high-resolution spatial constraints to break these fundamental degeneracies.
Key Words.:
galaxies: active – dust, extinction – radiative transfer – methods: numerical – infrared: galaxies1 Introduction
Interstellar dust plays a crucial role in galaxy evolution by regulating the exchange of energy and matter and reprocessing stellar radiation into the infrared (Draine, 2003; Zubko et al., 2004; Hauser and Dwek, 2001). Despite its importance, a fundamental tension persists between the observed vast quantities of dust and the limited production capacity of known stellar sources, a mismatch known as the ’dust budget crisis’ (Dwek and Cherchneff, 2011; Jones and Nuth, 2011). This crisis is particularly acute in extreme environments like AGN, where dust not only survives intense radiation and strong outflows but is also central to the AGN unification model. In this framework, an optically thick dusty structure, often called a dusty torus, is responsible for the observational dichotomy between type 1 and type 2 AGNs (Antonucci and Miller, 1985; Pier and Krolik, 1992).
The classical view of a smooth, monolithic dusty torus in AGNs has been challenged by high-resolution interferometric observations, which instead reveal a clumpy, dynamic, and non-axisymmetric structure (Jaffe and others, 2004; Tristram and others, 2007). The survival and replenishment of these dust clumps in close proximity to the central engine deepen the puzzle of the dust budget. This has motivated sophisticated models that incorporate turbulence, radiation pressure, and magnetic fields to explain the structure and kinematics of the torus (Wada and others, 2009; Elvis and others, 2002). Critically, these findings raise the possibility of in-situ dust formation within the AGN environment itself, moving beyond a sole reliance on stellar ejecta.
The dust budget crisis is at its most extreme in the early universe. For instance, the quasar SDSS J1148+5251, seen when the universe was very young (), contains a staggering dust mass (), which is about 100 times more than all the stars in that galaxy could possibly have produced (Valiante and others, 2011). The light from these ancient galaxies shows strong signs of silicate dust, similar to local AGNs, but suggests a distinct chemical evolution compared to typical star-forming galaxies at lower redshifts (Galliano et al., 2018; Imanishi et al., 2023). This suggests that most of this early dust was not made in stars at all, but formed rapidly in powerful outflows driven by magnetic fields, an idea that could fundamentally alter our understanding of how the first galaxies grew (Everett, 2005; Gall et al., 2011).
In nearby systems such as NGC 1068, observations provide detailed images of AGN dust structures. Strong 9.7 m silicate absorption and polarized broad-line emission indicate a geometrically and optically thick dusty torus (Antonucci, 1993; Tristram and others, 2007). ALMA observations reveal a ring-shaped magnetic field of 10 mG driving molecular outflows at velocities up to 500 km s-1, consistent with magnetocentrifugal wind models (Lopez-Rodriguez and others, 2020; Blandford and Payne, 1982a). Similar high-velocity molecular outflows are seen in high- quasars like Mrk 231, likely driven by both radiation pressure and MHD mechanisms (Veilleux and others, 2020; Wada, 2012). These outflows are often modeled with the dust density law and , in agreement with X-ray and IR observational constraints (Behar and others, 2009; Tristram and others, 2007; Sarangi et al., 2019). More generally, the radial distribution of dusty gas in disk-wind/torus models is uncertain and is frequently parameterized as a power law, (Narayan and Yi, 1994; Narayan et al., 2000; Nenkova et al., 2008b; Lopez-Rodriguez et al., 2015; Hönig and Kishimoto, 2010; García-González et al., 2017). Motivated by this, we compare four representative indices, and , and assess which density law best reproduces the infrared constraints. The parameter is introduced as an effective index to account for uncertainties in the radial distribution of the dusty material within the outflow or obscuring medium.
Beyond dynamics, AGN dust exhibits distinctive chemical compositions. Crystalline silicates, rare in the general ISM, can reach up to 20% abundance in AGN environments, possibly forming via non-equilibrium condensation in hot outflows (García-Burillo and others, 2021). Carbonaceous dust is also often enhanced, with elevated C/Si mass ratios and dust-to-gas ratios up to ten times those in the typical ISM (Shi and others, 2006; Gallimore and others, 2016). These findings suggest a multi-component dust structure: silicates dominate MIR absorption, carbonaceous grains control UV obscuration, and small grains contribute to the overall infrared emission.
The observed infrared emission from a galaxy’s circumnuclear region typically has two primary contributors: thermal radiation from AGN-heated dust and light from starburst (SB). Ignoring the contribution from a SB can severely bias the interpretation of AGN spectra, as features like PAH emission lines and the cooler continuum are often misattributed to the central engine. Such contamination distorts key derived properties—including silicate feature strength, viewing angle, and extinction—while also affecting energy budgets and the classification of the system’s dominant power source (Genzel et al., 1998; Spoon et al., 2007). Consequently, it has become standard practice to explicitly model the SB component in infrared diagnostics to separate the host and nuclear emission in integrated spectra, thereby reducing systematic errors from component mixing (Laurent et al., 2000; Nardini et al., 2008).
In summary, a comprehensive model of the AGN dusty torus must simultaneously address three integrated physical components: the intrinsic dust microphysics, the disentanglement of circumnuclear star formation, and the anisotropic radiation field of the MHD wind models provide a promising dynamical framework for such structures, the resulting radial density distribution () remains a subject of active debate. Although a self-similar solution typically suggests , the complex interplay between magnetic driving, radiation pressure, and gravitational confinement may lead to a broader range of structural configurations.
The primary contribution of this work is the development of a physically motivated 3D radiative transfer framework for dusty AGN tori, where the optical depth is self-consistently computed from a parameterized MHD wind density field. We use this framework to construct an extensive library of torus spectral energy distributions (SEDs) and forward-model rest-frame MIR spectra observed with JWST/MIRI-MRS for a sample of 25 AGN. By performing a detailed Bayesian decomposition, we assess whether a universal density law can describe the circumnuclear dust or if a structural dichotomy exists among the sample. Furthermore, we quantify the systematic -degeneracy between the radial density law and the inferred AGN fractional contribution (), providing a quantitative basis for interpreting high-quality JWST MIR observations.
The paper is arranged in the following order. In Section 2 we describe the physical and computational details of our model. In Section 3 we present the results of our simulations, including the application of our models to observational data. Finally, in Section 4, we discuss the implications of our work and present our conclusions.
2 Model
2.1 AGN

We model the AGN as a central supermassive black hole (SMBH) surrounded by a geometrically thin, optically thick accretion disk and an X-ray emitting hot corona (Fig. 1). The disk emission is described by a thermal component, while the coronal continuum is represented by a power law produced by inverse-Compton scattering of disk photons (Shakura and Sunyaev, 1973; Haardt and Maraschi, 1993). The balance between these two components, often characterized by the optical-to-X-ray spectral index (), determines the overall shape of the continuum (Lusso et al., 2016). The resulting SED shape is assumed to be independent of viewing angle (Fig. 2; Sarangi et al. 2019); only the bolometric luminosity varies with inclination.
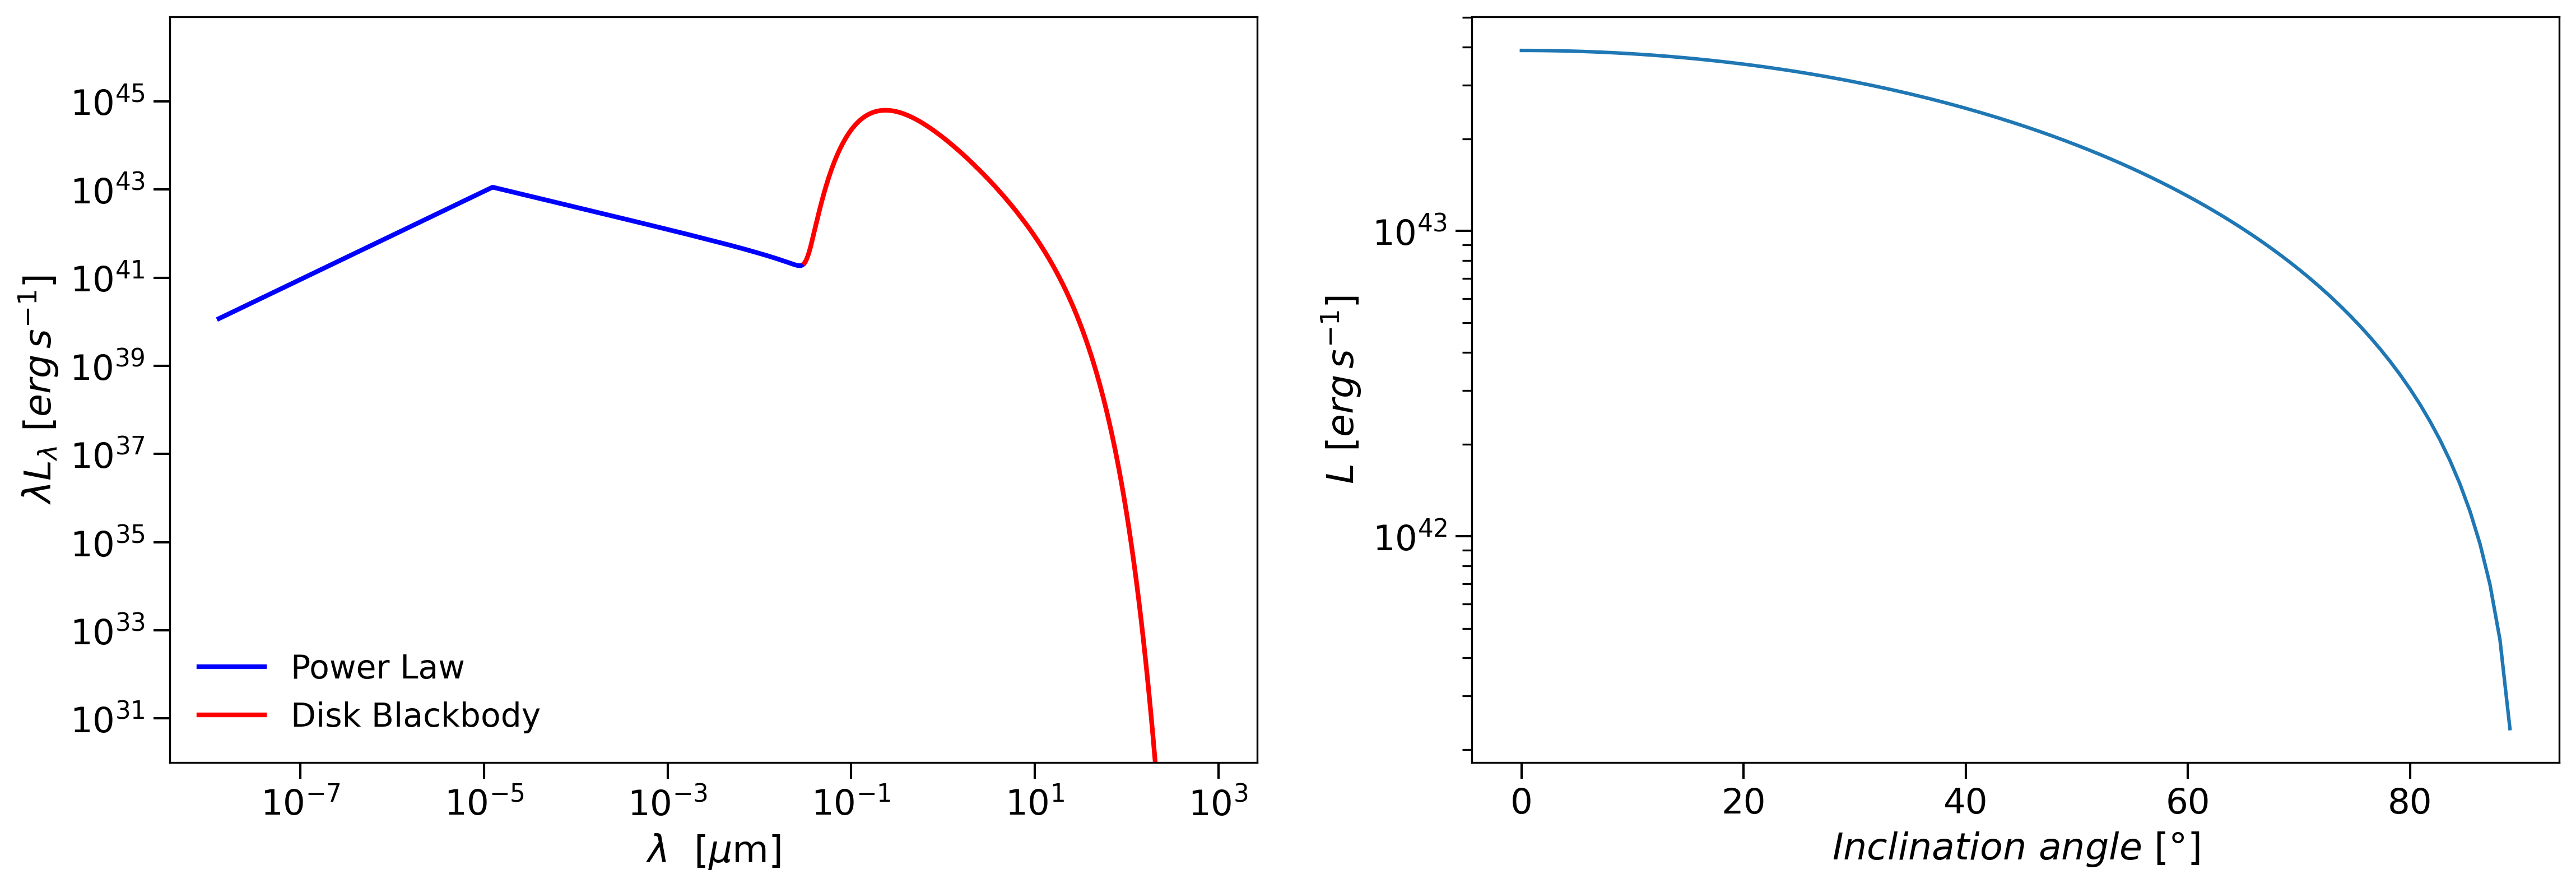
To account for anisotropic emission from a disk-like source, we scale the emitted luminosity with polar angle as
| (1) |
where denotes the radiative efficiency (typically ranging from 0.1 to 1), and is the normalized accretion rate. The Eddington accretion rate is defined as , with representing the Eddington luminosity, which scales linearly with the black hole mass . For convenience, the black hole mass is expressed in units of (Sarangi et al., 2019). The angular modulation is described by (Netzer, 1987; Stalevski et al., 2012)
| (2) |
2.2 Dust in the dusty torus
The dusty torus in AGN is located close to the central engine and is subject to intense radiation fields. With a typical spatial extent of only a few tens of parsecs, direct observational constraints on the dust composition, size distribution, and spatial structure remain limited due to current resolution capabilities. Although recent advances in infrared interferometry and high-resolution imaging have improved our understanding of the torus morphology, detailed information about the physical nature of the dust grains remains elusive.
Given these observational limitations, many theoretical models have historically relied on simplified dust properties analogous to those of the diffuse ISM. These typically consist of a mixture of silicate and amorphous carbon grains, following the standard Mathis, Rumpl, and Nordsieck (MRN) power law size distribution () (Mathis et al., 1977). While these simplified, ISM-like dust models do not capture the full complexity of AGN environments, they provide a robust baseline for isolating the effects of other key parameters. By establishing a physically motivated foundation that can reproduce the average AGN SED, such models are ideal for exploring the impact of torus geometry and the radiation field. Therefore, in this study, we adopt a standard ISM-based dust model to specifically investigate how changes in the torus structure and its irradiation shape the emergent infrared emission.
2.2.1 Dust properties
We adopt the Astrodust grain model of Draine and Hensley (2021) for the dusty torus. The corresponding optical properties reproduce the main MIR silicate features commonly discussed in AGN torus models (e.g. Fritz et al., 2006; Draine and Li, 2007; Nenkova et al., 2008a). We use the Astrodust material density .
For a grain size distribution discretized in bins , we compute the mass-weighted absorption coefficient as
| (3) |
with
| (4) |
where is the mass of a grain of size and is the corresponding number density.
Since scattering is not treated explicitly, we approximate its impact on attenuation by adopting the effective absorption coefficient (Rybicki and Lightman, 1979)
| (5) |
Figure 3 shows for selected grain sizes and for the full size distribution used in this work (Hensley and Draine, 2023).

2.2.2 Dusty torus geometry
The geometry of the dusty torus is primarily governed by the physical conditions required for dust survival and by dynamical constraints imposed by the environment. The innermost boundary of the dusty structure is set by the dust sublimation radius, which corresponds to the location where the heating and cooling of dust grains are in radiative equilibrium. Dust grains can survive at this radius provided their temperature does not exceed the sublimation threshold (Dwek, 1987).
The radiative heating rate of dust grains at a distance from the central source and at an inclination angle is given by
| (6) |
where is the average mass and is the monochromatic luminosity of the central source as seen from angle . The corresponding cooling rate due to thermal re-emission is
| (7) |
where is the Planck function at the dust temperature . By equating the heating and cooling terms, the dust sublimation radius for a temperature of can be expressed as
| (8) |
This defines the inner radius, , at which dust grains can remain thermally stable without sublimating under the incident radiation field. The sublimation zone, defined by , is clearly separated from the condensation zone () by a distinct boundary. Dust formation and survival are only permitted in the condensation zone, where thermal conditions allow for stable grain existence.
The spatial extent of the torus is set by its inner and outer radii. The outer radius is parameterized as
| (9) |
where is a dimensionless radial extent parameter (Table 1). We assume an axisymmetric torus with a half-opening angle ; the polar cone () is taken to be dust-free.
2.2.3 Dust spatial distribution and density laws
The torus emission depends sensitively on how dust is distributed in space. In wind-driven scenarios, dust is expected to be embedded in the outflowing gas and approximately co-spatial with it over the region where grains can survive. We therefore prescribe the gas density structure and convert it to a dust density via a constant dust-to-gas mass ratio, .
We adopt a parameterized density law motivated by the self-similar MHD disk-wind solution of Fukumura et al. (2010). We assume axisymmetry and define the dimensionless radius , where is the Schwarzschild radius of the central black hole. In spherical coordinates , the hydrogen nuclei number density is written as
| (10) |
where is a normalization constant, . The parameter controls the radial density gradient. We adopt as a fiducial value, corresponding to the standard scaling for magnetocentrifugal disk winds (Blandford and Payne, 1982b; Sarangi et al., 2019). For comparison, approaches the behavior of an isotropic constant-velocity outflow (Elvis, 2000). We additionally explore intermediate/shallower cases ( and ) to span a broader range of gradients commonly adopted in dusty torus models (e.g., Fritz et al., 2006; Stalevski et al., 2012; Everett, 2005).
Changing at fixed normalization modifies not only the radial distribution but also the total column intercepted along a given direction. To isolate the effect of the density gradient, we enforce that the radial hydrogen column density
| (11) |
is conserved at each polar angle relative to the fiducial model. This requirement sets the -dependent normalization factor to
| (12) |
so that . With this choice, models with different share the same (for fixed ) while differing only in how that column is distributed with radius.
In the shielded dusty regions relevant for the torus, the gas mass is dominated by hydrogen; we therefore identify . The dust mass density is then
| (13) |
where is the mass of a hydrogen atom. We explore in the range –, spanning from dust-poor environments to approximately solar-metallicity conditions (e.g., Draine and Li, 2007; Rémy-Ruyer et al., 2014; Valiante and others, 2011). The full set of model parameters is summarized in Table 1.
| Parameter | Adopted values |
|---|---|
| -2.0, -2.4, -2.8, -3.2, -3.6, -4.0 | |
| 0.3 | |
| -1.5 | |
| 20, 30, 40, 50, 60 | |
| 0,10,20, 30, 40, 50,60,70, 80, 90 | |
| 20, 60, 100,140,180 |
2.2.4 Radiative Transfer Modeling
We compute the dust temperature distribution and emergent SEDs with a deterministic 3D ray-tracing scheme on an axisymmetric dusty torus. The dust optical properties are taken from the Astrodust mixture (Section 2.2.1). Throughout the radiative transfer we use a wavelength-dependent effective opacity, , evaluated with the same mass-weighted prescription as Eq. (3) but using the effective cross sections adopted in our scheme. For a dust mass column density , the optical depth is
| (14) |
At each location the dust temperature is obtained by imposing local radiative equilibrium. Using the heating and cooling rates (Eqs. 6 and 7), we solve for such that absorbed and emitted power balance.
Synthetic SEDs are computed by a formal solution along rays toward an observer at viewing angle . The total observed luminosity is obtained by summing the contribution of all volume elements, where each cell emits thermally and is attenuated by the optical depth accumulated from the cell to the outer boundary along the line of sight. Denoting the dust mass density by , the cell emissivity is taken to be proportional to . The emitted luminosity can be written as
| (15) |
The computational domain is discretized on a spherical polar grid with logarithmic spacing in to resolve the strong gradients near the sublimation front. In the calculations presented here we use , , and .
As a consistency check, we verify global energy conservation by confirming that the total absorbed primary luminosity is balanced by the integrated dust infrared emission.
2.3 Starburst
Table 2 lists the J2000 coordinates and systemic redshifts (z) of the galaxies used as SB templates in this work. With the exception of Arp 220, M 82, and NGC 253, all objects are selected from the Spitzer/IRS starburst sample of Brandl et al. (2006) and are classified there as starburst‑dominated systems. In our analysis, these templates provide only the SED shapes; the absolute normalization is determined during the fit to each target.
In addition, we include three well-studied systems, Arp 220, M 82, and NGC 253, as representative SB templates. Arp 220 is an ultraluminous infrared galaxy (ULIRG), , from a late-stage merger with extreme dust obscuration and a very compact nuclear starburst; its MIR shows deep 9.7 m silicate absorption and weak apparent PAH features, and its SED peaks sharply in the far-IR (Sanders and Mirabel, 1996; Downes and Solomon, 1998; Polletta et al., 2007). M 82 is the nearby prototypical starburst, with strong PAH emission, prominent MIR fine-structure lines, moderate silicate absorption, and a relatively warm far-IR color; we follow common empirical representations (Silva et al., 1998; Förster Schreiber et al., 2003; Polletta et al., 2007). NGC 253 is a nearby dusty nuclear starburst with strong PAH features and bright far-IR/submillimeter emission; its Spitzer/IRS spectrum places it firmly among starburst-dominated systems (Brandl et al., 2006; Radovich et al., 2001; Dale et al., 2012). Together these three templates span a useful range of obscuration, PAH strength, and dust temperature, and thus provide complementary SED shapes for our fits.

| Object | RA (J2000) | Dec (J2000) | |
|---|---|---|---|
| Arp 220 | 15:34:57.2 | +23:30:11 | |
| M 82 | 09:55:52.7 | +69:40:46 | |
| Mrk 52 | 12:25:42.7 | +00:34:20 | |
| NGC 253 | 00:47:33.1 | 25:17:18 | |
| NGC 1614 | 04:33:59.8 | 08:34:44 | |
| NGC 7714 | 23:36:14.1 | +02:09:19 | |
| IRAS 172080014 | 17:23:21.9 | 00:17:00 |
Fig. 4 compares these three representative SB templates after uniform preprocessing and normalization. All spectra have been shifted to the rest frame and resampled onto our fitting wavelength grid. For visualization, each template is normalized by its rest-frame flux density at m, , so that the curves intersect at unity at m; the absolute scaling is free in the fits. Vertical dashed lines mark the principal PAH and silicate features.
In the following section we describe how these SB templates are combined with the AGN and BB components and fit to the JWST/MRS spectra.
2.4 Spectral decomposition and Bayesian grid inference
To constrain the physical conditions in the AGN circumnuclear region, we decompose the rest-frame – spectra into a linear combination of three physically motivated components: (i) an AGN torus, (ii) a host-galaxy starburst, and (iii) a warm dust continuum. The model flux is
| (16) |
where are non-negative scaling coefficients and is a single-temperature blackbody. We scan –, which brackets typical cold-to-warm dust temperatures while avoiding extreme values that would become degenerate with the MIR torus or starburst continua.
2.4.1 Likelihood
Before fitting, we normalize the observed JWST spectrum and all templates by their median flux over the fitted wavelength range. For each point in the discrete template grid (AGN template, SB template, and blackbody temperature ), we solve for the non-negative amplitudes using non-negative least squares (NNLS), enforcing .
To perform the Bayesian inference, we adopt a wavelength-dependent Gaussian likelihood with an error floor,
| (17) |
where we fix . The log-likelihood is
| (18) |
2.4.2 Priors
For model comparison we score each grid point with
| (19) |
where includes the discrete torus parameters, the SB template choice, and the BB temperature . We adopt . Values for and are taken from the literature when available; otherwise we use HyperLEDA222http://atlas.obs-hp.fr/hyperleda/ (flagged as “LEDA” in Table 3).
The accretion prior is based on the Eddington-ratio distribution function (ERDF) from Ananna et al. (2022), parameterized as a smooth double power law,
| (20) |
with , , and . For each black hole mass we normalize the ERDF within the interval accessible to our torus grid,
| (21) |
ensuring is a proper density over the model-supported domain.
For the viewing angle we adopt a Gaussian prior,
| (22) |
where is taken from published torus constraints when available and otherwise from the host-galaxy disk inclination as a proxy (Table 3). We adopt for literature-based torus constraints and a broader width for host-proxy or catalog-based inclinations.
We evaluate the Bayesian evidence by summing the unnormalized posterior weights over the discrete model grid,
| (23) |
where is computed for each grid point .
3 Results
3.1 Spatial and temperature distribution


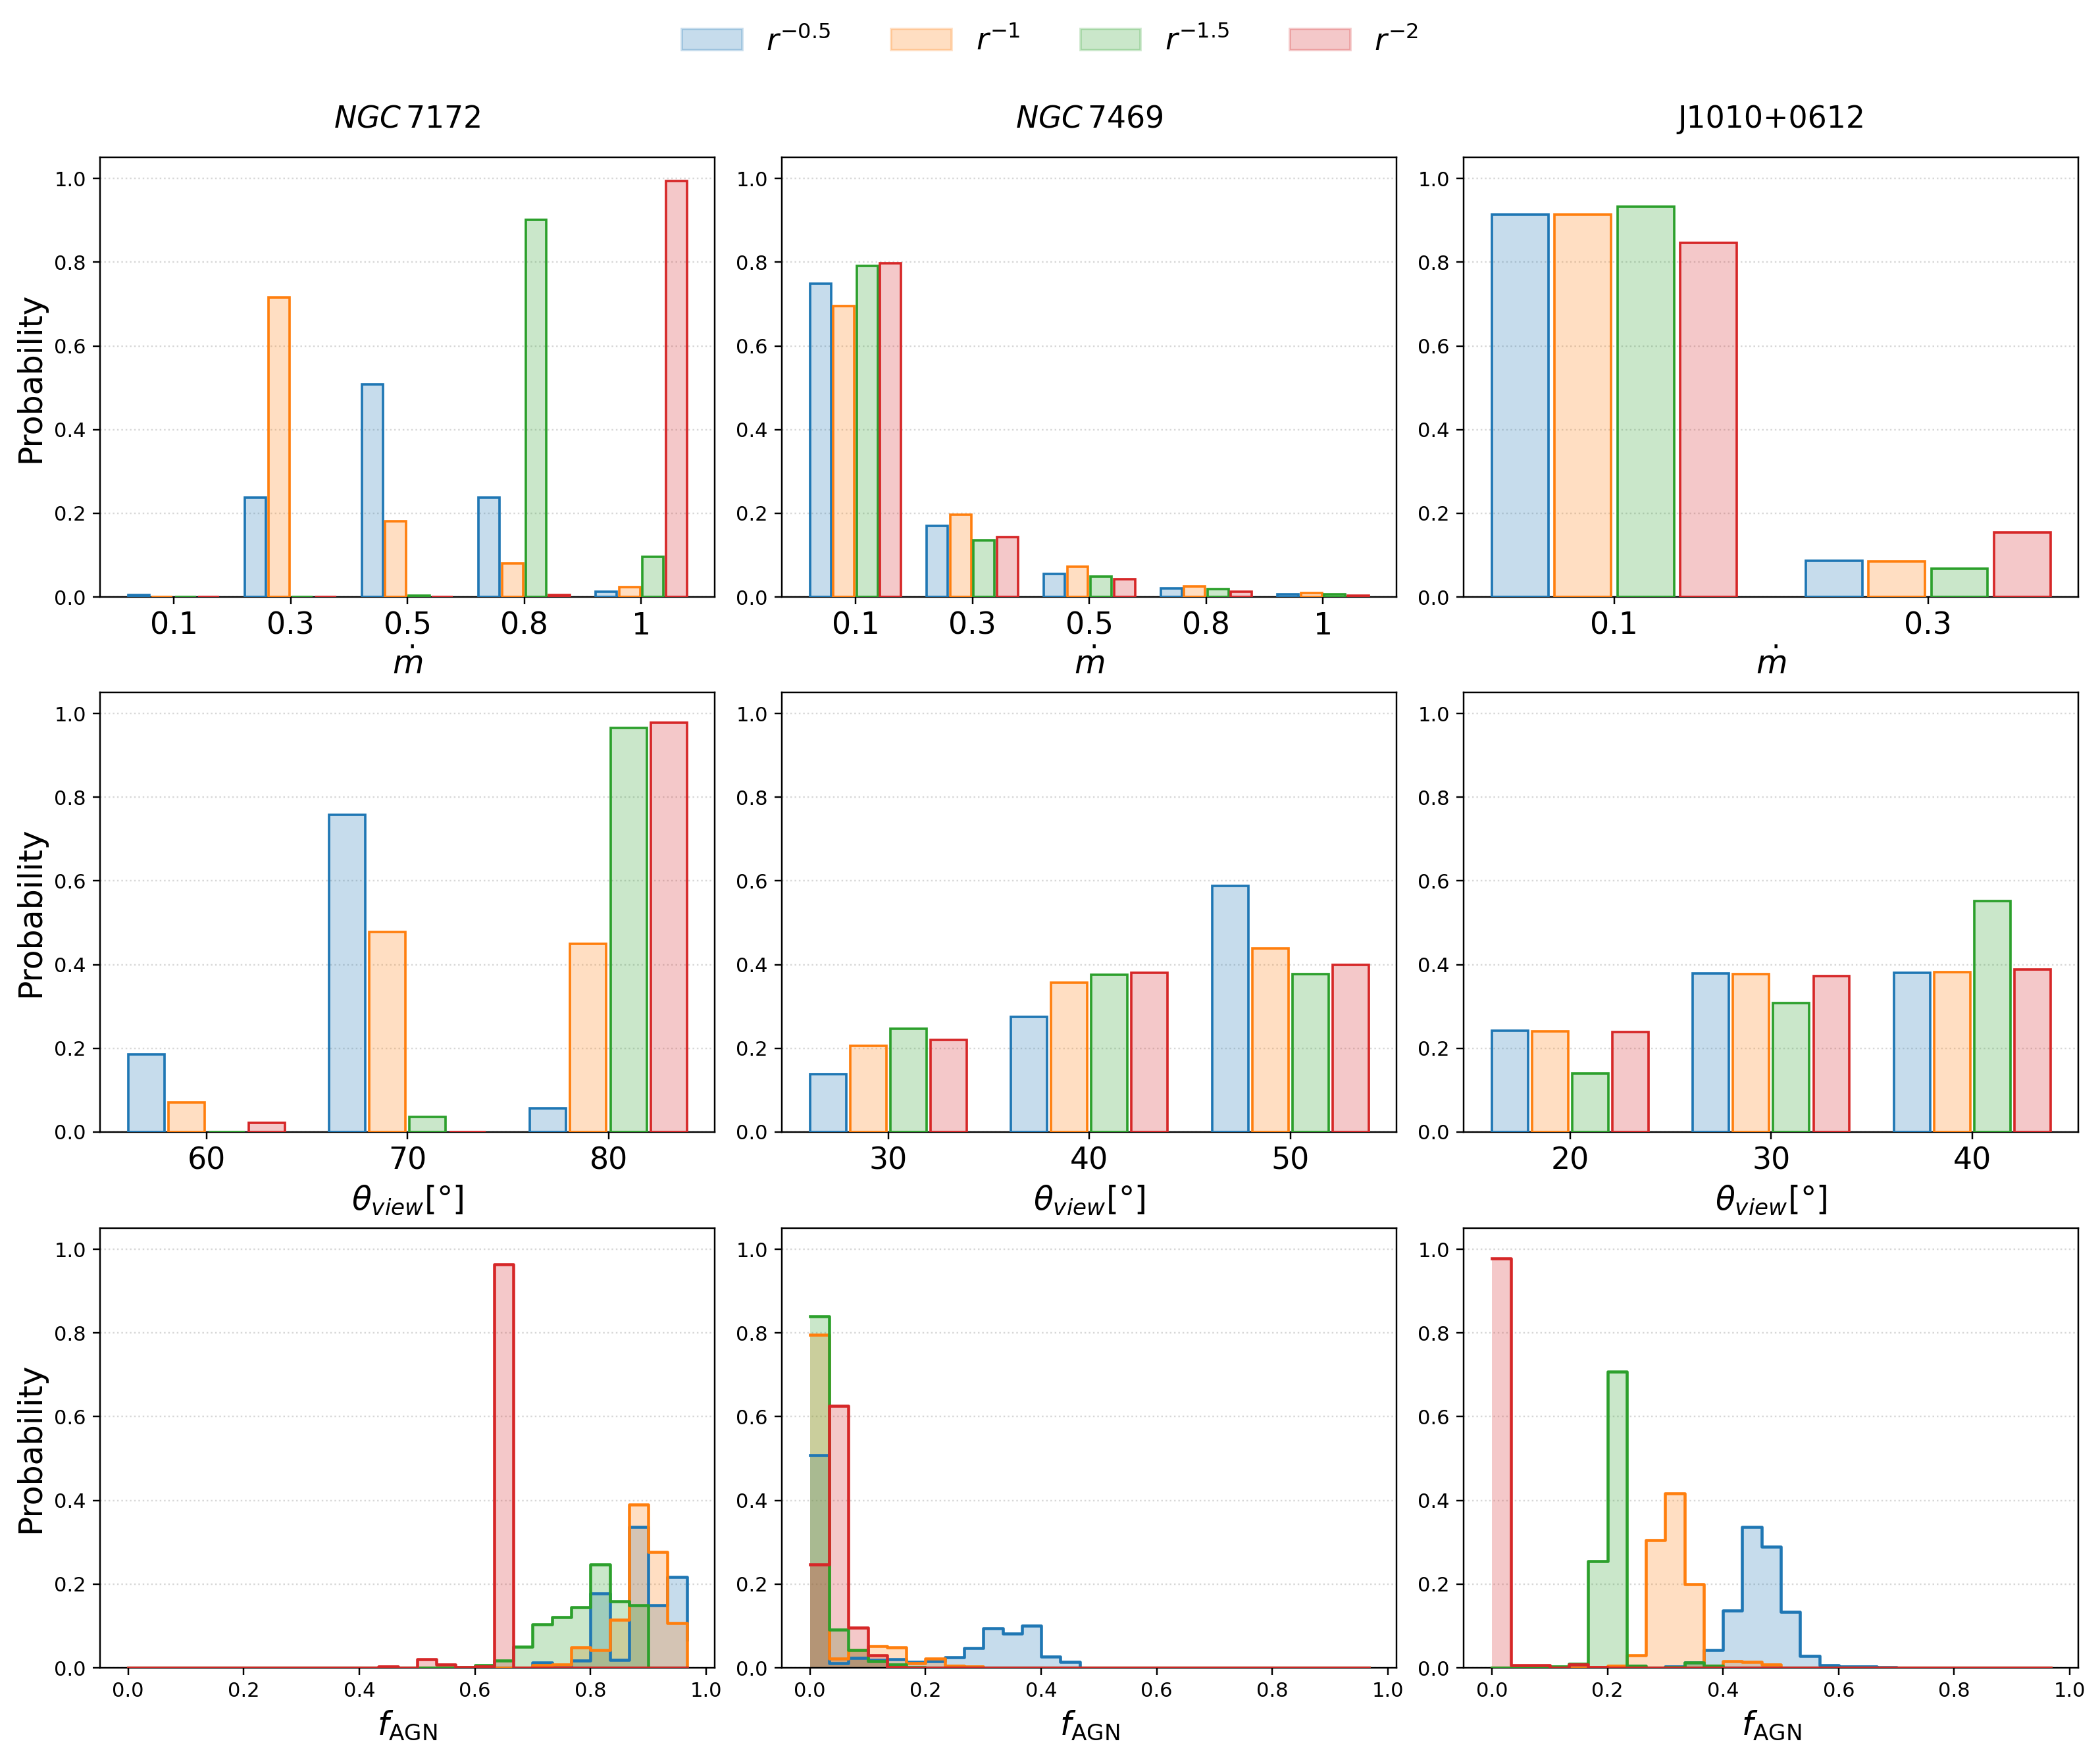
Figure 5 shows the dust temperature field for a representative model (, , , , ), plotted between the sublimation surface and .
The temperature field exhibits strong angular anisotropy, with more efficient heating at higher latitudes than near the equatorial plane. This anisotropic illumination imprints directly on the torus inner rim: the sublimation front becomes distinctly non-spherical and assumes a concave, bowl-like shape, with larger radii toward polar directions than along the equator.
Across the model grid, geometric and opacity parameters primarily control the temperature extent and the relative weight of hot versus cool dust. Increasing extends the cool outer region, while larger increases attenuation and steepens the radial temperature decline. These trends are reflected in the SED variations discussed below (Fig. 6).
3.2 SED library: overview and parameter sensitivity
We build a physically motivated library of AGN SEDs over a wide parameter space. The grid spans six black hole masses, . It also varies the normalized accretion rate , the dust-to-gas ratio , the torus opening angle , the radial extent , the viewing angle , and the radial density index . This library is used as the forward model in Sect. 2.4.
Figure 9 shows the MIR behavior of the library for a representative subset. At fixed intrinsic parameters, the spectra are anisotropic. The 9.7 m silicate feature changes with viewing angle. It can appear in emission for more face-on lines of sight and in absorption for more edge-on lines of sight. The orientation contrast becomes stronger when is higher. In that case, obscured views show deeper silicate absorption.
We then test parameter sensitivity around a fiducial model (Fig. 6). We vary one parameter at a time and keep the others fixed. Changing mainly shifts the overall normalization. The MIR spectral shape changes only weakly. Changing affects the continuum slope and the silicate feature. The trend with can be non-monotonic in our grid.
Parameters that set optical depth and geometry have the largest impact on the spectral morphology. Increasing strengthens silicate self-absorption. Increasing increases the effective line-of-sight extinction. Changing modifies the dust covering factor and the relative weight of hot inner emission. Increasing adds more cool dust at large radii. This typically reddens the MIR continuum and increases absorption.
Finally, the radial density index is a key structural parameter. In Fig. 6, increasing from 0.5 to 2.0 strongly suppresses the MIR output with all other parameters held fixed, and it also changes the continuum slope. Thus, MIR SEDs can be strongly sensitive to the assumed radial dust distribution. In the decomposition below, we therefore treat as a structural degree of freedom and assess its impact on the inferred parameters.
3.3 Spectral decomposition results
3.3.1 Representative fits and component behavior
Figures 7 and 8 jointly illustrate the – spectral decomposition and the corresponding Bayesian parameter constraints for three representative sources NGC 7172, NGC 7469, and J1010+0612 (González-Martín et al., 2025; Ramos Almeida et al., 2025). Figure 7 shows that the observed spectra (black) are well reproduced by the maximum a posteriori (MAP) total model (red), expressed as the sum of three components: an AGN continuum, a SB component, and a BB continuum. The shaded regions highlight the contribution of each component to the total emission for the MAP solution and the lower panels show the residuals.
Figure 8 provides a compact, quantitative counterpart to these decompositions by showing the likelihood-weighted posterior distributions of the key parameters under different assumptions for the dust density power law index . Several common trends emerge across the three sources. First, the inferred AGN fraction broadly tracks the visual component balance in Figure 7 : smoother, more weakly featured spectra favor higher , whereas PAH-rich spectra favor lower and a larger SB contribution. Second, the sensitivity to the assumed density profile is most pronounced for featureless spectra. In such cases, the resulting degeneracies between the torus continuum shape (governed by ) and the AGN/BB flux ratio lead to broader, shifting posteriors. Conversely, when prominent PAH complexes are present, the star-formation component is firmly anchored, making the inferred parameters significantly less sensitive to the choice of .
The decompositions reveal substantial diversity in the relative contributions of the inferred components. In sources with featureless, declining MIR continua, the MAP solutions prioritize the AGN component to reproduce both the absolute normalization and the spectral slope. Conversely, in spectra where PAH complexes are prominent, an enhanced SB contribution is required to fit these discrete features, consistent with PAH emission tracing star-formation-driven dust heating. The BB component is typically sub-dominant; however, for nearly featureless spectra it can trade off against the AGN continuum, contributing to the continuum-shape degeneracy discussed below.
Two limitations are apparent. For nearly featureless spectra, the AGN and BB continua are partially degenerate, which broadens the posteriors of and related parameters. In addition, in several silicate-emission sources the model peak is shifted to , producing structured residuals; we therefore interpret parameters for these cases with caution (see Sect. 4.3).
3.4 Global parameter trends and fitting performance
Table LABEL:tab:density_laws_by_object_bayes summarizes the Bayesian evidence () and MAP parameters for each source across the four radial density laws. The fit quality, quantified by , varies substantially across the sample. For most sources, we obtain over –; for example, NGC 1052 and MCG-05-23-016 yield across all . The evidence also indicates source-dependent preferences in : NGC 1052 and Circinus favor shallower profiles (, with relative to ), whereas J1356+1026 and MRK 231 prefer steeper profiles ().
The black hole mass is tightly constrained by the adopted priors based on external measurements, and it is therefore unchanged across the –2.0 models for most of the sample. Typical fixed values are (e.g., J1010+0612, MRK 273) and 6.6 (e.g., NGC 3081, NGC 1068). The normalized accretion rate is correspondingly restricted to remain consistent with the assumed mass scale and Eddington-ratio expectations: most sources converge to the lower bound , while more moderate values (–0.5) are found for a subset of lower-mass and/or more luminous objects (e.g., NGC 4395). With these bolometric constraints effectively fixed, changes in the radial density index are primarily accommodated by adjustments in geometric parameters and in the BB component. For instance, in NGC 5506 the MAP value of increases from 100 to 180 as steepens from 0.5 to 2.0. The blackbody temperature typically lies in the range –, providing additional flexibility at the long-wavelength end of the MIR spectrum.
Furthermore, we find a systematic dependence of the inferred AGN fraction on the radial density index . As increases from 0.5 to 2.0, the sample median decreases from 0.403 to 0.099 (a factor of ). As shown in Table LABEL:tab:density_laws_by_object_bayes, this trend holds for nearly all sources, largely independent of the silicate-feature morphology or the presence of star-formation signatures. This model-driven variation dominates the uncertainty budget of our energy decomposition. We discuss the physical origin of this – degeneracy in Sect. 4.3.
A few sources show very poor fits (). For ESO 420-G13 and M 94, the large is driven by emission/absorption lines not captured by our continuum-based templates. In the starburst-dominated systems NGC 3256NUC1 and UGC 05101, a strong localized peak near (likely [Ne ii] and/or PAH ) biases the normalization, leaving large residuals that are insensitive to the chosen torus model.
4 Discussion and conclusions
4.1 Numerical advantages and future model extensions
The numerical framework described in Sect. 2.2.4 provides a flexible forward model for AGN MIR spectra. By solving the 3D radiative transfer problem with an anisotropic illumination pattern, the model self-consistently reproduces the angle-dependent heating that shapes the sublimation front into a bowl-like surface.
A practical advantage of our deterministic ray-tracing approach, relative to Monte Carlo radiative transfer (MCRT) codes (e.g., Stalevski et al., 2016, 2012), is that it produces noise-free model SEDs at a fixed numerical resolution, which is convenient when building large grids for Bayesian fitting. In addition, our implementation uses a logarithmic radial mesh with enhanced resolution close to the dust sublimation radius, where temperature and density gradients are steep. This combination allows efficient exploration of parameter space without stochastic fluctuations in the predicted spectra.
While the current implementation is optimized for efficient grid generation, it should be viewed as a baseline that can be extended to better capture the complexity of the circumnuclear environment. A vital future improvement is the implementation of a multi-phase dust scheme. Additionally, although the current grid is optimized for a toroidal geometry, modern high-angular-resolution observations suggest a polar-extended dust component (Hönig et al., 2012; Asmus et al., 2016). Our preference for small opening angles () in several sources is consistent with a non-negligible contribution from higher-latitude dust to the MIR continuum shape. In our current static model, this is approximated by increasing the vertical extent (opening angle ) of the dusty torus. However, a more physically consistent approach would be to explicitly incorporate a polar wind structure, which may reduce (or remove) the need for the blackbody component. Finally, coupling this 3D dust radiative transfer with photoionization modeling would enable a simultaneous fit of both the continuum and emission-line diagnostics. Such an integrated treatment is essential to fully resolve the AGN–host interface and the complex dynamical interplay between the central engine and the circumnuclear environment.
4.2 The silicate feature: emission vs. absorption
A primary finding of this research is the contrasting behavior between silicate absorption and emission features across the sample. In obscuration-dominated sources, the silicate absorption typically appears close to , consistent with standard ISM-like silicate opacity (Draine and Hensley, 2021) and cold foreground dust in the torus and/or host galaxy. In contrast, in emission-dominated sources the apparent peak of the silicate emission feature is often shifted redward, with many objects peaking near . In the following, we discuss whether this redward shift is driven by changes in grain size and composition, radiative processing, and/or radiative transfer effects.
One plausible driver of this evolution is the intense radiation field of the central engine. High-energy photons can preferentially destroy the smallest grains or modify their size distribution, effectively suppressing the most sharply peaked contribution near the nominal resonance (Laor and Draine, 1993). A grain population weighted toward larger (micron-sized) grains tends to produce broader and flatter silicate profiles with enhanced red wings (González-Martín et al., 2023). In addition, the extreme thermal environment near the sublimation front can promote partial annealing of amorphous silicates into more ordered (crystalline) structures (Kemper et al., 2005). Although crystalline silicates primarily introduce narrow features at longer wavelengths, their presence may contribute to additional substructure and a relatively stronger red wing, potentially shifting the apparent emission maximum when combined with radiative transfer effects.
This redward shift can be further modulated by radiative transfer effects. Because the silicate opacity peaks near , emission at this wavelength is particularly sensitive to self-absorption in media with strong temperature gradients (Nenkova et al., 2008a). In such configurations, the emission emerging from the hottest surfaces can be partially absorbed by cooler dust along the line of sight, reducing the contrast at the nominal peak and moving the apparent maximum toward longer wavelengths where the optical depth is lower (Nikutta et al., 2009). This effect can help explain why absorption-dominated spectra often trace the ISM-like trough position, whereas emission-dominated spectra are more sensitive to local heating and internal obscuration.
Consequently, these results highlight the limitations of adopting fixed ISM dust templates for AGN tori. The redward shift of the emission feature is consistent with a dust population shaped by radiative processing, changes in the grain-size distribution, and internal self-absorption. Future torus models would benefit from more flexible dust prescriptions that allow the grain-size distribution and mineralogy to vary with local physical conditions, enabling a more direct connection between MIR spectral shapes and the state of the circumnuclear environment.
4.3 Fitting results and the structural -degeneracy
Applying our 3D model library to the – spectra reveals a significant – degeneracy that constitutes a major systematic uncertainty/ We find that the sample median decreases four-fold as the radial density index increases from to .
This systematic dependence is primarily driven by the MIR continuum slope of the torus templates within our normalized fitting framework (Gandhi et al., 2009). Typical AGN spectra in the – range exhibit a negative slope in , decreasing with increasing wavelength. The radial density profile directly dictates the steepness of this model slope. A shallow profile () distributes a larger mass of dust to cooler, distant radii, resulting in a flatter and redder MIR continuum. To compensate for this lack of intrinsic steepness and match the observed declining slope, the fit typically compensates by increasing the normalization. Conversely, a steep profile () concentrates dust near the hot inner rim, producing a naturally steep and blue MIR continuum that intrinsically mimics the observed slope, requiring a much lower weight to achieve a high-quality fit.
The Bayesian evidence () reveals a clear bimodal distribution in our sample: 14/25 sources favor shallow gradients (), while 8/25 prefer steep, compact configurations (), the remaining three favor intermediate gradients. This split is consistent with previous statistical studies such as García-González et al. (2017), who found that radial distributions correlate with the MIR spectral index, with Type 1 AGN tending to favor steeper distributions (warmer slopes) and Seyfert 2 galaxies favoring flatter distributions (redder slopes). Our finding of a non-universal radial structure aligns with this observed diversity across the AGN population.
This evidence split may reflect genuinely different structural states. For instance, shallow profiles () could represent extended dust distributions influenced by MHD-driven winds, while steep profiles () could correspond to compact torus structures dominated by the inner rim. However, we caution that the statistical preference for these grid extremes may also serve to compensate for inherent model limitations. As discussed in Sect. 4.1, the preference for might act as a numerical proxy for additional cool components, such as polar-extended emission, that a single power law torus cannot reproduce. Breaking this structural degeneracy will require spatial constraints from MIR interferometry (e.g., VLT/MATISSE) or high-resolution JWST imaging to definitively connect spectral shape to the true dust distribution and provide a robust energy budget for the circumnuclear environment.
4.4 Summary and Conclusions
We have developed a self-consistent 3D radiative transfer framework to model the circumnuclear dust emission in AGN dusty tori, resolving the steep temperature and density gradients near the sublimation front while ensuring bolometric energy conservation. Applying this model to a sample of 25 sources, we find that the apparent peak of the silicate emission feature is frequently shifted redward to , whereas the absorption trough remains close to its canonical wavelength across the sample. This redward offset is consistent with dust in the illuminated inner regions being modified by radiative processing, potentially involving small-grain depletion, partial thermal annealing, and erosion of the resonance core by self-absorption.
Our Bayesian model comparison suggests an approximately bimodal preference in the radial density profiles (): 14/25 sources favor shallow gradients (), while 8/25 prefer compact configurations (). We also identify a strong – degeneracy, with the inferred AGN fractional contribution varying by a factor of between shallow and steep profiles. This behavior is primarily driven by spectral-shape compensation: flatter profiles produce redder MIR continua that require a higher normalization to match the data, whereas steeper profiles yield intrinsically bluer continua and thus favor lower AGN weights.
These results highlight that a major systematic uncertainty in AGN MIR energy decomposition is structural rather than purely statistical. Robust constraints on the circumnuclear dust distribution, and hence on the AGN energy budget, will require independent spatial information—for example, MIR interferometry with VLT/MATISSE and/or high-resolution JWST imaging—to break the degeneracy and directly connect spectral curvature to the underlying geometry.
Data Availability
The simulated AGN spectra and Bayesian posterior results are available on Zenodo: https://doi.org/10.5281/zenodo.18861234
Acknowledgements.
The authors are grateful to the anonymous referee for their constructive review and insightful suggestions, which significantly improved the clarity and depth of this paper. This work is based on observations made with the NASA/ESA/CSA James Webb Space Telescope. The data were obtained from the Mikulski Archive for Space Telescopes (MAST) at the Space Telescope Science Institute, which is operated by the Association of Universities for Research in Astronomy, Inc., under NASA contract NAS 5-03127.References
- Black hole mass estimation using X-ray variability measurements in Seyfert galaxies. A&A 666, pp. A127. External Links: Document, 2208.12490, ADS entry Cited by: Table 3.
- Local Luminous Infrared Galaxies. III. Co-evolution of Black Hole Growth and Star Formation Activity?. ApJ 765 (2), pp. 78. External Links: Document, 1301.4015, ADS entry Cited by: Table 3.
- BASS. XXX. Distribution Functions of DR2 Eddington Ratios, Black Hole Masses, and X-Ray Luminosities. ApJS 261 (1), pp. 9. External Links: Document, 2201.05603, ADS entry Cited by: §2.4.2.
- Spectropolarimetry and the nature of ngc 1068. ApJ 297, pp. 621–632. External Links: Document Cited by: §1.
- Unified models for active galactic nuclei and quasars. ARA&A 31 (1), pp. 473–521. Cited by: §1.
- The Subarcsecond Mid-infrared View of Local Active Galactic Nuclei. III. Polar Dust Emission. ApJ 822 (2), pp. 109. External Links: Document, 1603.02710, ADS entry Cited by: §4.1.
- Properties of the Obscuring Torus in NGC 1052 from Multiepoch Broadband X-Ray Spectroscopy. ApJ 916 (2), pp. 90. External Links: Document, 2105.01682, ADS entry Cited by: Table 3.
- X-ray absorption in mcg-6-30-15. ApJ 703, pp. 1347. Cited by: §1.
- Upper Limits on the Masses of 105 Supermassive Black Holes from Hubble Space Telescope/Space Telescope Imaging Spectrograph Archival Data. ApJ 692 (1), pp. 856–868. External Links: Document, 0809.5103, ADS entry Cited by: Table 3.
- Hydromagnetic flows from accretion discs and the production of radio jets. MNRAS 199, pp. 883–903. External Links: Document Cited by: §1.
- Hydromagnetic flows from accretion disks. MNRAS 199, pp. 883–903. Cited by: §2.2.3.
- The Mid-Infrared Properties of Starburst Galaxies from Spitzer-IRS Spectroscopy. ApJ 653 (2), pp. 1129–1144. External Links: Document, astro-ph/0609024, ADS entry Cited by: §2.3, §2.3.
- Spectral Analysis of the Accretion Flow in NGC 1052 with Suzaku. ApJ 698 (1), pp. 528–540. External Links: Document, 0903.3583, ADS entry Cited by: Table 3.
- MEASURING the mass of the central black hole in the bulgeless galaxy ngc 4395 from gas dynamical modeling. ApJ 809 (1), pp. 101. External Links: ISSN 1538-4357, Link, Document Cited by: Table 3.
- Modeling the sed of the agn inside ngc 4395. External Links: 2307.15111, Link Cited by: Table 3.
- The spectral energy distributions of local galaxies from 3 to 500 m: analysis of the KINGFISH sample. ApJ 745, pp. 95. Cited by: §2.3.
- STIS Spectroscopy of the Central 10 Parsecs of M81: Evidence for a Massive Black Hole. AJ 125 (3), pp. 1226–1235. External Links: Document, ADS entry Cited by: Table 3.
- Rotating nuclear rings and extreme starbursts in ultraluminous galaxies. ApJ 507, pp. 615–654. Cited by: §2.3.
- The dielectric function of ”astrodus” and predictions for polarization in the 3.4 and 10 μm features. ApJ 909 (1), pp. 94. External Links: ISSN 1538-4357, Link, Document Cited by: §2.2.1, §4.2.
- Radiation-driven dust models: PAHs, silicates, and the ISM. ApJ 657, pp. 810–837. External Links: Document Cited by: §2.2.1, §2.2.3.
- Interstellar dust grains. ARA&A 41, pp. 241–289. External Links: Document Cited by: §1.
- The AGN Ionization Cones of NGC 5728. II. Kinematics. ApJ 870 (1), pp. 37. External Links: Document, 1811.04513, ADS entry Cited by: Table 3.
- The origin of dust in the early universe. ApJ 727, pp. 63. Cited by: §1.
- The evolution of refractory interstellar grains. ApJ 322, pp. 812–821. Cited by: §2.2.2.
- Dust formation in agn outflows. ApJ 567 (1), pp. L107–L110. Cited by: §1.
- A Structure for Quasars. ApJ 545 (1), pp. 63–76. External Links: Document, astro-ph/0008064, ADS entry Cited by: §2.2.3.
- Radiative Transfer and Acceleration in Magnetocentrifugal Winds. ApJ 631 (2), pp. 689–706. External Links: Document, astro-ph/0506321, ADS entry Cited by: §1, §2.2.3.
- A CO molecular gas wind 340 pc away from the Seyfert 2 nucleus in ESO 420-G13 probes an elusive radio jet. A&A 633, pp. A127. External Links: Document, 1911.00015, ADS entry Cited by: Table 3.
- The starburst in M 82: mid-infrared spectroscopy and diagnostics. A&A 399, pp. 833–852. Cited by: §2.3.
- The agn dusty torus: a unified view. MNRAS 366 (2), pp. 767–786. Cited by: §2.2.1, §2.2.3.
- Magnetohydrodynamic accretion-disk winds as x-ray absorbers in active galactic nuclei. ApJ 715, pp. 636–650. Cited by: §2.2.3.
- Production of dust by massive stars at high redshift. A&A Rev. 19, pp. 43. External Links: Document, 1108.0403, ADS entry Cited by: §1.
- The Interstellar Dust Properties of Nearby Galaxies. ARA&A 56, pp. 673–713. External Links: Document, 1711.07434, ADS entry Cited by: §1.
- High-resolution imaging of ngc 1068. ApJ 829, pp. 7. Cited by: §1.
- Resolving the mid-infrared cores of local Seyferts. A&A 502 (2), pp. 457–472. External Links: Document, 0902.2777, ADS entry Cited by: §4.3.
- ALMA observations of ngc 1068. A&A 652, pp. A98. Cited by: §1.
- A mid-infrared statistical investigation of clumpy torus model predictions. MNRAS 470 (3), pp. 2578–2598. External Links: Document, 1706.07425, ADS entry Cited by: §1, §4.3.
- What powers ultraluminous infrared galaxies?. ApJ 498, pp. 579–605. External Links: Document Cited by: §1.
- JWST reveals the diversity of nuclear obscuring dust in nearby AGN: nuclear isolation of MIRI/MRS data cubes and continuum spectral fitting. MNRAS 539 (3), pp. 2158–2184. External Links: Document, 2504.01103, ADS entry Cited by: §3.3.1, footnote 3.
- The role of grain size in active galactic nuclei torus dust models. A&A 676, pp. A73. External Links: Document, 2305.11331, ADS entry Cited by: §4.2.
- A two-phase model for the X-ray emission from Seyfert galaxies. ApJ 413, pp. 507–517. External Links: Document Cited by: §2.1.
- The cosmic infrared background: measurements and implications. ARA&A 39, pp. 249–307. Cited by: §1.
- The astrodust+pah model: a unified description of the extinction, emission, and polarization from dust in the diffuse interstellar medium. ApJ 948 (1), pp. 55. External Links: ISSN 1538-4357, Link, Document Cited by: Figure 3, Figure 3, §2.2.1.
- Parsec-scale Dust Emission from the Polar Region in the Type 2 Nucleus of NGC 424. ApJ 755 (2), pp. 149. External Links: Document, 1206.4307, ADS entry Cited by: §4.1.
- The dusty heart of nearby active galaxies. II. From clumpy torus models to physical properties of dust around AGN. A&A 523, pp. A27. External Links: Document, 0909.4539, ADS entry Cited by: §1.
- Dense Molecular Gas Properties of the Central Kiloparsec of Nearby Ultraluminous Infrared Galaxies Constrained by ALMA Three Transition-line Observations. ApJ 950 (1), pp. 75. External Links: Document, 2303.08178, ADS entry Cited by: §1.
- The central dusty torus in the active nucleus of ngc 1068. Nature 429, pp. 47–49. External Links: Document Cited by: §1.
- Dust destruction in the ism. A&A 530, pp. A44. Cited by: §1.
- Erratum: “The Absence of Crystalline Silicates in the Diffuse Interstellar Medium“ (¡A href=”/abs/2004ApJ…609..826K”¿ApJ, 609, 826 [2004]¡/A¿). ApJ 633 (1), pp. 534–534. External Links: Document, ADS entry Cited by: §4.2.
- The Black Hole Masses and Eddington Ratios of Type 2 Quasars. ApJ 859 (2), pp. 116. External Links: Document, 1804.09852, ADS entry Cited by: Table 3, Table 3, Table 3, Table 3, Table 3.
- BAT AGN Spectroscopic Survey. I. Spectral Measurements, Derived Quantities, and AGN Demographics. ApJ 850 (1), pp. 74. External Links: Document, 1707.08123, ADS entry Cited by: Table 3.
- Graphite sublimation in AGN: implications for dust survival. ApJ 402, pp. 441–468. External Links: Document Cited by: §4.2.
- A new mid-infrared diagnostic diagram for active galaxies and starbursts. A&A 359, pp. 887–899. Cited by: §1.
- Magnetic fields in ngc 1068. ApJ 893, pp. 33. Cited by: §1.
- Near-infrared polarimetric adaptive optics observations of NGC 1068: a torus created by a hydromagnetic outflow wind. MNRAS 452 (2), pp. 1902–1913. External Links: Document, 1506.07170, ADS entry Cited by: §1.
- The first X-ray survey of optically selected quasars with the SRG/eROSITA. MNRAS 456, pp. 1253–1268. External Links: Document Cited by: §2.1.
- The Link between the Hidden Broad Line Region and the Accretion Rate in Seyfert 2 Galaxies. ApJ 748 (2), pp. 130. External Links: Document, 1201.5397, ADS entry Cited by: Table 3.
- The size distribution of interstellar grains. ApJ 217, pp. 425–433. Cited by: §2.2.
- Self‐similar accretion flows with convection. ApJ 539 (2), pp. 798–808. External Links: ISSN 1538-4357, Link, Document Cited by: §1.
- Advection-dominated Accretion: A Self-similar Solution. ApJ 428, pp. L13. External Links: Document, astro-ph/9403052, ADS entry Cited by: §1.
- Disentangling agn and starburst contributions in ultraluminous infrared galaxies. MNRAS 385, pp. L130–L134. External Links: Document Cited by: §1.
- Clumpy tori in agn. ApJ 685 (1), pp. 147. Cited by: §2.2.1, §4.2.
- AGN Dusty Tori. II. Observational Implications of Clumpiness. ApJ 685 (1), pp. 160–180. External Links: Document, 0806.0512, ADS entry Cited by: §1.
- Quasar discs. II - A composite model for the broad-line region. MNRAS 225, pp. 55–72. External Links: Document, ADS entry Cited by: §2.1.
- Supermassive black hole mass measurement in the spiral galaxy NGC 4736 using JWST/NIRSpec stellar kinematics. A&A 698, pp. L9. External Links: Document, 2505.09941, ADS entry Cited by: Table 3.
- NLS1 galaxies and estimation of their central black hole masses from the x-ray excess variance method. MNRAS 394 (4), pp. 2141–2152. External Links: ISSN 1365-2966, Link, Document Cited by: Table 3, Table 3.
- On the 10 m Silicate Feature in Active Galactic Nuclei. ApJ 707 (2), pp. 1550–1559. External Links: Document, 0910.5521, ADS entry Cited by: §4.2.
- Measuring the Masses of Supermassive Black Holes. Space Sci. Rev. 183 (1-4), pp. 253–275. External Links: Document, ADS entry Cited by: Table 3.
- The dusty torus in active galactic nuclei. ApJ 401, pp. 99. Cited by: §1.
- Spectral Energy Distributions of Hard X-Ray Selected Active Galactic Nuclei in the XMM-Newton Medium Deep Survey. ApJ 663 (1), pp. 81–102. External Links: Document, astro-ph/0703255, ADS entry Cited by: §2.3.
- CAIXA: a catalogue of AGN in the XMM-Newton archive. III. Excess variance analysis. A&A 542, pp. A83. External Links: Document, 1112.2744, ADS entry Cited by: Table 3.
- The JWST Early Release Observations. ApJ 936 (1), pp. L14. External Links: Document, 2207.13067, ADS entry Cited by: Table 3.
- Far-infrared mapping of the starburst galaxy ¡ASTROBJ¿NGC 253¡/ASTROBJ¿ with ISOPHOT. A&A 377, pp. 73–83. External Links: Document, astro-ph/0108075, ADS entry Cited by: §2.3.
- Silicate emission in a type-2 quasar: JWST/MIRI constraints on torus geometry and radiative feedback. arXiv e-prints, pp. arXiv:2512.02629. External Links: Document, 2512.02629, ADS entry Cited by: Table 3, Table 3, Table 3, Table 3, Table 3, §3.3.1, footnote 3.
- The dust-to-gas ratio of galaxies. A&A 563, pp. A13. Cited by: §2.2.3.
- The Black Hole Mass of NGC 4151 from Stellar Dynamical Modeling. ApJ 916 (1), pp. 25. External Links: Document, 2106.02758, ADS entry Cited by: Table 3.
- Radiative processes in astrophysics. External Links: ADS entry Cited by: §2.2.1.
- Luminous infrared galaxies. ARA&A 34, pp. 749–792. Cited by: §2.3.
- Dust formation in agn winds. ApJ 885 (2), pp. 126. External Links: ISSN 1538-4357, Link, Document Cited by: §1, Figure 2, Figure 2, §2.1, §2.1, §2.2.3.
- Black holes in binary systems. Observational appearance.. A&A 24, pp. 337–355. Cited by: §2.1.
- Dust composition in agn. ApJ 653, pp. 127–135. Cited by: §1.
- Modeling the Effects of Dust on Galactic Spectral Energy Distributions from the Ultraviolet to the Millimeter Band. ApJ 509 (1), pp. 103–117. External Links: Document, ADS entry Cited by: §2.3.
- Mid-infrared galaxy classification based on silicate obscuration and pah equivalent width. ApJ 654, pp. L49–L52. External Links: Document Cited by: §1.
- 3D radiative transfer modelling of the dusty tori around active galactic nuclei as a clumpy two-phase medium: agn dusty tori as clumpy two-phase medium. MNRAS 420 (4), pp. 2756–2772. External Links: ISSN 0035-8711, Link, Document Cited by: §2.1, §2.2.3, §4.1.
- The dust covering factor in active galactic nuclei. MNRAS 458 (3), pp. 2288–2302. External Links: Document, 1602.06954, ADS entry Cited by: §4.1.
- Mid-infrared imaging of ngc 1068. A&A 474, pp. 837. Cited by: §1, §1.
- The Inner Kiloparsec of Mrk 273 with Keck Adaptive Optics. ApJ 775 (2), pp. 115. External Links: Document, 1307.8440, ADS entry Cited by: Table 3.
- Dust production in the early universe. MNRAS 416, pp. 1916–1932. Cited by: §1, §2.2.3.
- Feedback in agns and starbursts. A&A Rev. 28, pp. 2. External Links: Document Cited by: §1.
- Dust formation in agn accretion disks. ApJ 702, pp. 63–72. Cited by: §1.
- Radiation-driven fountain and origin of the torus around agns. ApJ 758, pp. 66. External Links: Document Cited by: §1.
- Dynamical evidence from the sub-parsec counter-rotating disc for a close binary of supermassive black holes in NGC 1068. MNRAS 497 (1), pp. 1020–1028. External Links: Document, 2005.01220, ADS entry Cited by: Table 3.
- Comprehensive Broadband X-Ray and Multiwavelength Study of Active Galactic Nuclei in 57 Local Luminous and Ultraluminous Infrared Galaxies Observed with NuSTAR and/or Swift/BAT. ApJS 257 (2), pp. 61. External Links: Document, 2107.10855, ADS entry Cited by: Table 3, Table 3, Table 3, Table 3.
- A probable milli-parsec supermassive binary black hole in the nearest quasar mrk 231. ApJ 809 (2), pp. 117. External Links: ISSN 1538-4357, Link, Document Cited by: Table 3.
- The Galaxy Activity, Torus, and Outflow Survey (GATOS). IV. Exploring Ionized Gas Outflows in Central Kiloparsec Regions of GATOS Seyferts. ApJ 974 (2), pp. 195. External Links: Document, 2409.09771, ADS entry Cited by: Table 3, Table 3, Table 3, Table 3, Table 3.
- Interstellar dust models consistent with extinction, emission, and abundance constraints. ApJS 152, pp. 211–249. Cited by: §1.
Appendix A Supplementary tables and figures
![[Uncaptioned image]](2511.11835v2/Figure/SED_Grid_RowShared_Final.png)
| Object | RA (J2000) | Dec (J2000) | ||||
|---|---|---|---|---|---|---|
| NGC 1052 | 02:41:04.8 | 08:15:21 | 0.00482 | 0.023 | (Brenneman et al. 2009) | 70 (Baloković et al. 2021) |
| ESO 420-G13 | 04:13:49.7 | 30:16:28 | 0.01191 | 0.015 | (Fernández-Ontiveros et al. 2020) | 29.2(LEDA) |
| UGC 05101 | 09:35:51.6 | +61:21:11 | 0.03937 | 0.031 | (Akylas et al. 2022) | 65.9(Yamada et al. 2021) |
| MCG 05-23-016 | 09:47:40.1 | 30:56:56 | 0.00849 | 0.075 | (Ponti et al. 2012) | 50 (Zhang et al. 2024) |
| M 81 | 09:55:33.2 | +69:03:55 | 0.00077 | 0.072 | (Devereux et al. 2003) | 62.7(LEDA) |
| NGC 3081 | 09:59:29.5 | 22:49:35 | 0.00591 | 0.038 | -(Beifiori et al. 2009) | 71(Zhang et al. 2024) |
| NGC 3256NUC1 | 10:27:51.3 | 43:54:14 | 0.00935 | 0.120 | (Alonso-Herrero et al. 2013) | 48.2(LEDA) |
| NGC 4395 | 12:25:48.9 | +33:32:48 | 0.00106 | 0.015 | -(Brok et al. 2015) | 10(Cruz et al. 2023) |
| M 94 | 12:50:53.1 | +41:07:14 | 0.00103 | 0.014 | (Nguyen et al. 2025) | 35(LEDA) |
| MRK 231 | 12:56:14.2 | +56:52:25 | 0.04217 | 0.023 | (Yan et al. 2015) | 60(Yamada et al. 2021) |
| MRK 273 | 13:44:42.1 | +55:53:13 | 0.03734 | 0.027 | (U et al. 2013) | 60(Yamada et al. 2021) |
| NGC 5506 | 14:13:14.9 | 03:12:27 | 0.00561 | 0.051 | (Nikołajuk et al. 2009) | 42(Zhang et al. 2024) |
| NGC 5728 | 14:42:23.9 | 17:15:11 | 0.00932 | 0.082 | (Durré and Mould 2019) | 49(Zhang et al. 2024) |
| IC 5063 | 20:52:02.3 | 57:04:08 | 0.01135 | 0.055 | (Nikołajuk et al. 2009) | 51(LEDA) |
| NGC 7172 | 22:02:01.9 | 31:52:11 | 0.00791 | 0.021 | (Marinucci et al. 2012) | 67(Zhang et al. 2024) |
| NGC 7319 | 22:36:03.5 | +33:58:33 | 0.02251 | 0.070 | (Pontoppidan et al. 2022) | 53.3(LEDA) |
| NGC 7469 | 23:03:15.6 | +08:52:26 | 0.01627 | 0.060 | (Peterson 2014) | 45(Yamada et al. 2021) |
| Circinus | 14:13:09.9 | 65:20:21 | 0.00145 | 0.463 | (Koss et al. 2017) | 64.3(LEDA) |
| NGC 1068 | 02:42:40.7 | 00:00:48 | 0.00379 | 0.028 | (Wang et al. 2020) | 34.7(LEDA) |
| NGC 4151 | 12:10:32.6 | +39:24:21 | 0.00332 | 0.023 | (Roberts et al. 2021) | 42(LEDA)) |
| J1509+0434 | 15:09:04.2 | +04:34:42 | 0.04410 | 0.041 | (Kong and Ho 2018) | 44(Ramos Almeida et al. 2025) |
| J1100+0846 | 11:00:12.4 | +08:46:16 | 0.03120 | 0.025 | (Kong and Ho 2018) | 38(Ramos Almeida et al. 2025) |
| J1430+1339 | 14:30:29.9 | +13:39:12 | 0.01700 | 0.031 | (Kong and Ho 2018) | 38(Ramos Almeida et al. 2025) |
| J1010+0612 | 10:10:43.3 | +06:12:01 | 0.01430 | 0.022 | (Kong and Ho 2018) | 35(Ramos Almeida et al. 2025) |
| J1356+1026 | 13:56:55.7 | +10:25:35 | 0.00700 | 0.019 | (Kong and Ho 2018) | 55(Ramos Almeida et al. 2025) |
| Object | SB | ||||||||||
|---|---|---|---|---|---|---|---|---|---|---|---|
| NGC 1052 | 0.5 | NGC7714 | |||||||||
| 1.0 | NGC7714 | ||||||||||
| 1.5 | NGC7714 | ||||||||||
| 2.0 | NGC7714 | ||||||||||
| ESO 420-G13 | 0.5 | NGC7714 | |||||||||
| 1.0 | NGC7714 | ||||||||||
| 1.5 | NGC7714 | ||||||||||
| 2.0 | NGC7714 | ||||||||||
| UGC 05101 | 0.5 | IRAS17208-0014 | |||||||||
| 1.0 | IRAS17208-0014 | ||||||||||
| 1.5 | IRAS17208-0014 | ||||||||||
| 2.0 | IRAS17208-0014 | ||||||||||
| MCG-05-23-016 | 0.5 | M82 | |||||||||
| 1.0 | NGC1614 | ||||||||||
| 1.5 | IRAS17208-0014 | ||||||||||
| 2.0 | NGC1614 | ||||||||||
| M 81 | 0.5 | NGC7714 | |||||||||
| 1.0 | NGC7714 | ||||||||||
| 1.5 | NGC7714 | ||||||||||
| 2.0 | NGC7714 | ||||||||||
| NGC 3081 | 0.5 | M82 | |||||||||
| 1.0 | M82 | ||||||||||
| 1.5 | NGC1614 | ||||||||||
| 2.0 | NGC7714 | ||||||||||
| NGC 3256NUC1 | 0.5 | NGC7714 | |||||||||
| 1.0 | NGC7714 | ||||||||||
| 1.5 | IRAS17208-0014 | ||||||||||
| 2.0 | NGC1614 | ||||||||||
| NGC 4395 | 0.5 | NGC1614 | |||||||||
| 1.0 | NGC1614 | ||||||||||
| 1.5 | NGC7714 | ||||||||||
| 2.0 | NGC7714 | ||||||||||
| M 94 | 0.5 | IRAS17208-0014 | |||||||||
| 1.0 | IRAS17208-0014 | ||||||||||
| 1.5 | IRAS17208-0014 | ||||||||||
| 2.0 | IRAS17208-0014 | ||||||||||
| MRK 231 | 0.5 | Arp220 | |||||||||
| 1.0 | Arp220 | ||||||||||
| 1.5 | Arp220 | ||||||||||
| 2.0 | Arp220 | ||||||||||
| MRK 273 | 0.5 | IRAS17208-0014 | |||||||||
| 1.0 | Arp220 | ||||||||||
| 1.5 | Arp220 | ||||||||||
| 2.0 | Arp220 | ||||||||||
| NGC 5506 | 0.5 | NGC1614 | |||||||||
| 1.0 | IRAS17208-0014 | ||||||||||
| 1.5 | IRAS17208-0014 | ||||||||||
| 2.0 | NGC1614 | ||||||||||
| NGC 5728 | 0.5 | IRAS17208-0014 | |||||||||
| 1.0 | IRAS17208-0014 | ||||||||||
| 1.5 | IRAS17208-0014 | ||||||||||
| 2.0 | IRAS17208-0014 | ||||||||||
| IC 5063 | 0.5 | NGC1614 | |||||||||
| 1.0 | NGC1614 | ||||||||||
| 1.5 | IRAS17208-0014 | ||||||||||
| 2.0 | NGC1614 | ||||||||||
| NGC 7172 | 0.5 | M82 | |||||||||
| 1.0 | M82 | ||||||||||
| 1.5 | M82 | ||||||||||
| 2.0 | Arp220 | ||||||||||
| NGC 7319 | 0.5 | NGC1614 | |||||||||
| 1.0 | NGC1614 | ||||||||||
| 1.5 | NGC1614 | ||||||||||
| 2.0 | NGC1614 | ||||||||||
| NGC 7469 | 0.5 | NGC7714 | |||||||||
| 1.0 | NGC7714 | ||||||||||
| 1.5 | NGC7714 | ||||||||||
| 2.0 | NGC7714 | ||||||||||
| Circinus | 0.5 | NGC1614 | |||||||||
| 1.0 | Arp220 | ||||||||||
| 1.5 | Arp220 | ||||||||||
| 2.0 | Arp220 | ||||||||||
| NGC 1068 | 0.5 | IRAS17208-0014 | |||||||||
| 1.0 | Mrk52 | ||||||||||
| 1.5 | NGC1614 | ||||||||||
| 2.0 | Mrk52 | ||||||||||
| NGC 4151 | 0.5 | M82 | |||||||||
| 1.0 | M82 | ||||||||||
| 1.5 | M82 | ||||||||||
| 2.0 | Mrk52 | ||||||||||
| J1430+1339 | 0.5 | M82 | |||||||||
| 1.0 | NGC1614 | ||||||||||
| 1.5 | NGC1614 | ||||||||||
| 2.0 | NGC7714 | ||||||||||
| J1509+0434 | 0.5 | NGC7714 | |||||||||
| 1.0 | NGC7714 | ||||||||||
| 1.5 | NGC7714 | ||||||||||
| 2.0 | NGC7714 | ||||||||||
| J1100+0846 | 0.5 | M82 | |||||||||
| 1.0 | M82 | ||||||||||
| 1.5 | M82 | ||||||||||
| 2.0 | M82 | ||||||||||
| J1010+0612 | 0.5 | NGC7714 | |||||||||
| 1.0 | NGC7714 | ||||||||||
| 1.5 | Mrk52 | ||||||||||
| 2.0 | Mrk52 | ||||||||||
| J1356+1026 | 0.5 | Arp220 | |||||||||
| 1.0 | Arp220 | ||||||||||
| 1.5 | IRAS17208-0014 | ||||||||||
| 2.0 | IRAS17208-0014 |