A-optimal Designs under Generalized Linear Models
Abstract
Designing efficient experiments under practical constraints is critical in both scientific research and industrial practice. Focusing on minimizing the average variance of the parameter estimates, A-optimal designs show advantages in screening factors and reducing prediction errors. Compared with other criteria, however, algorithms and software for generating A-optimal designs are scarce. In this paper, we characterize A-optimal designs under generalized linear models theoretically and develop efficient algorithms for identifying them. When a predetermined finite set of experimental settings is given, we derive analytic solutions or establish necessary and sufficient conditions for obtaining A-optimal approximate allocations. We show that a lift-one algorithm based on our formulae outperforms commonly used algorithms for finding A-optimal allocations. When continuous factors or design regions get involved, we develop a ForLion algorithm that is guaranteed to find A-optimal designs with mixed factors. Numerical studies show that our algorithms can find highly efficient designs with reduced numbers of distinct experimental settings, which may save both experimental time and cost significantly. Along with a rounding-off algorithm that converts approximate allocations to exact ones, we demonstrate that stratified samplers based on A-optimal allocations may provide more accurate parameter estimates than commonly used samplers.
Key words and phrases: Analytic solution, ForLion algorithm, Lift-one algorithm, Mixed factors, Rounding algorithm, Stratified sampling
1 Introduction
Designing efficient experiments or clinical trials under practical constraints, such as budget, logistics, or ethical considerations, is a fundamental problem in many applied studies. In practice, researchers often face a large pool of heterogeneous experimental units or individuals but can only collect responses from a limited number of subjects, making the choice of sampling allocation critical for more accurate estimation and prediction.
As an illustration, we consider a paid research study with volunteers grouped into six categories based on gender and age (Huang et al., 2025). Suppose the budget allows only participants, and we aim to select a stratified sample to investigate the treatment effect under a logistic regression model. Standard allocations, such as proportional or uniform stratification, can be suboptimal, while the D-optimal allocation improves estimation accuracy of model parameters. Using our proposed algorithms (see Algorithms 1 & 3), an A-optimal allocation further reduces estimation errors for parameters of interest and achieves lower prediction errors for treatment effects (see Example 4), illustrating the potential benefits by using A-optimal designs.
In this paper, we consider experiments with a univariate response whose probability distribution belongs to the exponential family with a single parameter in its canonical form . Examples, along with listed in Table S.1 of Section S2 in the Supplementary Material, include Bernoulli and binomial distributions for binary responses, Poisson distribution for count responses, Gamma and Inverse Gaussian (IG) distributions for positive responses, and normal distribution for general responses. Suppose are collected independently with covariates , respectively, where . A generalized linear model (McCullagh and Nelder, 1989; Dobson and Barnett, 2018) consists of a link function , a list of predictor functions , and the corresponding parameters of interest , such that
| (1) |
where . For many applications, represents the intercept, and , known as a main-effects model. If there are only distinct experimental settings with the numbers of replicates , respectively, the Fisher information matrix can be written as (Dobson and Barnett, 2018; Yang and Mandal, 2015) , where is the sample size, is the model matrix, and with , and , .
To estimate the parameters more accurately, we aim to find either the “optimal” for a given set of experimental settings (see Section 2), or the “optimal” for a given design space , such that and (see Section 3). Since the maximum likelihood estimator of has an asymptotic covariance matrix (McCullagh and Nelder, 1989; Dobson and Barnett, 2018; Khuri et al., 2006) that is the inverse of , we look for an A-optimal design or maximizing , which is the inverse (up to a constant) of the average variance of parameter estimators (Elfving, 1952). Since depends on for most generalized linear models (GLMs), we adopt the local optimality approach of Chernoff (1953) with an assumed , which may be estimated from a pilot or previous study (see Ford et al. (1992) for more justifications on the significance of locally optimal designs).
Compared with D-optimal designs maximizing (Wald, 1943), A-optimal designs are much more difficult to construct and study (Chen et al., 2023), and the corresponding algorithms and software are scarce (Jones et al., 2021). The theoretical results on A-optimal designs often either require additional technical conditions (Sitter and Wu, 1993; Mathew and Sinha, 2001; Yang, 2008; Chen et al., 2023), or focus on special cases such as binary responses (Sitter and Wu, 1993; Mathew and Sinha, 2001; Yang, 2008), Gamma models (Gaffke et al., 2019; Chen et al., 2023), Inverse Gaussian models (Chen et al., 2023), with one factor (Sitter and Wu, 1993; Yang, 2008; Chen et al., 2023) or two factors only (Gaffke et al., 2019).
On the other hand, Jones et al. (2021) showed that A-optimal designs can do better than D-optimal ones in screening experiments under linear models (i.e., normal models in GLMs), and Chen et al. (2026)’s recent study implied that A-optimal designs are more efficient than D-optimal ones (99.64% versus 84.98%) in terms of their generalized integrated variance for differences criterion under linear models when the experimental region is symmetric.
In this paper, we characterize A-optimal designs under a fairly general GLM, including but not limited to the models listed in Table S.1. When a predetermined finite set of experimental settings is given, we provide analytic solutions for A-optimal approximate allocation (Theorem 1) if , and analytic necessary and sufficient conditions for identifying A-optimal allocations (Theorems 2 and 3) when . Similarly to the lift-one algorithm for D-optimality (Yang et al., 2016; Yang and Mandal, 2015), we develop a lift-one A-optimality algorithm (Algorithm 1), which outperforms commonly used algorithms for finding A-optimal allocations (see Example 3). When some factors are continuous, we follow the ForLion algorithm for D-optimality (Huang et al., 2024) and develop a ForLion A-optimality algorithm (Algorithm 2) that is guaranteed to find A-optimal designs with mixed factors (Theorem 4 and Corollary 4). Numerical studies show that our algorithms are able to find highly efficient designs with reduced numbers of design points (see Examples 3, 5 and 6). Along with our rounding-off algorithm (Algorithm 3 in the Supplementary Material), we show that stratified samplers based on A-optimal allocations may provide more accurate estimates on factor effects than commonly used samplers, including D-optimal ones (see Examples 4 and 7).
2 A-optimal Designs for Discrete Factors
In this section, we consider , known as an approximate allocation, given a finite set of experimental settings. It covers the cases when each factor has only a finite number of levels.
If , the A-optimal allocation is , which is trivial. If and , then and is an A-optimal allocation, whose th coordinate is and others are zeros, where . Note that depends on both and the link function . For commonly used GLMs (see Table 5 in the Supplementary Material of Huang et al. (2025)), is one-to-one and differentiable, and , where and .
From now on, we consider the cases with and . For given and assumed , we let and
| (2) |
A (locally) D-optimal allocation is a maximizing , while an (locally) A-optimal allocation is a maximizing . We further denote by , the collection of all feasible approximate allocations. To avoid trivial maximization problems, we assume , that is, there exists a , such that, . Since is a matrix with a rank no more than , is required for the existence of . For the same reason, we assume to avoid trivial cases.
2.1 A-optimal designs when
When , the design is saturated and can be obtained analytically.
Theorem 1.
Consider the GLM (1) with , , and for each . Then an allocation is A-optimal if and only if
, where is the th diagonal element of .
The proof of Theorem 1, as well as other proofs, is relegated to Section S5 in the Supplementary Material. According to Theorem 1, an A-optimal design with must satisfy . In other words, a uniform design with is not A-optimal in general, which is different from D-optimality (see, e.g., Theorem 3.2 in Yang and Mandal (2015)).
As a special case, for a full factorial design, , and
in the lexicographical order of factor levels (Cheng, 2016), where “” stands for the Kronecker product (see, e.g., Section 11.1 in Seber (2008)) of matrices. In this case and we have the following corollary.
Corollary 1.
For a full factorial design under a GLM, an allocation is A-optimal if and only if . Furthermore, a uniform design with is A-optimal if and only if constant.
Example 1.
Example 2.
full factorial design with zero factor effects Consider a full factorial design under a GLM. Note that in this case. Suppose all effects (both main-effects and interactions) are zero, that is, . Then , the intercept, and . According to Corollary 1, the uniform design with is the only A-optimal allocation. In other words, a uniform allocation under a GLM is a good one under A-optimality if all factor effects are nearly zeros.
The following corollary covers Theorem 4.1 in Chen et al. (2023) as a special case.
Corollary 2.
Consider a GLM with ,
of full rank, and , . Then an allocation is A-optimal if and only if .
For a GLM with , if (see, e.g., Theorem 1 in Yang (2008)), then we must have .
2.2 A-optimal designs when
It is known that is an order- homogeneous polynomial of (see, e.g., Lemma 3.1 in Yang and Mandal (2015)). More specifically,
| (3) |
where is the submatrix consisting of the , , rows of the model matrix . In Lemma 1 of the Supplementary Material, we show that the objective function (see (2)) of A-optimality can be written as the ratio of an order- homogeneous polynomial and an order- homogeneous polynomial of .
We let be the submatrix of after removing its th column. Then is an order- homogeneous polynomial of . Following Yang et al. (2016) and Yang and Mandal (2015), for , if , we define for , , which is associated with , , whose th coordinate is 1, and the set of distinct design points . We also define , , and . Due to Lemma 1,
| (4) |
According to Lemma 4.1 in Yang and Mandal (2015), if ,
| (5) |
for some constants and . Actually, if , then , ; if , then , ; and if and , then . Note that both and here are relevant to .
In Lemma 4 of the Supplementary Material, we obtain similar results for with constants and . If , we let , ; if , then , .
Due to (4), (5), and Lemma 4, it can be verified that
| (6) |
where and . According to Lemmas 6 and 7 in the Supplementary Material, implies , and implies .
Theorem 2.
Suppose , for each , and . Then the solutions for must belong to one of the four cases: (1) If , , , , , and , then
is attained uniquely at , where ; (2) If and , then is attained uniquely at ; (3) If , , and , then is attained uniquely at ; (4) For all other cases, at the unique .
As a special case of the general equivalence theorem (Kiefer, 1974; Pukelsheim, 1993; Atkinson et al., 2007; Stufken and Yang, 2012; Fedorov and Leonov, 2014), along with Theorem 2, the following theorem provides analytic necessary and sufficient conditions on A-optimality within .
Theorem 3.
Consider the GLM (1) with a predetermined set of distinct design points , , and . Then (i) an A-optimal allocation that maximizes must exist; (ii) the set of A-optimal allocations is convex; and (iii) if there is a satisfying , then is A-optimal among if and only if maximizes associated with for each .
2.3 Lift-one algorithm for A-optimal designs
Inspired by the lift-one algorithm for D-optimality (Yang et al., 2016; Yang and Mandal, 2015), we propose a lift-one algorithm for finding A-optimal allocation under a general GLM with given and , based on Theorems 2 and 3.
Algorithm 1.
Lift-one A-optimality algorithm (for GLMs)
-
Start with arbitrary satisfying , , and . We recommend two options: (i) a uniform initial design with ; (ii) a random initial design with , where are iid from the standard exponential distribution, namely . Compute .
-
Set up a random order of going through .
-
Determine maximizing with based on Theorem 2. Let . Note that .
-
Replace with , with .
-
Repeat until convergence, that is, for each .
Lemma 5 in the Supplementary Material guarantees the initial allocation chosen by Algorithm 1 is meaningful, as long as there exists a satisfying .
As a direct conclusion of Theorem 3 and Lemma 5, we have the following corollary to guarantee that a converged approximate allocation in Algorithm 1 is A-optimal.
Corollary 3.
3 A-optimal Designs with Mixed Factors
In this section, we consider experiments under a GLM with mixed factors. We denote as the collection of numerical levels of the th factor, for . For typical experiments, is a finite closed interval for a continuous factor, or a finite set for a discrete factor. To simplify the notations, we assume that the first factors are continuous. Following Lin et al. (2025), if , i.e., all factors are continuous, we consider a design region ; if , i.e., the factors are mixed, then for some (see Examples 1 & 2 in Lin et al. (2025)); if , i.e., all factors are discrete, then , which has been discussed in Section 2. Note that considered in this paper is always closed and bounded, and thus compact.
In this section, we assume , i.e., there is at least one continuous factor. A feasible design is denoted as , such that , , , and . We denote as the collection of all feasible designs. To avoid trivial optimization problems, we assume that there exists a , such that, , where , . According to (2) and Lemma 3 in the Supplementary Material, implies as well, where .
3.1 Characterization of A-optimal designs under a GLM
For a feasible design , it contains only a finite number of design points, and can be regarded as a discrete probability measure defined on . We let stand for the Fisher information matrix at . Then the Fisher information matrix associated with is . Theoretically, as the limit of a sequence of feasible designs, a general design can be defined as a probability measure on the design space , which may contain infinitely many support points. Following Fedorov and Leonov (2014) and Lin et al. (2025), we denote the collection of general designs as , which is also the collection of probability measures on . Then for each , the corresponding under the GLM (1). Based on Theorems 2.1 and 2.2 in Fedorov and Leonov (2014), we obtain the following theorem assuring that we can find a design with only a finite number of design points that is A-optimal among .
Theorem 4.
For GLM (1), suppose is compact, is continuous, are continuous with respect to all continuous factors of , and there exists a satisfying . Then (i) there exists an A-optimal design that contains no more than design points; (ii) the set of A-optimal designs is convex; and (iii) a design is A-optimal among if and only if
| (7) |
where .
3.2 A ForLion algorithm for A-optimal designs with mixed factor
When there exists at least one continuous factor, we follow Huang et al. (2024) and propose a ForLion algorithm for finding A-optimal designs under a GLM with mixed factors. Given GLM (1), our objective is to determine an A-optimal design that maximizes on (or equivalently, , according to Theorem 4).
Similarly to the original ForLion algorithm (Huang et al., 2024) for D-optimality, given a design at the th iteration, we need to identify a design point maximizing as established by Theorem 4. If , the current design is reported as A-optimal, and the iterative process is terminated. If , the new design point is incorporated into the updated design . Similarly to Theorem 5 in Huang et al. (2024) for D-optimality, we let , denoted as for simplicity, where is determined analytically by the following theorem.
Theorem 5.
Given and , if we consider in the form of with , then must belong to one of the three cases: (1) if , , , , , and , then
(2) if and , then ; (3) for all other cases, , where , , , , , , , , and is the submatrix of after removing its th column.
Following the ForLion algorithm proposed by Huang et al. (2024) for finding D-optimal designs with mixed factors, we propose the following algorithm for finding A-optimal designs under a GLM when there exists at least one continuous factor (i.e., ).
Algorithm 2.
ForLion A-optimality algorithm (for GLMs)
-
Set up a merging threshold and a converging threshold (e.g., , , see Example 8 in the Supplementary Material for relevant discussions).
-
Construct an initial design satisfying and for any . For example, one may randomly choose from or one by one, so that the next point is at least away from all previous points, until some such that . The initial weights are defined either uniformly (i.e., ) or randomly (e.g., proportional to i.i.d. exp(1) random numbers, see Algorithm 1).
-
Merging step: Given at the th iteration, check all pairwise Euclidean distances between ’s. If for some , merge the two points into a new point with weight , and replace by . Repeat the procedure unless the least distance is no less than or further merging leads to a degenerate .
-
Lift-one step: Given with design points , run Algorithm 1 with converging threshold to find the converged allocation . Update with the allocations .
-
Deleting step: Update by removing all ’s with .
-
New point step: Given , find that maximizes . Recall that the first factors are continuous. If and , we denote , , and thus . For each , we use the “L-BFGS-B” quasi-Newton method (see Remark 1 in the Supplementary Material) to find , which depends on . Then we obtain by finding . If and , we find by using the “L-BFGS-B” quasi-Newton method directly.
-
If , go to Step . Otherwise, we let , replace by , and go back to Step , where is given by Theorem 5.
-
Report as an A-optimal design.
As a direct conclusion of Theorem 4, the design reported by Algorithm 2 must be A-optimal due to its Step .
Corollary 4.
Conclusions like Corollary 4 (see also Theorem 1 and Remark 2 in Huang et al. (2024)) make ForLion algorithms different from stochastic optimization algorithms such as particle swarm optimization (PSO), which do not guarantee an optimal solution to be found (Kennedy and Eberhart, 1995; Poli et al., 2007; Huang et al., 2024). Compared with commonly used algorithms that discretize the continuous factors first (see, e.g., Yang et al. (2013) and Harman et al. (2020)), Algorithm 2 is able to find highly efficient designs with reduced numbers of design points (see Example 5).
4 Simulation Studies and Applications
In this section we begin with a simulation study (Example 3) to demonstrate the advantages of Algorithm 1 against some commonly used algorithms for the same purpose. Next, we examine a real example of paid research studies (Example 4) to show that compared with D-optimal allocations, an A-optimal one may lead to more accurate parameter estimates and predictions on new observations (see also Example 7 in the Supplementary Material).
We then use Example 5 with three continuous factors to show that Algorithm 2 outperforms the REX algorithm implemented in the R package OptimalDesign (see also Example 3), which discretizes the continuous factors first. In Example 6 about a real potato packing study, we compare the A-optimal designs found by Algorithm 2 and the one reported by Li and Deng (2021) based on their sequential approach. More examples about Algorithm 2 can be found in the Supplementary Material (see Example 8 for a logistic regression model and Example 9 under a Gamma model).
Example 3.
Comparison of algorithms for finding A-optimal allocations Following Table 2 in Yang et al. (2016), to compare different algorithms, we adopt a experiment under a main-effects logistic regression model, , where , , , and .
Similarly to Yang et al. (2016), for each , we generate 100 sets of parameters , with each drawn independently from a uniform distribution . For each simulated , we treat it as the true parameter vector and determine A-optimal allocations using one of the following algorithms: (i) Algorithm 1 in Section 2.3; (ii) classical optimization methods based on R function constrOptim, including Nelder-Mead, quasi-Newton, conjugate-gradient, and simulated annealing (Nocedal and Wright, 1999); (iii) algorithms implemented by R package OptimalDesign (Harman and Filová, 2025) including their randomized exchange algorithm (REX, see also Harman et al. (2020)), a vertex-direction method (VDM, see also Fedorov and Hackl (2025)), and a multiplicative algorithm (MUL, see also Silvey et al. (1978)).
| Total computation time in seconds across 100 simulations | ||||||||
|---|---|---|---|---|---|---|---|---|
| Experiment | Algorithm 1 | Nelder-Mead | Quasi-Newton | Conjugate Gradient | Simulated Annealing | REX | VDM | MUL |
| 0.22 | 0.64 | 0.27 | 2.36 | 48.26 | 0.56 | 156.45 | 0.97 | |
| 0.72 | 4.01 | 0.61 | 3.64 | 54.35 | 1.99 | 596.78 | 1.04 | |
| 3.70 | 11.35 | 1.67 | 6.09 | 68.33 | 7.83 | 2536.88 | 3.37 | |
| 22.34 | 20.16 | 9.50 | 12.94 | 98.75 | 112.81 | 3608.08 | 59.16 | |
| 83.87 | 25.78 | 6.96 | 9.68 | 130.32 | 130.02 | 4901.03 | 148.53 | |
| 405.85 | 81.81 | 39.14 | NA | 516.36 | 650.24 | 4887.25 | 1022.8 | |
| Average number of support points over 100 simulations | ||||||||
| Experiment | Algorithm 1 | Nelder-Mead | Quasi-Newton | Conjugate Gradient | Simulated Annealing | REX | VDM | MUL |
| 3.40 | 4.00 | 4.00 | 4.00 | 4.00 | 3.40 | 3.40 | 4.00 | |
| 5.84 | 8.00 | 8.00 | 8.00 | 8.00 | 5.82 | 5.89 | 7.95 | |
| 9.59 | 16.00 | 16.00 | 16.00 | 16.00 | 9.42 | 10.09 | 15.60 | |
| 14.02 | 32.00 | 32.00 | 32.00 | 32.00 | 13.57 | 16.49 | 27.07 | |
| 19.91 | 64.00 | 64.00 | 64.00 | 64.00 | 18.76 | 26.50 | 48.37 | |
| 28.17 | 128.00 | 128.00 | NA | 128.00 | 25.79 | 41.96 | 91.14 | |
| Average relative efficiency over 100 simulations | ||||||||
| Experiment | Algorithm 1 | Nelder-Mead | Quasi-Newton | Conjugate Gradient | Simulated Annealing | REX | VDM | MUL |
| 100.00 | 100.00 | 100.00 | 100.00 | 83.99 | 100.00 | 100.00 | 100.00 | |
| 100.00 | 99.96 | 100.00 | 99.83 | 77.42 | 100.00 | 100.00 | 100.00 | |
| 100.00 | 99.28 | 100.00 | 97.66 | 72.54 | 100.00 | 100.00 | 100.00 | |
| 100.00 | 94.37 | 99.99 | 90.68 | 66.86 | 100.00 | 100.00 | 100.00 | |
| 100.00 | 75.98 | 99.97 | 83.89 | 61.92 | 100.01 | 100.01 | 100.01 | |
| 100.00 | 60.47 | 98.54 | NA | 58.13 | 100.01 | 100.01 | 100.01 | |
The total computation time in seconds reported in Table 1 (and elsewhere in this paper) were obtained on a Windows-based laptop with 12th Gen Intel Core i7-1260P processor (2.10 GHz) and 8 GB memory (5200 MT/s). As a comprehensive comparison, Table 1 also reports the average number of support points (i.e., design points with positive allocations), and the average relative efficiency with respect to obtained by our Algorithm 1 (i.e., ). Overall, Algorithm 1 demonstrates notable advantages across multiple evaluation metrics. It is consistently faster than simulated annealing, REX, VDM, and MUL. Regarding design sparsity, it needs much less support points than other algorithms, except REX, which produces comparable sparsity. As pointed out by Huang et al. (2024), in many applications, a smaller number of support points indicates reduced time and cost of the experiment. In terms of relative efficiency, it is comparable with REX, VDM, and MUL, and outperforms the classical optimization algorithms in finding A-optimal designs.
Example 4.
Paid research study Inspired by Example 6 in Huang et al. (2025), we use a paid research study scenario to illustrate the difference between A-optimal and D-optimal allocations. Suppose there are eligible volunteers, grouped into categories according to gender ( for female, for male) and age ( for , for , and for or above). Then the covariate setting is , or , with corresponding population sizes , for . The responses of participants are either for no treatment effect, or for effective treatment. Following Huang et al. (2025), we assume a logistic regression model (see also Example 3) as follows:
| (8) |
where , , is the response of the th volunteer in the th category, stands for an indicator function, and .
Suppose the budget allows participants and stratified sampling is adopted. Given a predetermined integer-valued allocation , such that , known as an exact allocation, we randomly choose out of volunteers in the th category. The proportionally stratified allocation is , a uniformly stratified allocation is , and the (locally) D-optimal allocation is or . By using Algorithms 1 and 3 (a rounding-off algorithm in the Supplementary Material), we obtain the (locally) A-optimal allocation or .
To compare the accuracy of parameter estimates based on different allocations or samplers, we use the root mean squared error (RMSE), , given an index set of parameters of interest. For each of simulations, responses for all volunteers are generated from (8), and samples of size are drawn using the simple random sample without replacement (SRSWOR, see Lohr (2022)), proportionally stratified sampler (), uniformly stratified sampler (), D-optimal sampler (), and A-optimal sampler (). Parameter estimates and corresponding RMSEs are computed; their averages and standard deviations (sd) are reported in Table 2, together with RMSEs based on the full data (i.e., volunteers) for readers’ reference.
| Sampler | all except | ||||
|---|---|---|---|---|---|
| Full Data | 0.073(0.051) | 0.267(0.147) | 0.106(0.078) | 0.194(0.144) | 0.338(0.298) |
| SRSWOR | 0.362(0.331) | 9.133(3.853) | 0.730(2.092) | 7.026(7.753) | 12.229(5.599) |
| Proportionally Stratified | 0.378(0.289) | 9.155(3.386) | 0.909(2.526) | 5.768(7.464) | 12.759(5.235) |
| Uniformly Stratified | 0.287(0.251) | 4.813(5.153) | 3.567(6.393) | 3.709(6.536) | 2.736(5.654) |
| D-optimal | 0.204(0.186) | 3.104(4.232) | 2.365(5.127) | 1.924(4.621) | 1.978(4.683) |
| A-optimal | 0.213(0.165) | 2.281(3.740) | 2.109(4.916) | 1.458(3.889) | 1.132(3.241) |
According to the column “all except ” in Table 2 (), the proportionally stratified sampler and SRSWOR are the least accurate ones, the uniformly stratified sampler is better, and so is the D-optimal sampler, and the A-optimal sampler seems the best. Compared with the D-optimal sampler, the A-optimal sampler achieves smaller RMSE for each except , which is typically of less interest in practice.
Prediction accuracy is further evaluated using cross-entropy (CE) loss on predicting the responses of unsampled individuals (see Remark 2 in the Supplementary Material). Over simulations, the A-optimal sampler achieves the lowest mean CE of with the least variation (see Figure 2), the D-optimal sampler is the second lowest with a mean CE of . Both substantially outperform SRSWOR (), the proportionally stratified sampler (), and the uniformly stratified sampler ().

Example 5.
Comparison of Algorithm 2 and the REX algorithm We revisit Example 4.7 in Stufken and Yang (2012) (see also Example 2 in Huang et al. (2024)) under a logistic regression model, with and three continuous factors , , and . We compare Algorithm 2 with the REX algorithm (see also Example 3) in R package OptimalDesign (Harman and Filová, 2025), which can find an A-optimal design in this case by discretizing the continuous factors first.
| Grid level | of levels of factors | of support points | Time cost in seconds | Relative efficiency w.r.t. |
|---|---|---|---|---|
| 0.05 | (81,41,121) | 13 | 2.99 | 99.9951% |
| 0.02 | (201,101,301) | 13 | 59.17 | 99.9992% |
| 0.0125 | (321,161,481) | 10 | 247.92 | 96.0565% |
| 0.01 | (401,201,601) | - | - | - |
Algorithm 2 yields an A-optimal design with support points in seconds. Table 3 summarizes the A-optimal designs obtained by REX under different grid levels, where each continuous factor is first discretized into equally spaced grid points with spacing over its design region. With relatively coarse grids, REX achieves high relative efficiency but requires more support points, whereas finer grids substantially increase computational cost, degrade efficiency, or fail to return a solution (). Overall, by directly searching the continuous design space, Algorithm 2 produces highly efficient designs with fewer support points and remains computationally feasible for designs with multiple continuous factors.
Example 6.
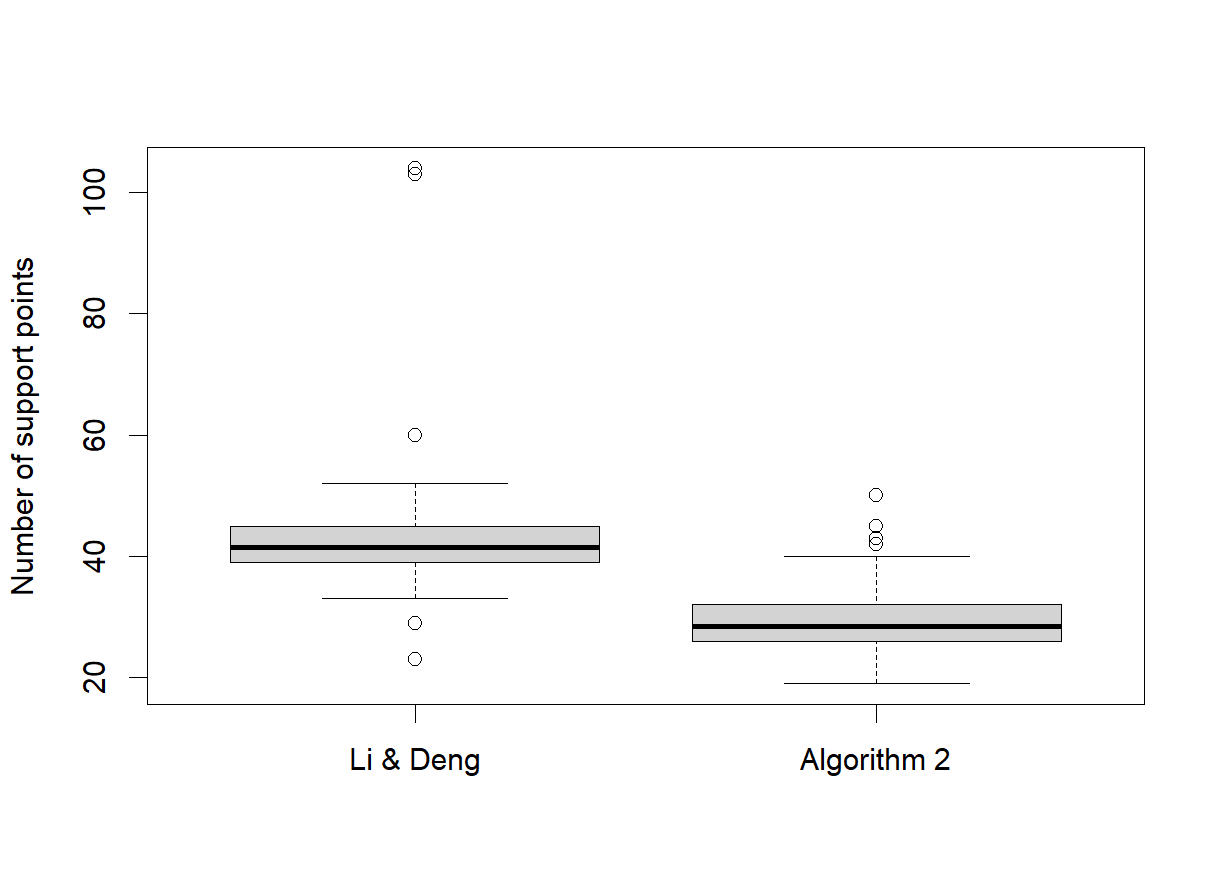
A-optimal design for the potato packing experiment We consider a real-world example from a potato packing study described by Woods et al. (2006) and revisited later by Li and Deng (2021). A binary response indicates the presence of liquid after seven days of storage. Three standardized continuous factors are involved, namely the vitamin concentration in the prepackaging dip and the levels of two gases in the packaging atmosphere, with the design space . For comparison purposes, we adopt the same model and parameter setting considered in Li and Deng (2021), namely with and . In this example, we compare the A-optimal designs obtained by our Algorithm 2 or Li and Deng (2021)’s sequential algorithm, which combines the Fedorov-Wynn algorithm (Wynn, 1970) and the multiplicative algorithm (Titterington, 1978) and is implemented in Matlab. Using Algorithm 2, the resulting A-optimal design has support points, compared with points of Li and Deng (2021)’s design. In terms of A-efficiency, Algorithm 2 achieves about higher.
To compare the algorithms across different parameter settings, we conduct a simulation study with 100 parameter vectors sampled from a multivariate normal distribution centered at (see Table 5 in Woods et al. (2006)). For each simulated parameter vector, we obtain A-optimal designs using Algorithm 2 and Li and Deng (2021)’s algorithm, respectively. Overall, the designs obtained by Algorithm 2 have fewer support points in 97 cases (see Figure 2) and higher A-efficiencies in 65 cases (results not shown here). A paired -test with -value shows that the improvement by Algorithm 2 is significant in terms of A-criterion.
Supplementary Material
The Supplementary Material consists of six sections: S1 provides a list of notations in the main text to facilitate users’ reading; S2 summarizes some commonly used exponential family distributions in Table S.1; S3 provides a round-off algorithm (Algorithm 3) to convert an approximate allocation to an exact allocation; S4 contains lemmas for Sections 2.2 & 2.3 and two remarks (1 & 2); S5 contains proofs of lemmas, theorems, and corollaries; S6 provides more examples on logit models with discrete factors (Example 7), a continuous factor (Example 8), or a Gamma regression model with two continuous factors (Example 9).
Data Availability Statement
The data that support the findings of this study are available from the corresponding author, J.Y., upon reasonable request.
Acknowledgments
The authors gratefully acknowledge the authors of Li and Deng (2021) for kindly sharing their source codes, which we used to implement and compare their methods with ours.
References
- (1)
- Atkinson et al. (2007) Atkinson, A., Donev, A. and Tobias, R. (2007), Optimum Experimental Designs, with SAS, Oxford University Press.
- Byrd et al. (1995) Byrd, R., Lu, P., Nocedal, J. and Zhu, C. (1995), ‘A limited memory algorithm for bound constrained optimization’, SIAM Journal on Scientific Computing 16, 1190–1208.
- Chen et al. (2023) Chen, P.-Y., Chen, R.-B., Chen, Y.-S. and Wong, W. K. (2023), ‘Numerical methods for finding A-optimal designs analytically’, Econometrics and Statistics 28, 155–162.
- Chen et al. (2026) Chen, Y., Francq, B. G. and Goos, P. (2026), ‘Optimal experimental designs for process robustness studies’, Technometrics pp. 1–13.
- Cheng (2016) Cheng, C.-S. (2016), Theory of Factorial Design, Chapman and Hall/CRC.
- Chernoff (1953) Chernoff, H. (1953), ‘Locally optimal designs for estimating parameters’, Annals of Mathematical Statistics 24, 586–602.
- Dobson and Barnett (2018) Dobson, A. and Barnett, A. (2018), An Introduction to Generalized Linear Models, 4 edn, Chapman & Hall/CRC.
- Elfving (1952) Elfving, G. (1952), ‘Optimum allocation in linear regression theory’, The Annals of Mathematical Statistics 23(2), 255–262.
- Fedorov and Leonov (2014) Fedorov, V. and Leonov, S. (2014), Optimal Design for Nonlinear Response Models, Chapman & Hall/CRC.
- Fedorov and Hackl (2025) Fedorov, V. V. and Hackl, P. (2025), Model-Oriented Design of Experiments, 2 edn, Springer Science & Business Media.
- Ford et al. (1992) Ford, I., Torsney, B. and Wu, C. (1992), ‘The use of a canonical form in the construction of locally optimal designs for non-linear problems’, Journal of the Royal Statistical Society, Series B 54, 569–583.
- Gaffke et al. (2019) Gaffke, N., Idais, O. and Schwabe, R. (2019), ‘Locally optimal designs for gamma models’, Journal of Statistical Planning and Inference 203, 199–214.
- Harman and Filová (2025) Harman, R. and Filová, L. (2025), OptimalDesign: A Toolbox for Computing Efficient Designs of Experiments. R package version 1.0.2.1.
- Harman et al. (2020) Harman, R., Filová, L. and Richtárik, P. (2020), ‘A randomized exchange algorithm for computing optimal approximate designs of experiments’, Journal of the American Statistical Association 115(529), 348–361.
- Hastie et al. (2017) Hastie, T., Tibshirani, R. and Friedman, J. (2017), The Elements of Statistical Learning: Data Mining, Inference, and Prediction, 2 edn, Springer.
- Huang et al. (2024) Huang, Y., Li, K., Mandal, A. and Yang, J. (2024), ‘ForLion: A new algorithm for D-optimal designs under general parametric statistical models with mixed factors’, Statistics and Computing 34, 157.
- Huang et al. (2025) Huang, Y., Tong, L. and Yang, J. (2025), ‘Constrained D-optimal design for paid research study’, Statistica Sinica 35, 1479–1498.
- Jeng et al. (2008) Jeng, S.-L., Joseph, V. R. and Wu, C. J. (2008), ‘Modeling and analysis strategies for failure amplification method’, Journal of Quality Technology 40(2), 128–139.
- Jones et al. (2021) Jones, B., Allen-Moyer, K. and Goos, P. (2021), ‘A-optimal versus D-optimal design of screening experiments’, Journal of Quality Technology 53(4), 369–382.
- Joseph and Wu (2004) Joseph, V. and Wu, C. (2004), ‘Failure amplification method: an information maximization approach to categorical response optimization (with discussions)’, Technometrics 46, 1–31.
- Kennedy and Eberhart (1995) Kennedy, J. and Eberhart, R. (1995), Particle swarm optimization, in ‘Proceedings of ICNN’95-International Conference on Neural Networks’, Vol. 4, IEEE, pp. 1942–1948.
- Khuri et al. (2006) Khuri, A., Mukherjee, B., Sinha, B. and Ghosh, M. (2006), ‘Design issues for generalized linear models: A review’, Statistical Science 21, 376–399.
- Kiefer (1974) Kiefer, J. (1974), ‘General equivalence theory for optimum designs (approximate theory)’, Annals of Statistics 2, 849–879.
- Li and Deng (2021) Li, Y. and Deng, X. (2021), ‘An efficient algorithm for elastic I-optimal design of generalized linear models’, Canadian Journal of Statistics 49(2), 438–470.
- Lin et al. (2025) Lin, S., Huang, Y. and Yang, J. (2025), ‘EW D-optimal designs for experiments with mixed factors’, arXiv preprint arXiv:2505.00629 .
- Lohr (2022) Lohr, S. (2022), Sampling: Design and Analysis, 3 edn, Chapman and Hall/CRC.
- Mathew and Sinha (2001) Mathew, T. and Sinha, B. K. (2001), ‘Optimal designs for binary data under logistic regression’, Journal of Statistical Planning and Inference 93, 295–307.
- McCullagh and Nelder (1989) McCullagh, P. and Nelder, J. (1989), Generalized Linear Models, 2 edn, Chapman and Hall/CRC.
- Nocedal and Wright (1999) Nocedal, J. and Wright, S. (1999), Numerical Optimization, Springer.
- Poli et al. (2007) Poli, R., Kennedy, J. and Blackwell, T. (2007), ‘Particle swarm optimization: An overview’, Swarm Intelligence 1, 33–57.
- Pukelsheim (1993) Pukelsheim, F. (1993), Optimal Design of Experiments, John Wiley & Sons.
- Pukelsheim and Rieder (1992) Pukelsheim, F. and Rieder, S. (1992), ‘Efficient rounding of approximate designs’, Biometrika 79, 763–770.
- Seber (2008) Seber, G. (2008), A Matrix Handbook for Statisticians, Wiley.
- Silvey et al. (1978) Silvey, S., Titterington, D. and Torsney, B. (1978), ‘An algorithm for optimal designs on a finite design space’, Communications in Statistics - Theory and Methods 14, 1379–1389.
- Sitter and Wu (1993) Sitter, R. and Wu, C. (1993), ‘Optimal designs for binary response experiments: Fieller, D, and A criteria’, Scandinavian Journal of Statistics 20(4), 329–341.
- Stufken and Yang (2012) Stufken, J. and Yang, M. (2012), Optimal designs for generalized linear models, in K. Hinkelmann, ed., ‘Design and Analysis of Experiments, Volume 3: Special Designs and Applications’, Wiley, chapter 4, pp. 137–164.
- Titterington (1978) Titterington, D. (1978), ‘Estimation of correlation coefficients by ellipsoidal trimming’, Journal of the Royal Statistical Society, Series C (Applied Statistics) 27, 227–234.
- Wald (1943) Wald, A. (1943), ‘On the efficient design of statistical investigations’, The Annals of Mathematical Statistics 14(2), 134–140.
- Woods et al. (2006) Woods, D., S.M. Lewis, S. M., Eccleston, J. and Russell, K. (2006), ‘Designs for generalized linear models with several variables and model uncertainty’, Technometrics 48, 284–292.
- Wynn (1970) Wynn, H. (1970), ‘The sequential generation of D-optimum experimental designs’, Annals of Mathematical Statistics 41, 1655–1664.
- Yang and Mandal (2015) Yang, J. and Mandal, A. (2015), ‘D-optimal factorial designs under generalized linear models’, Communications in Statistics - Simulation and Computation 44, 2264–2277.
- Yang et al. (2016) Yang, J., Mandal, A. and Majumdar, D. (2016), ‘Optimal designs for factorial experiments with binary response’, Statistica Sinica 26, 385–411.
- Yang (2008) Yang, M. (2008), ‘A-optimal designs for generalized linear models with two parameters’, Journal of Statistical Planning and Inference 138, 624 – 641.
- Yang et al. (2013) Yang, M., Biedermann, S. and Tang, E. (2013), ‘On optimal designs for nonlinear models: a general and efficient algorithm’, Journal of the American Statistical Association 108, 1411–1420.
A-optimal Designs under Generalized Linear Models
Yingying Yang1, Xiaotian Chen2, and Jie Yang1
1University of Illinois at Chicago and 2Nankai University
Supplementary Material
- S1
-
List of notations in the main text
- S2
-
Commonly used exponential family distributions
- S3
-
Round-off algorithm
- S4
-
Lemmas and remarks
- S5
-
Proofs
- S6
-
Additional examples
S1 List of notations in the main text
-
Nonnegative constant in , note that depends on , , and , see the context of equation (5)
-
Nonnegative constant , note that it depends on , , and , see the context of equation (6)
-
A matrix, , see Remark 1
-
Nonnegative constant in , , note that also depends on , , and , see Lemma 4
-
Nonnegative constant in , note that depends on , , and , see the context of equation (5)
-
Nonnegative constant , note that it depends on , , and , see the context of equation (6)
-
Function of in the canonical form of
-
Nonnegative constant in , , note that also depends on , , and , see Lemma 4
-
Function of in the canonical form of
-
The th diagonal element of
-
Number of covariates or experimental factors under consideration,
-
Collection of level combinations of discrete factors under consideration, if
-
Function of in the canonical form of
-
Vector in whose th coordinate is and others are zeros
-
Fisher information matrix in
-
Fisher information matrix at , i.e.,
-
Probability density function or probability mass function of
-
Objective function for D-optimality of , under a GLM, is an order- homogeneous polynomial of
-
Fisher information matrix associated with ,
under a GLM, -
Objective function for D-optimality of ,
-
Fisher information matrix of , under a GLM, for , or for
-
, given
, , -
,
given , , , -
, an order- homogeneous polynomial of ,
-
, an order- homogeneous polynomial of ,
-
Link function for a generalized linear model, such that,
-
Objective function for A-optimality of , under a GLM,
-
Objective function for A-optimality of , under a GLM,
-
, which also equals to and , given , ,
-
Range of numerical levels of the th factor, , is a finite closed interval for continuous factors, or a finite set for discrete factors
-
Index set, , with if
-
Left end of the range of numerical levels of the th factor,
-
Number of distinct design points or support points in a design
-
Total number of experimental units
-
Exact design given , s.t.,
-
Number of experimental units assigned to or associated with , , note that
-
Number of parameters for a generalized linear model
-
Vector of predictor functions, , taking values at
-
The th predictor function taking values at the th covariate vector or experimental setting ,
-
Right end of the range of numerical levels of the th factor,
-
Number of continuous factors,
-
Function defined by for each
-
Collection of all approximate allocations for experimental settings or design points,
-
Collection of all feasible approximate allocations of design points, i.e.,
-
Approximate allocation for a design with support points , that is, , such that, and
-
-
Proportion of experimental units assigned to or associated with , ,
-
, for
-
Weight matrix of , i.e.,
-
-
Design space or design region of design points, takes the form of if all factors are continuous, with mixed factors, or itself if all factors are discrete
-
, submatrix of . consisting of the th, , th rows of
-
The th covariate vector or experimental setting,
-
The th predictor vector associated with ,
-
Numerical level of the th covariate or factor associated with the covariate vector or experimental setting ,
-
submatrix of after removing its th column
-
Model matrix of , i.e.,
-
submatrix of after removing its th column
-
Univariate response
-
The th response variable associated with
-
Parameter vector for a GLM,
-
The th model parameter associated with the th predictor function ,
-
Merging threshold for Algorithm 2, e.g.,
-
Converging threshold for Algorithm 2, e.g.,
-
The th linear predictor associated with ,
-
Single parameter for an exponential family distribution
-
Expectation of ,
-
Function defined by , such that,
-
-
A feasible design on , i.e., for some , , and , such that,
-
Collection of feasible designs on ,
-
Collection of general designs on , also the collection of probability measures on , a may contain infinitely many design points
-
Sensitivity function at along the direction of , i.e.,
S2 Commonly used exponential family distributions
We list some commonly used exponential family distributions in Table S.1.
| Model | Range of | Constant | ||
|---|---|---|---|---|
| - | ||||
| - | ||||
S3 Round-off algorithm
Given an approximate design obtained by Algorithm 1, or obtained by Algorithm 2, we need a rounding algorithm to trim it to an exact design consisting of integers given , s.t., , which indicates experimental units are assigned to the experimental setting .
An efficient rounding procedure has been proposed by Pukelsheim and Rieder (1992), which suggested rounding to its next integer (see also function od_PUK in Harman and Filová (2025)). We adopt in this paper the idea of the constrained round-off algorithm (their Algorithm 2) by Huang et al. (2025) that generates feasible exact allocations for D-optimal designs under constraints. More specifically, we recommend Algorithm 3 below to convert an A-optimal approximate allocation into an exact allocation . Different from the efficient rounding procedure by Pukelsheim and Rieder (1992), Algorithm 3 may remove some design points whose weights are too low (see the ESD experiment revisited by Lin et al. (2025)). For our examples when od_PUK is applicable, Algorithm 3 generates the same exact allocations (see Example 4).
Algorithm 3.
Round-off algorithm for obtaining an exact allocation from an A-optimal approximate allocation
-
First let , the largest integer no more than , , and be the leftovers. Denote .
-
While , do
-
2.1
for each , calculate ;
-
2.2
pick up any ;
-
2.3
let and .
-
2.1
-
Output .
S4 Lemmas and remarks
In this section, we provide Lemmas 1, 2, 3, & 4 for Section 2.2, Lemma 5 for Section 2.3, Remark 1 for Step of Algorithm 2, and Remark 2 for Example 4.
Lemma 1.
We let be the submatrix of after removing the th column. If , then
| (S4.1) |
where is an order- homogeneous polynomial of .
Lemma 2.
Suppose for all . Then if and only if . In this case, we have for all .
Lemma 3.
Suppose for all . If , then for all .
Lemma 4.
Suppose . Then
| (S4.2) |
for some constants and . If , then for all , which implies . If , then , ; if , then , .
Lemma 5.
Suppose there exists a satisfying . Then for any satisfying for each , .
Remark 1.
First-order derivative of sensitivity function Theorem 2 for Step of Algorithm 2 and Theorem 5 for Step gain notable advantages on computational simplicity by offering analytic solutions. To fully leverage these benefits, we derive an explicit formula for the first-order derivative of the sensitivity function, which is critical for applying the “L-BFGS-B” quasi-Newton method (Byrd et al., 1995) in Step . To simplify the notation, we denote , which is a known positive definite matrix given and . Then the first-order derivative is
where , if , and if .
Remark 2.
Cross-entropy loss for evaluating prediction error To compare the prediction accuracy of fitted models based on different samplers in Example 4, we denote the whole dataset by . For each sampling procedure, we let be the collection of sampled data with sample size . We obtain from , i.e., the training data, and use the fitted model to predict the responses of the remaining volunteers in , i.e., the testing data. To quantify the prediction errors, we adopt the cross-entropy loss (Hastie et al., 2017):
where and are estimated probabilities based on the fitted model. Since the simulation is repeated independently for times, we obtain CE values for each sampler. The mean CE values over 100 simulations are reported in Example 4.
S5 Proofs
Proof of Theorem 1: In this case, we must have for each to make invertible. Then
Since , then is positive definite and thus for all . It can be verified that maximizes if and only if
or equivalently, , which leads to the conclusion.
Proof of Lemma 1: Rewrite the design matrix , where is the th column of , and an -dimensional vector. Then with entry . Based on the Cramer’s rule in linear algebra, where is the adjugate matrix of with . Therefore the th diagonal entry of is and the trace of is , which leads to the conclusion.
Proof of Lemma 2: According to Lemma 3.1 in Yang and Mandal (2015), we have , where is the submatrix consisting of the , , rows of the design matrix , , and for each . Since we further assume for each , then if and only if there exists one set of satisfying . Since is an matrix with , such a condition is equivalent to that is of full column rank .
Similarly, if and only if is of full column rank , which is guaranteed by .
Since and for all , is a positive semi-definite matrix. If , then is positive definite, which implies that is positive definite as well.
According to the proof of Lemma 1, we know that the th diagonal entry of is , which must be positive. Therefore, for each .
Proof of Lemma 4: According to Lemma 4.1 in Yang and Mandal (2015), given
with as an order- homogeneous polynomial of , we have for some constants and . In our case,
with as an order- homogeneous polynomial of . In other words, for is replaced with for , which is the only change.
As a direct conclusion, for some constants and . In particular, letting , , or , we obtain , and , respectively. Solving for and for two cases ( and ), we obtain the desired results.
Proof of Theorem 2: Under the conditions , for each , and , we denote the index set . Then ,
Fixing , it can be verified that
| (S5.3) |
| (S5.4) |
Note that if , then and .
Similarly, given , it can be verified that
| (S5.5) |
if ; if ; and
| (S5.6) |
We need to show two more lemmas to eliminate some cases for Theorem 2.
Lemma 6.
If , then .
If , according to (S5.5), we must have for all and all . If , then we must have for some . Contradiction! Therefore, , for all . Then , for all , which implies according to (S5.3).
If , , for , implies , or simply . Then , for all , which implies according to (S5.3) with .
Lemma 7.
If , then .
According to (S5.6), we must have for all and all . If , then we must have for some . Contradiction! Therefore, , for all . Then , for all , which implies according to (S5.4).
Now we are ready to prove Theorem 2:
Case (i): and . According to Lemma 4, we must have and . In this case, , which is a monotonic function. Then attained uniquely at .
Case (ii): but . According to Lemma 4, we still have . In this case,
is a quadratic function. It can be verified that if , then
which is attained at the unique ; otherwise,
which is attained at the unique , the same as in Case (i).
Case (iii): and . In this case, we must have and then
According to Lemma 6, we must have and thus . Since , then attained at the unique .
Case (iv): and . In this case, we must have and then
According to Lemma 7, we must have and thus . Then , and attained at the unique .
Case (v): , and . In this case,
where takes values between and , which is always positive.
If , that is, the coefficients of and have different signs, then is a monotone function of , which implies that is a monotone function of . Since implies and , we must have . Then , and attained at the unique .
If , then the coefficients of and have the same sign. If and , it can be verified that strictly decreases before and strictly increases after . In this case, we always have attained at the unique . If and , it can be verified that strictly increases before and strictly decreases after . We can also verify that if and , which implies , we have attained at the unique ; if and , we have
attained at the unique .
Summarizing the results, we obtain the four cases in Theorem 2.
Proof of Theorem 3: First of all, if , that is, and thus for all , then all are A-optimal, and the set of A-optimal allocations is itself and thus convex.
Now we assume that , that is, there exists a , such that . We claim that Assumptions (A1), (A2), (B1) (B4) in Fedorov and Leonov (2014) are all satisfied and thus their Theorem 2.2 can be applied to our case.
Actually, in our case is a collection of finite points in and must be compact. Then Assumption (A1) in Fedorov and Leonov (2014) is satisfied.
Since contains only a finite number of points, then the Fisher information matrix is continuous with respect to , which satisfies Assumption (A2) in Fedorov and Leonov (2014). Actually, suppose satisfying , we must have for all large enough . Therefore, in this case.
According to Section 2.4.2 in Fedorov and Leonov (2014), their Assumptions (B1), (B2), and (B4) are always satisfied for A-optimality. We only need to verify their Assumption (B3). Actually, since there exists a satisfying , according to Lemma 3, is a finite positive number, which qualifies Assumption (B3) in Fedorov and Leonov (2014).
Then (i) and (ii) are direct conclusions of Theorem 2.2 in Fedorov and Leonov (2014). As for (iii), the only thing left is to show that their for each .
We denote with its th coordinate being . Since and has only rank , then . Therefore, implies for each . It can be verified that associated with ,
with , and . Then
implies
| (S5.7) |
where is the gradient of at .
It can be verified that, in this case,
According to Section 2.5 in Fedorov and Leonov (2014), their ,
Then ,
due to (S5.7). Since , then due to Lemma 3. For each , if , then since maximizes for ; if , then we must have due to the same reason. In both cases, we have for each . Due to Theorem 2.2 in Fedorov and Leonov (2014), we must have is A-optimal among .
On the other hand, if is A-optimal among , we claim that for each , maximizes associated with . Actually, if there exists an such that , then , where , which violates the optimality of .
Proof of Lemma 5: We denote such a . According to Lemma 3.1 in Yang and Mandal (2015),
is homogeneous polynomial of up to order . Since and for all , implies the existence of , such that, . Therefore, for the same set of , since for each . Therefore, .
Proof of Corollary 3: Suppose is the initial allocation in Algorithm 1, according to Lemma 5, we must have . Therefore, due to Lemma 3.
Suppose is a converged allocation in Algorithm 1, then we must have due to Step . Since is a converged allocation, maximizes associated with for each due to Step . According to Theorem 3, must be A-optimal among .
On the other hand, if is A-optimal among , we must have . According to Theorem 3, maximizes associated with for each . That is, is a converged allocation in Algorithm 1.
Proof of Theorem 4: First of all, since is compact, then Assumption (A1) in Fedorov and Leonov (2014) is satisfied.
Secondly, we claim that the Fisher information matrix is continuous with respect to , which satisfies Assumption (A2) in Fedorov and Leonov (2014).
Actually, suppose satisfying . If , that is, all factors are continuous, then we must have for each , since is continuous with respect to all continuous factors of . Then
as goes to .
If , that is, the last factors are discrete, with containing only a finite number of distinct points. We denote , for the continuous factors, and for the discrete factors, . Then implies for all large enough . Since is continuous with respect to all continuous factors of , then for each . Thus we also have in this case.
If , that is, all factors are discrete and contains only a finite number of design points. Then we must have for all large enough . Therefore, for each and in this case as well.
According to Section 2.4.2 in Fedorov and Leonov (2014), their Assumptions (B1), (B2), and (B4) are always satisfied for A-optimality. We only need to verify their Assumption (B3). Actually, since there exists a satisfying , according to Theorem 2.1 in Fedorov and Leonov (2014), there always exists a , such that . According to Lemma 3, also implies is a finite positive number, which qualifies Assumption (B3) in Fedorov and Leonov (2014).
Then (i) and (ii) are direct conclusions of Theorem 2.2 in Fedorov and Leonov (2014). As for (iii), the only thing left is that given a feasible design with , the sensitivity function (Fedorov and Leonov, 2014; Huang et al., 2024) at along the direction of is
for each . Then (iii) is obtained from Theorem 2.2 in Fedorov and Leonov (2014) as well.
S6 Additional examples
Example 7.
Printed circuit board In their Example 5.1, Yang and Mandal (2015) modified an experiment on printed circuit boards (PCB) discussed by Jeng et al. (2008). They considered a binary response indicating whether an open circuit fault occurs during the inner layer manufacturing, and two discrete experimental factors, namely Preheat (factor A, two levels) and Lamination Temperature (factor B, three levels). Following Example 3.2 in Yang and Mandal (2015), we denote the model matrix by
| (S6.8) |
whose th row is regarded as with , and whose four columns represent the intercept (), factor A (), the linear component of factor B (), and the quadratic component of factor B (). In other words, the original two discrete factors are now coded as six experimental settings , listed in (see also, e.g., Joseph and Wu (2004)). Under a GLM with Bernoulli distribution and logit link (i.e., a logistic regression model) with assumed parameter values , Yang and Mandal (2015) recommended a D-optimal allocation for .
Since in this case the model matrix (S6.8) is built from a custom set of design points that does not correspond to a full factorial or product space, the R package OptimalDesign (Harman and Filová, 2025) is not applicable, which assumes that the design space is a Cartesian product of factor levels. On the contrary, our Algorithm 1 can incorporate an arbitrary design matrix allowing for non-product-space structures. By applying Algorithm 1, we obtain an A-optimal allocation associated with .
| Sampler | all except | ||||
|---|---|---|---|---|---|
| Full Data | 2.503(0.026) | 0.319(0.216) | 0.018(0.012) | 0.024(0.020) | 0.013(0.010) |
| SRSWOR | 2.506(0.080) | 0.340(0.203) | 0.062(0.043) | 0.085(0.061) | 0.036(0.025) |
| Uniformly/Proportionally | 2.518(0.077) | 0.337(0.194) | 0.052(0.039) | 0.073(0.057) | 0.050(0.036) |
| D-optimal | 2.520(0.090) | 0.339(0.204) | 0.051(0.045) | 0.075(0.068) | 0.048(0.033) |
| A-optimal | 2.514(0.075) | 0.338(0.208) | 0.052(0.043) | 0.065(0.050) | 0.036(0.027) |
| Sampler | all except | ||||
|---|---|---|---|---|---|
| SRSWOR | 1.0000 | 1.0000 | 0.7600 | 0.1200 | 1.0000 |
| Uniformly/Proportionally | 1.0000 | 1.0000 | 1.0000 | 1.0000 | 0.0024 |
| D-optimal | 1.0000 | 1.0000 | 1.0000 | 1.0000 | 0.0136 |
Similarly to Example 4, we use to compare the estimation accuracy of model parameters based on different samplers. In this case, we simulate responses for each and treat the total observations as the target population or whole dataset, denoted by . Suppose we aim to sample observations out of . By applying Algorithm 3, we convert each given approximate allocation to an exact allocation , such that . In this case, both the proportionally and uniformly stratified exact allocations are . The D-optimal exact allocation is , and A-optimal exact allocation is . Given an exact allocation , we pick up a simple random sample of size from observations associated with , , and denote the collection of sampled observations by with . Similarly to Example 4, we estimate and compute the RMSE for each of 100 independent simulations.
The average and standard deviation (sd) of RMSEs over 100 simulations are listed in Table S.2. In terms of the RMSEs for , the uniformly (and proportionally) stratified sampler, the D-optimal and A-optimal samples have comparable accuracy and all better than SRSWOR (not significantly according to Table S.3 though). In terms of estimations for , SRSWOR and the A-optimal allocation seem to yield lower RMSE values than the uniformly (and proportionally) stratified sampler and the D-optimal sampler (significantly according to Table S.3). Overall, we conclude that the A-optimal sampler provides more accurate estimates on non-intercept parameters in this case. The -values of two-sided pairwise -tests listed in Table S.3 confirm our conclusion.
Example 8.
Logistic model with one continuous factor In Example 1 of Yang (2008), a two-parameter logistic regression model with one continuous factor is considered, such that, and as in (1). Given and , Yang (2008) obtained theoretically a (locally) A-optimal design . By applying Algorithm 2 with and , we obtain an A-optimal design , which is fairly close to . Its relative efficiency is .
To further illustrate the effects of the merging threshold and the converging threshold of Algorithm 2, we list in Table S.4 the performance of Algorithm 2 across different levels of and . As shown, the computational time is influenced more by the choice of , with smaller leading to substantially longer running time. When is not too small (e.g., or ), the time cost increases as decreases. Most configurations result in support points, while a as small as causes unnecessary support points with a small minimum distance (), which implies that is too small. The relative efficiency remains high across all settings. Overall, in this case we recommend and to balance the relative efficiency and computational cost.
| Time cost (in seconds) | Minimum distance between points | |||||||
| 0.1 | 167.20 | 44.76 | 121.58 | 79.02 | 0.134 | 7.508 | 7.452 | 7.472 |
| 0.2 | 12.61 | 18.81 | 14.78 | 15.95 | 7.493 | 7.492 | 7.440 | 7.440 |
| 0.3 | 10.16 | 12.66 | 12.03 | 13.56 | 7.492 | 7.492 | 7.492 | 7.492 |
| 0.4 | 9.90 | 12.67 | 12.23 | 13.41 | 7.492 | 7.492 | 7.492 | 7.492 |
| Number of support points | Relative efficiency w.r.t. (%) | |||||||
| 0.1 | 4 | 2 | 2 | 2 | 99.9690 | 99.9993 | 99.9980 | 99.9997 |
| 0.2 | 2 | 2 | 2 | 2 | 99.9997 | 99.9997 | 99.9963 | 99.9963 |
| 0.3 | 2 | 2 | 2 | 2 | 99.9997 | 99.9997 | 99.9997 | 99.9997 |
| 0.4 | 2 | 2 | 2 | 2 | 99.9997 | 99.9997 | 99.9997 | 99.9997 |
| Design space | A-optimal design by Algorithm 2 | Relative efficiency w.r.t. |
|---|---|---|
| 0.9967 | ||
| 0.9520 | ||
| 0.7769 | ||
| 0.2495 |
In Yang (2008), is guaranteed to be A-optimal if the design region is unconstrained, i.e., the whole real line. In practice, however, a feasible design region is often bounded due to various physical, experimental, or operational limitations. As such, the levels of continuous or discrete factors are typically confined to predefined bounded regions. For those scenarios, we can still use our Algorithm 2 to find the corresponding A-optimal designs. For illustration purpose, we let the design space in this case change from to gradually. As shown in Table S.5, by using Algorithm 2 with and , the support points move toward the boundary of the regions, and the relative efficiency with respect to decreases as the design space becomes more and more restricted.
Example 9.
Gamma model with two factors Gaffke et al. (2019) considered a Gamma regression model with two continuous factors and , such that and (see model (1)). Assuming , , they theoretically justified that the (locally) A-optimal design on is supported only on the four vertices of , namely or for , respectively. Then they used the multiplicative algorithm (see also Example 3) to obtain an A-optimal allocation for the four vertices, denoted by .
| Relative efficiency w.r.t. | |||||
|---|---|---|---|---|---|
| -0.45 | 0.1136 | 0.3984 | 0.3983 | 0.0897 | 100.0000% |
| 0 | 0.3560 | 0.2257 | 0.2250 | 0.1933 | 100.0100% |
| 1 | 0.2690 | 0.3003 | 0.3001 | 0.1307 | 100.0006% |
| 2 | 0.2208 | 0.3805 | 0.3806 | 0.0182 | 100.0000% |
To show how our algorithms work for this experimental design problem, we first apply Algorithm 2 to the continuous design problem with . Remarkably, for each listed in Table S.6 (see also Table 1 in Gaffke et al. (2019)), our ForLion algorithm ends with the same four vertices as the support points, along with the weights provided in Table S.6. Compared with listed in Table 1 of Gaffke et al. (2019), our designs can be slightly better according to the relative efficiencies.