Evaluating Language Models for Efficient Code Generation
University of Illinois Urbana-Champaign
Abstract
We introduce Differential Performance Evaluation (DPE), a framework designed to reliably evaluate Large Language Models (LLMs) for efficient code generation. Traditional coding benchmarks often fail to provide reliable insights into code efficiency, due to their reliance on simplistic test inputs and the absence of effective compound metrics. DPE addresses these issues by focusing on efficiency-demanding programming tasks and establishing an insightful compound metric for performance evaluation. DPE operates in two phases: To curate efficiency datasets, it selects efficiency-demanding tasks from existing coding benchmarks and generates computationally expensive inputs to stress the efficiency of LLM solutions. To assess the code efficiency, DPE profiles the new solution and compares it globally against a set of reference solutions that exhibit distinct efficiency levels, where the matched level defines its efficiency score. As a proof of concept, we use DPE to create EvalPerf, a benchmark with 121 performance-challenging coding tasks.
Our comprehensive evaluation draws interesting findings on the efficiency impact of model sizes, instruction tuning, and prompting. For example, while the scaling law fails to account for code efficiency, general instruction tuning benefits both code correctness and efficiency. We also evaluate the evaluation by examining the effectiveness of DPE, showing that EvalPerf is reliable and convenient to use even across platforms.
1 Introduction

With the increasing usage (GitHub, 2023; Amazon Web Services, 2023) of Large Language Models (LLMs) for code generation, comprehensively evaluating these LLMs is crucial for finding the next advancements. As such, the functional correctness in code generation (Chen et al., 2021; Austin et al., 2021) has been well-studied, where given a coding instruction in natural language, LLMs produce solutions whose correctness is assessed through test execution.
While code correctness ensures the program performs its intended behaviors accurately, code efficiency is equally crucial for building high-quality software. With the massive deployment of coding copilots, these assistants can help developers write low-latency, scalable, and cost-effective code by suggesting efficient algorithms, data structures, and coding patterns. More importantly, code execution can be a bottleneck for running the emerging Program-aided Language Models (Gao et al., 2023) (e.g., GPT-4), motivating the generation of efficient code toward a smooth user experience.
Reasonably evaluating the code efficiency is important yet challenging. A naïve evaluation approach may simply record the execution runtime of validated solutions from existing benchmarks. However, such a strategy fails to provide reliable performance insights for two reasons:
Limitation #1: Light computation. Existing coding tasks commonly involve minimal computation, caused by small test inputs and simplistic control flow (e.g., adding two numbers). However, it is not evaluation-friendly regarding code efficiency because lighter computation can incur larger result flakiness at orders of magnitude (Section A.1) due to its sensitivity to system noises. Meanwhile, code efficiency becomes less important at a tiny scale since all complexities are “equal” when is small. For example, a recursive implementation can be no slower than an efficient iterative solution when computing the first few Fibonacci numbers. Consequently, it is more meaningful to study code efficiency over large-scale data.
Limitation #2: Inadequate metric. Runtime speedup has been the de facto compound metric in the literature (Mendis et al., 2019; Zheng et al., 2020; Baghdadi et al., 2021) of efficiency optimization. While speedup is straightforward when studying a single optimization subject, averaging speedups over multiple tasks is confusing when interpreting the overall code efficiency of an LLM. For example, assuming model is slower than by on 99 tasks while outperforming on the only task by , the average speedup says code from is generally faster than that of by , which may not align with general user perception. While we defer detailed discussions in Section A.2, the misperception comes from the huge scale variation of speedups across different tasks, calling for a more insightful compound metric for code efficiency.
To this end, we propose Differential Performance Evaluation (DPE), a general framework to curate performance-exercising programming challenges and perform effective code efficiency evaluation. From the data and metric perspective, DPE argues that effective performance benchmarking requires: (i) efficiency-challenging programming tasks to differentiate code solutions, and (ii) an unsightly metric to tell how far an LLM is to generate empirically optimal code. At dataset curation time, DPE takes a set of coding tasks as input and transforms them into tasks worth practicing for efficiency. Specifically, DPE generates performance-exercising test inputs for each task by Synthesizing a Synthesizer (SaS). SaS prompts an LLM with Chain-of-Thought (Wei et al., 2022) (CoT) few-shot learning to produce a scale-controllable test input sampler. Next, we tune the sampler to generate challenging yet computable inputs via exponential input sampling. Furthermore, we design filtering strategies to pick reliable tasks for performance evaluation. For each performance-exercising task, DPE samples a rich set of valid solutions and clusters them by performance characteristics. At evaluation time, DPE profiles a given new solution along with reference solutions and the ranking of the matched performance cluster determines its score. Below summarizes the contributions of this paper:
-
1.
Dimension: While the correctness evaluation of code generation has been well studied, we deliver a new and important aspect to the community by studying the data curation and assessment for the efficiency evaluation of LLM-generated code.
-
2.
Technique: We propose Differential Performance Evaluation (DPE) for effective efficiency evaluation. DPE curates performance-demanding coding tasks by sampling synthesized test input generators and using filters to ensure evaluator quality. A solution’s efficiency is then globally assessed by referencing representative solutions.
-
3.
Benchmark: Using DPE we create EvalPerf, including 121 performance-exercising programming tasks and test inputs. We also fully open-source and maintain the data curation pipeline and evaluator at github.com/evalplus/evalplus as part of EvalPlus.
-
4.
Study: We extensively study the code efficiency of popular LLMs and draw interesting findings regarding the efficiency impact of model sizes, instruction tuning, and promptings. We also show that DPE can create inputs that are more performance-exercising than prior art by and EvalPerf can lead to consistent performance evaluation even across various platforms.
2 Differential Performance Evaluation
Figure 1 illustrates the overview of Differential Performance Evaluation (DPE), including (i) how to create a performance evaluation dataset to differentiate code performance (Sections 2.1, 2.3, 2.4 and 2.2); and (ii) how to evaluate new code solutions using the created dataset (Section 2.5).
At the high level, the input to the dataset creation phase is a set of programming tasks, e.g., from HumanEval (Chen et al., 2021) and MBPP (Austin et al., 2021). As output, DPE produces a subset of performance-exercising tasks equipped with challenging test inputs. Specifically, we follow the steps below to transform and select performance-exercising tasks:
-
1.
Valid solution curation: Given a programming task, we collect a rich set of correct solutions by sampling various LLMs and test execution.
-
2.
Performance-exercising input generation: We maximize the performance difficulty of a coding task by synthesizing a test generator aiming to produce costly test inputs.
-
3.
Performance-exercising task selection: We profile validated solutions using performance-exercising inputs and filter out tasks using various quality criteria.
-
4.
Performance clustering: Based on the profiled performance, solutions for each task are partitioned into several clusters for performance reference at evaluation time.
During evaluation, if passing the correctness tests, the new solutions are profiled to compare against the reference solutions. Specifically, from slow to fast, the cumulative ratio of the cluster that includes the matched reference solution is the efficiency score of the evaluated solution. For example, in Figure 1 the new solution (the green box) matches the efficiency of the representative solution of the “100%” cluster, leading to a score of 100 (%) for this task.
2.1 Valid Solution Curation
To start with, DPE takes a set of programming tasks as inputs and assumes such tasks are equipped with task descriptions (i.e., base prompts for the LLMs) and correctness tests. For example, these tasks can come from existing coding benchmarks such as HumanEval and MBPP. Next, we sample plausible solutions from diverse code LLMs and validate these solutions via test execution. Because correctness is the prerequisite for performance, we comprehensively validate plausible solutions using the rigorous tests from EvalPlus (Liu et al., 2023a).
2.2 Synthesizing a Synthesizer: Performance-Exercising Input Generation
While performance-exercising inputs are crucial, automating their creation can be challenging, as it is not always as simple as producing large integers. This is because these programming problems can define “large” inputs differently and require various structural and semantic constraints. For instance, when testing is_prime(n), a randomly large n often leads to a quick path of False since most numbers are divisible by smaller numbers (e.g., half of the integers are divisible by two). Instead, the desirable test inputs are large prime numbers.
To this end, we propose Synthesizing a Synthesizer (SaS) to automatically produce performance-exercising inputs of different programming tasks by prompting powerful code LLMs to generate test generators. Furthermore, the generator function is controllable through a scale factor, allowing for tuning the complexity of generated test inputs.
Generating input generator. SaS applies few-shot prompting with Chain of Thoughts (CoT) for input generator synthesis, exemplified in Section 4.1. Specifically, the end goal of prompting is to obtain the generator function (i.e., perf_input_gen) illustrated in the “Input Generator” block (at the bottom). The generator function takes a scale factor as input and outputs performance-exercising test inputs according to the scale. The generator is expected to respect monotonicity over the scale factor, i.e., a larger scale factor should lead the generator to produce a more challenging input. The context for generating the generator includes three parts: (i) an instruction clarifying the goal of code generation; (ii) a ground-truth solution helping the LLM understand the overall semantic and complexity; and (iii) a few question-answer pairs to activate CoT reasoning of the task complexity. By initializing the prompt using such few-shot samples, we further load the “instruction” and “ground-truth solution” block for a programming task under test synthesis and let a generative LLM follow the few-shot demonstration and produce a test input sampler.
Exponential input sampling. For each coding task, we sample performance-exercising inputs by running the generator function (i.e., perf_input_gen) using different scale factors (i.e., scale). Specifically, we start by setting the scale factor to 1 and sample test inputs by doubling the factor round by round. The sampled test inputs are evaluated through execution, and we stop generation when an input hits a time or memory limit on any validated solution (Section 2.1). By expanding the scale factor exponentially, we obtain the most performance-exercising input within our computational limits. Meanwhile, we use test execution to drop ill-formed generators and retry another sample of input generators at failure.
Insight. Prior work (Liu et al., 2023a; Li et al., 2022) also prompts LLMs to generate test inputs directly. However, such an approach is inapplicable for generating challenging inputs whose text representation can be huge, blowing up the context limits of LLMs. Meanwhile, it is also hard for LLMs to strictly follow the structural requirements and diversify the inputs during long-context generation. Hence, we highlight the indirect generation of complex test inputs via input generator synthesis. Recently, Zhang et al. (2023) proposed ALGO which uses ChatGPT Code Interpreter to create input generators for exhaustive validation. Different than ALGO, SaS aims for performance-exercising inputs via few-shot CoT and scale tuning, which does not rely on the powerful ChatGPT Code Interpreter.
2.3 Performance-Exercising Task Selection
Even with the most challenging test input, a programming task might not meet the requirement of performance diversity and runtime variation (e.g., add two numbers). Consequently, we propose filtering strategies to drop undesired programming tasks. For every programming task, we profile all valid solutions curated in Section 2.1 multiple times. Therefore, for solution we profile its execution for times and obtain a list of execution time111For clarity, in this section, we use “execution time” or “runtime” to refer to the execution cost, which in practice can be generalized to other metrics such as the number of instructions. . As such, a selected programming task must meet the following criteria:
-
1.
Sufficient computation: A performance-exercising task must experience a reasonably long execution. As such, we require , meaning that the execution of any solution must run longer than .
-
2.
Low performance variation: We require , where , i.e., coefficient of variation, and is the 99% largest variation.
-
3.
Performance diversity: We apply a clustering method (to be discussed in Section 2.4) to adaptively cluster the solutions into several groups at different levels of efficiency. Therefore, we require the number of output clusters to be greater than where .
2.4 Adaptive Performance Clustering
Given a performance-exercising task, we cluster its reference solutions by their performance characteristics and use them to differentiate new solutions at evaluation time.
Figure 3 elucidates our adaptive clustering algorithm. Commencing from Line 4, the clustering algorithm takes a list of mean execution time (i.e., 1-dimension) as input and dynamically partitions them into clusters based on their relative scale. Subsequently, we sort the execution time from slow to fast in Line 5. Denoting the sorted time1d as , in Line 6, we compute the relative difference in percentage, i.e., . Following this, in Line 7, the algorithm employs an adaptive thresholding mechanism to determine the segmentation points over the sorted . Considering Figure 6, which indicates that smaller executions often exhibit larger variations, Line 7 calls the adaptive thresholding function in Line 1 which produces larger thresholds for smaller runtime. Specifically, to build a segmentation point at (left inclusive), the algorithm mandates that , where and are hyper-parameters of the threshold minima and scale, respectively. Therefore, in Line 8, the algorithm returns the runtime clusters for each task by splitting them over the provided segmentation points.

2.5 Efficiency Scoring by References
In the final stage of dataset curation, we retain the slowest solution per cluster along with its cumulative percentage in each task. These solutions serve as benchmarks for efficiency scoring. During evaluation, both the reference solutions and the new solution are profiled in the same environment for performance assessment. Notably, we opt for a single representative solution per cluster as profiling all solutions during evaluation would be extremely time-consuming.
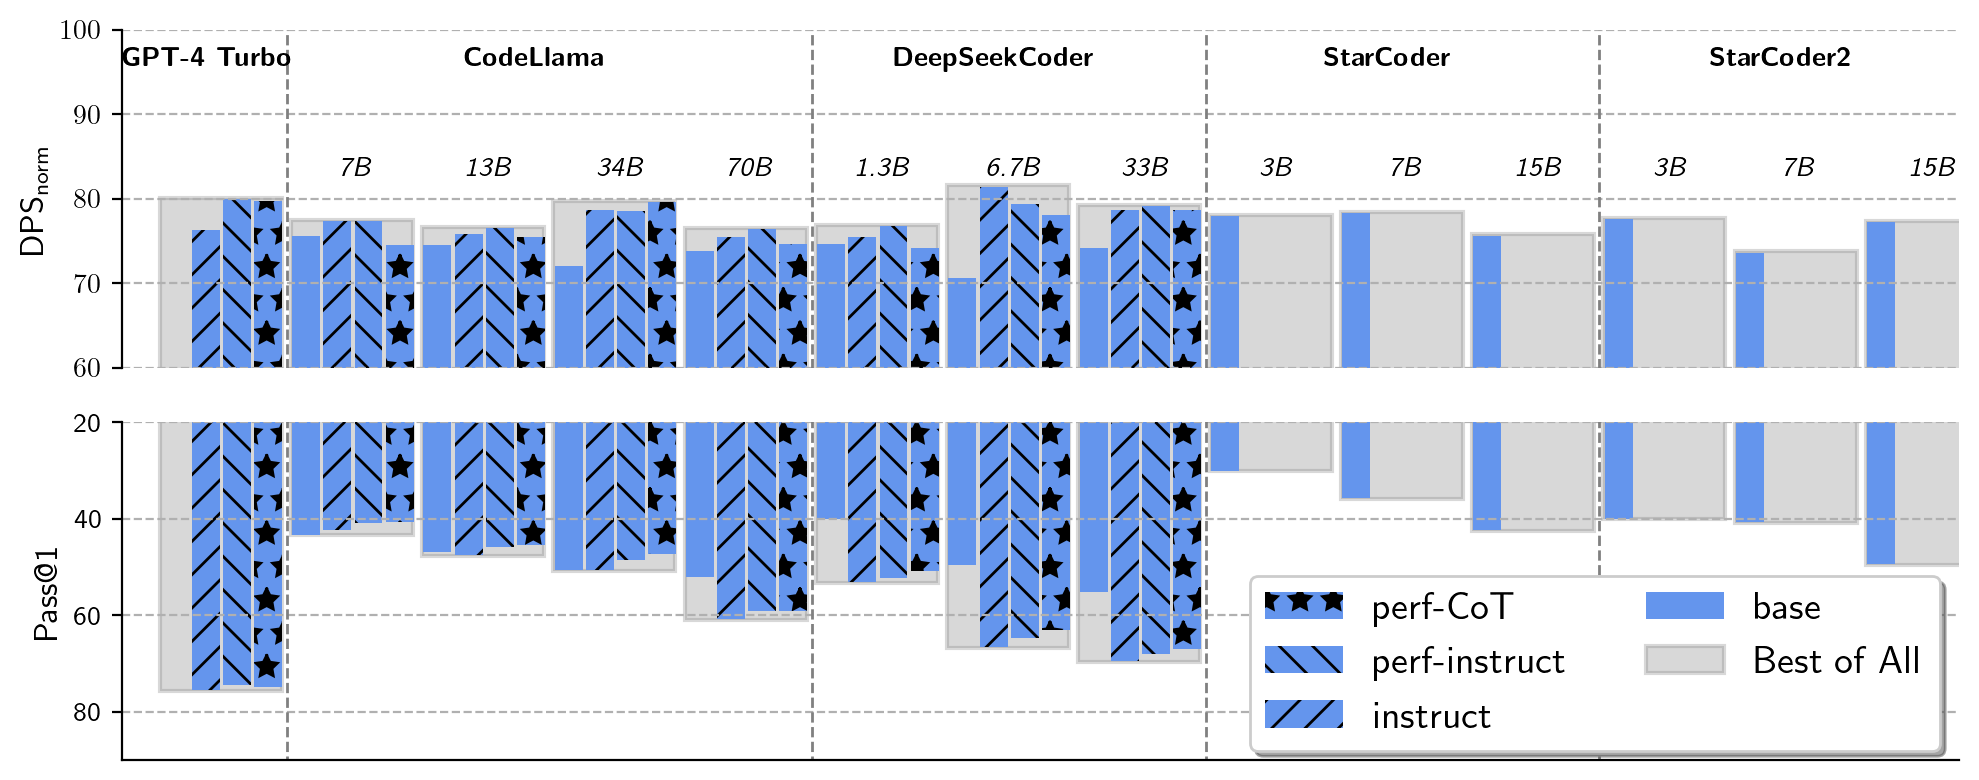
Differential Performance Score. For each task, we denote the reference solutions from the clusters as and their corresponding cumulative ratios ( and ). Meanwhile, we profile each reference point multiple times and obtain its mean runtime . Given a new and validated solution to evaluate, we use the same profiling procedure and obtain a mean runtime of . As such, we compute a Differential Performance Score (DPS) for as , i.e., the cumulative ratio of the reference that is immediately slower than . In addition, we also provide a normalized version of DPS by ablating the volume of solutions at each level, i.e., . The above discusses how to compute the performance score for one coding task, to compute the dataset-wise performance score we simply average over all passed tasks.
Exemplification. For example, a DPS of 80% implies that overall the LLM generates code whose efficiency can match or improve 80% of all LLM-generated solutions. Similarly, a DPSnorm of 80% indicates that the code efficiency of the LLM can overall match or improve 80% of performance clusters, by ignoring the size of each cluster.
Lastly, DPS is not free as it requires to collect reference solutions of diverse efficiency levels.
3 EvalPerf: A Benchmark for Code Efficiency Evaluation
Based on Differential Performance Evaluation, we build EvalPerf, a new dataset with 121 performance-exercising programming tasks, for effective evaluation of code efficiency.
We put HumanEval+ (164 tasks) and MBPP+ (399 tasks) together as the initial tasks to DPE, given their more rigorous tests (Liu et al., 2023a) to safeguard correctness. To echo Section 2.1, we sample and test code solutions from 21 open LLMs that achieve over a pass@ score of 50 on the EvalPlus leaderboard (Xie et al., 2024), where we sample 50 solutions for each model at a temperature of 0.8 for diversified generation. Next, we generate test input samplers (Section 2.2) using two few-shot samples and we start the generation at the “Chain of Thoughts” block in Section 4.1 right after providing the ground-truth solution. Specifically, we use AWQ-quantized (Lin et al., 2024) DeepSeekCoder-instruct-33B (DeepSeek AI, 2023) as the generative LLM to produce 16 input generator samples for each task at a temperature of 0.8. We then sample concrete test inputs from these generators, starting with a scale factor of and increasing it exponentially until hitting the 20-second time wall or the 16GB memory wall. Of course, some generators could be broken and we filter them out via the running itself and its generated tests.
Task selection and clustering require profiling of these solutions. Specifically, we use the number of executed assembly instructions as the profile metric. This profile can be easily and natively obtained by querying the Performance Monitoring Units (PMU) of modern CPUs through system calls, such as perf_event (Weaver, 2013a) in Linux, which is pervasively available on most platforms. Compared to physical runtime, the #instruction is much more stable, resulting in negligible variation. Compared to software profilers such as architecture simulators, hardware counters provide low overhead (Wikipedia, 2024) and are easy to use through simple system calls. As such, we profile the #instructions for each solution over the performance-exercising input and filter the tasks using the criteria in Section 2.3. Specifically, we filter out tasks whose solutions can finish in instructions which is the scale of instructions for printing “hello world”. We omit the variation criterion as we use the hardware performance counters for cost measurement. For clustering (Section 2.4), we set the base threshold (i.e., ) as 20% and the weight (i.e., ) as 10k instructions for the adaptive threshold function in Figure 3, and for diversity require each task to have at least performance clusters. As such, we build EvalPerf, a dataset with 121 performance-exercising coding tasks, equipped with computationally challenging inputs and solutions for performance reference.
Lastly, our future efforts will continuously extend EvalPerf using more coding tasks.
4 Evaluation
In Section 4.1 we study the code efficiency of recent code LLMs on EvalPerf and in Section 4.2 we evaluate the effectiveness of Differential Performance Evaluation.
4.1 Evaluating Code Efficiency
Setup. Following recent work (Lozhkov et al., 2024), we evaluate the performance as well as the correctness of programs synthesized by a series of open model families, including CodeLlama (Rozière et al., 2023), DeepSeekCoder (DeepSeek AI, 2023), StarCoder (Li et al., 2023), and StarCoder2 (Lozhkov et al., 2024). For proprietary models, we evaluate GPT-4 Turbo (OpenAI, 2023) (i.e., gpt-4-0125-preview) which is to date the leading model on the EvalPlus leaderboard (Xie et al., 2024). Specifically, we use up to four variants for each model type:
-
1.
base: the base pre-trained model without instruction tuning.
-
2.
instruct: the instruction-tuned model using its specialized instruction format.
-
3.
perf-instruct: the instruction-tuned model using a prompt asking the model to “solve the programming task efficiently by writing a fast implementation”.
-
4.
perf-CoT: the instruction-tuned model with a zero-shot chain-of-thought prompt (Kojima et al., 2022) by adding “Think step by step” before the perf-instruct prompt.
By default, we generate 50 samples at a temperature of 0.2 for each programming task following Lozhkov et al. (2024). Yet, for cost mitigation, we limit it to 10 samples for GPT-4 Turbo. This approach is justified by the GPT-4 Turbo’s higher accuracy in generating correct code. For correctness evaluation, we compute a comprehensive pass@ on the sum of 164 HumanEval+ tasks and 399 MBPP+ tasks. For code efficiency analysis, for each task, we compute the average DPS and DPSnorm values for the first 10 correct solutions in the 50 samples and report the score averaged across all tasks. Notably, we compare models in a pairwise fashion and compute the efficiency scores over the common set of passing solutions to eliminate correctness inconsistency.

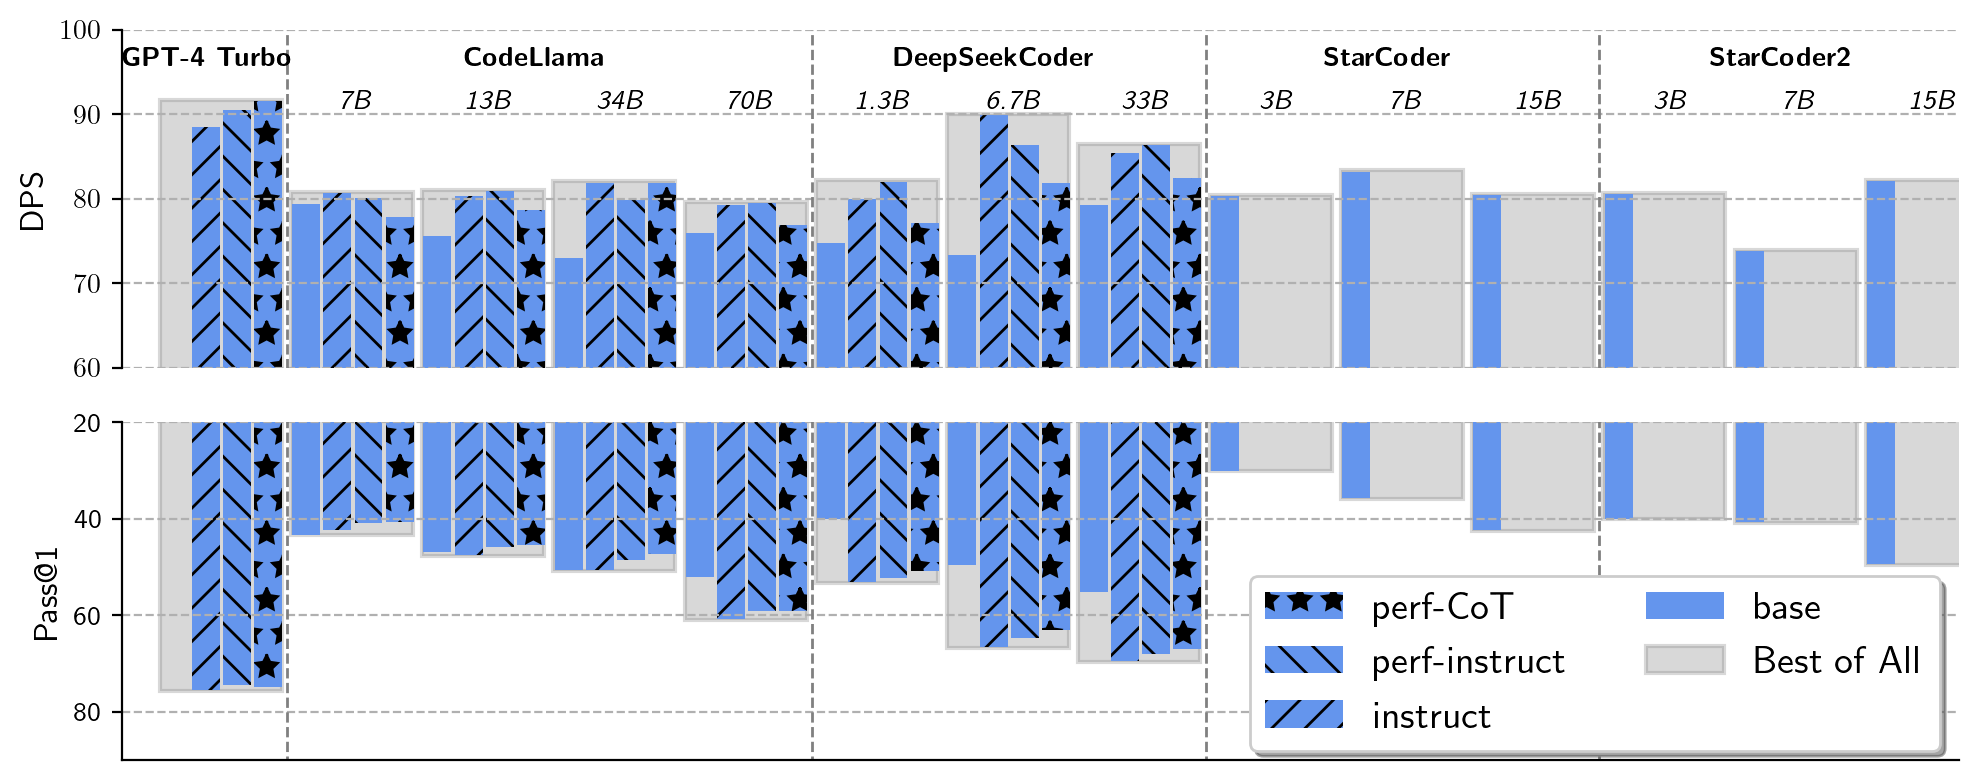
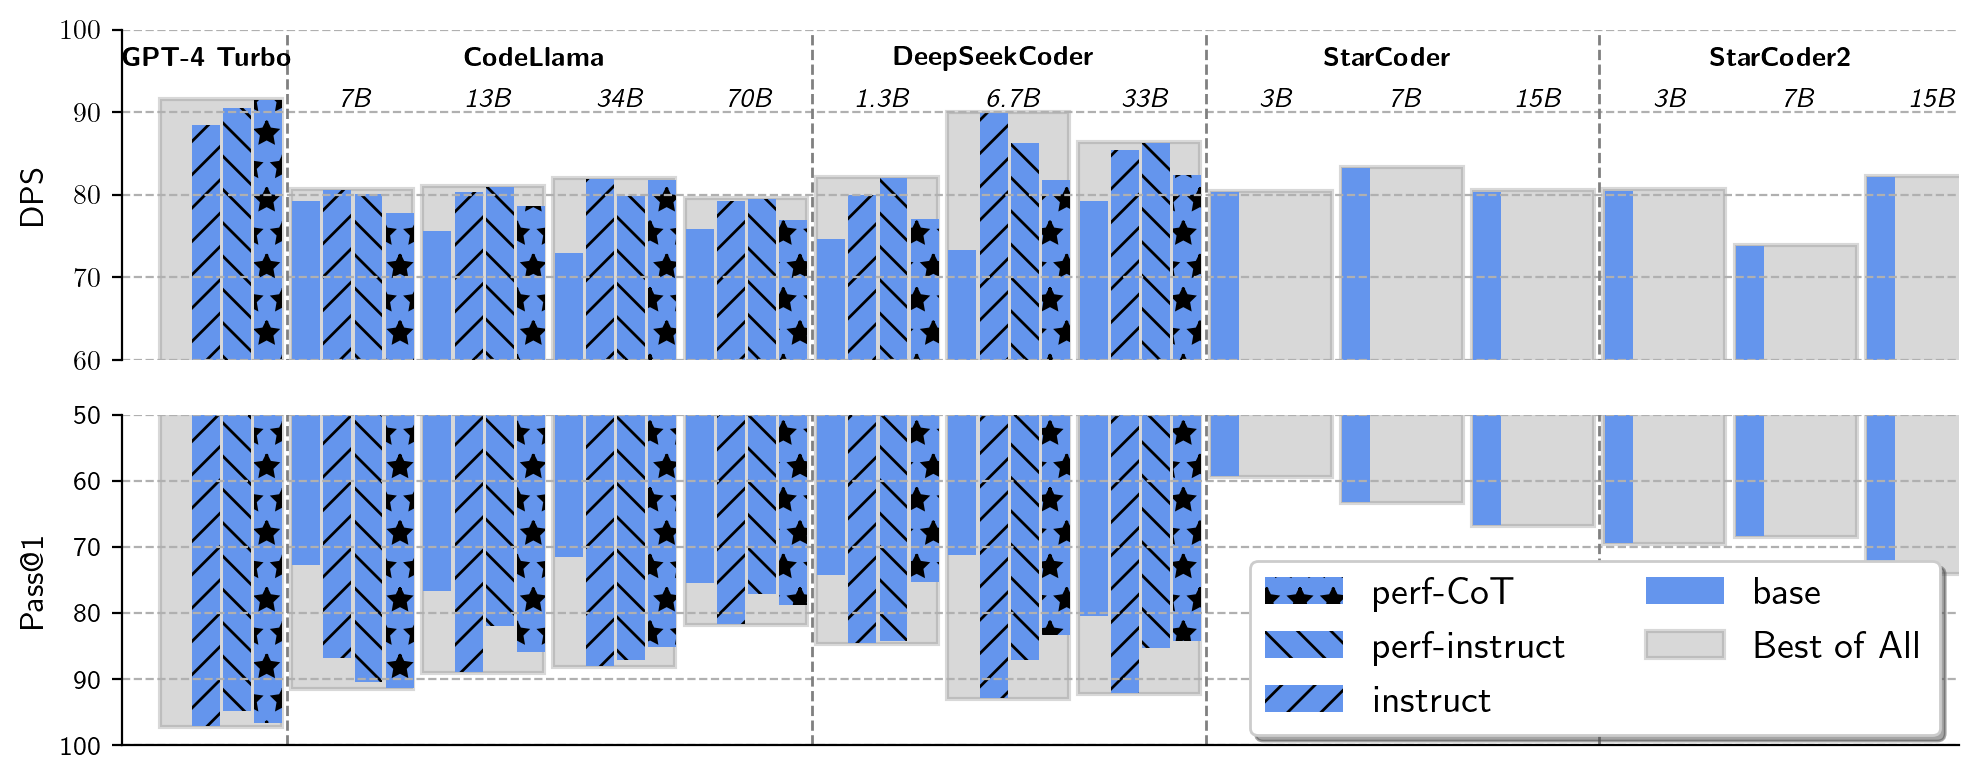
Impact of instruction tuning. Code instruction tuning finetunes the base model over high-quality code which can significantly improve the correctness in code generation (Wei et al., 2024; DeepSeek AI, 2023). Surprisingly, as is suggested by Figure 4, correct code generated by instruction-tuned models also tends to be more efficient than that of the base model (except for StarCoder2-15B). For example, instruction-tuned DeepSeekCoder-6.7B improves the base model by 19% regarding DPS. This interesting finding implies that general instruction tuning methods can improve multiple code quality aspects beyond correctness, even if the existing instruction tuning methods were not designed to optimize code efficiency.
Impact of prompting. For instruction-following models, besides the general chat template (i.e., instruct), we also use two performance-encouraging zero-shot prompting methods (i.e., perf-instruct and perf-CoT). Overall the performance-encouraging prompts neither consistently nor noticeably improve the code efficiency compared to using the basic prompting method. This shows that existing models are still weak in following such instructions, calling for future work to improve the instruction-following abilities of code LLMs. In the Appendix, Table 3 also shows that performance-encouraging prompts commonly lead to correctness degradation in code generation.
![[Uncaptioned image]](2408.06450v1/x4.png) Figure 2: Exemplifying Synthesizing a Synthesizer.
Figure 2: Exemplifying Synthesizing a Synthesizer.
Impact of model sizes. It has been a general conclusion that larger models within a model family can often generate more accurate code. Section 4.2 explores how parameter sizes within the same model family impact the overall code efficiency. Within the 12 pairs in Section 4.2, there are seven cases where a larger model in the family outperforms the smaller one regarding code efficiency, e.g., DeepSeekCoder-6.7B-Instruct improves the DPS of the 1.3B version by 14% and there is an 8.7% improvement from StarCoder2 7B to 15B. However, performance degradation with % loss also happens 4 times, e.g., in the worst case, there is a 6% degradation between the 3B and 7B versions of StarCoder2 base models. This underscores a new finding – the scaling law (Kaplan et al., 2020) persists for code correctness but does not seem explicit for code efficiency, calling for future research in modeling and data curation to improve efficiency in code generation models.
Lastly, we defer more evaluation details in Section A.3.
4.2 Evaluating the Evaluation
SaS vs. EvalPlus. EvalPlus (Liu et al., 2023a) generates an abundance of test cases, some of which could be already performance-exercising. Therefore, we use EvalPlus as a baseline to evaluate the performance difficulty of test inputs generated by SaS. Specifically, we use the filtering criteria in Section 2.3 as the evaluator and compare the number of retained tasks using the most challenging inputs of both methods, i.e., more is better.
![[Uncaptioned image]](2408.06450v1/x5.png) Figure 5: Pairwise DPS comparison with models of different parameter sizes.
Figure 5: Pairwise DPS comparison with models of different parameter sizes.
LABEL:tab:evalsas shows the results. We start with a total of 563 tasks from HumanEval+ and MBPP+. Of these, for 342 tasks, we are able to obtain at least 10 validated solutions (Section 3). Using the criteria of “enough computation” which asks for test execution of over 10k instructions, the most performance-challenging EvalPlus inputs pass 204 out of 342 tasks (i.e., 60%), whereas SaS improves it by for enabling 271 tasks (i.e., 79%) with inputs that exhibit larger computation. Meanwhile, since our cost measurement is based on hardware counters (Section 3), the variation-related criterion does not apply here. The clustering criterion allows tasks with at least 4 clusters of different performance characteristics. By applying this, EvalPlus-enabled tasks further reduce to 25 out of 204 (i.e., 88% drop), whereas SaS stands out by passing 121 tasks, resulting in a relative improvement of .
Cross-platform variation. A usable and reliable benchmark must easily run on various platforms and draw consistent conclusions. As such, we study the result consistency of EvalPerf over different test beds. Section 4.2 lists the DPS and DPSnorm of three instruction-tuned models over 4 test-beds, covering a wide range of configurations covering desktop-, workstation-, and server-scenarios. With the emergence of heterogeneous CPUs, we also include a desktop using a heterogeneous architecture, i.e., i9-12900K with 8 performance cores and 8 efficiency cores. All of these test beds are equipped with hardware counters (which are widely available), allowing for efficient profiling of #instructions. Specifically, Section 4.2 demonstrates that EvalPerf overall leads to very consistent conclusions, with a maximum coefficient of variation at 0.4%. Meanwhile, the evaluation takes approximately no more than 15 minutes for most evaluated models (i.e., up to 10 profiled solutions for each of 121 tasks). This highlights the reliability and usability of the EvalPerf dataset as well as the DPE methodology. The low cross-platform variation comes from two major design choices: (i) Differential evaluation: in DPE the score is determined by the relative position compared against reference solutions which differentiate each other significantly; and (ii) Hardware performance counters: using hardware counters we can efficiently obtain reliable #instructions of profiled execution despite system noises.
| Desktop i7-10700K 8 Cores 64GB RAM | Desktop | |||||
| i9-12900K | ||||||
| 8P & 8E Cores | ||||||
| 64GB RAM | Workstation TR Pro 5975WX 32 Cores 256GB RAM | Server Xeon 6442Y 48 Cores 512GB RAM | CV | |||
| (%) | ||||||
| CodeLlama-70B | ||||||
| instruct | DPS | 79.2 | 79.4 | 79.4 | 78.8 | 0.3 |
| DPSnorm | 75.4 | 75.9 | 75.2 | 75.1 | 0.4 | |
| DeepSeekCoder-33B | ||||||
| instruct | DPS | 85.4 | 85.6 | 85.5 | 85.4 | 0.1 |
| DPSnorm | 78.6 | 78.5 | 78.6 | 78.4 | 0.1 | |
| GPT-4 instruct | DPS | 90.5 | 90.0 | 90.7 | 89.9 | 0.4 |
| DPSnorm | 79.9 | 79.8 | 79.9 | 79.9 | 0.1 |
5 Related Work
The correctness of general code generation is one of the most studied evaluation aspects. APPS (Hendrycks et al., 2021) and MBPP (Austin et al., 2021) curate Python problems with tests from coding websites. Meanwhile, HumanEval (Chen et al., 2021) includes 164 Python programming tasks manually designed from scratch. Yet, Liu et al. (2023a) shows that existing benchmarks have limited tests and proposes to extend the test coverage using automated test generation, creating HumanEval+ and MBPP+. Meanwhile, these Python tasks are translated to other languages for multilingual evaluation (Cassano et al., 2022; Athiwaratkun et al., 2022; Zheng et al., 2023). Furthermore, benchmarks also cover important domains such as data science (Lai et al., 2022; Yin et al., 2022; Zan et al., 2022), repository-level generation (Ding et al., 2023; Liu et al., 2023b), software development (Jimenez et al., 2023), security (Pearce et al., 2022), open-domain generation (Wang et al., 2023; Zhuo et al., 2024), and code understanding (Gu et al., 2024; Muennighoff et al., 2023; Liu et al., 2024). It is also important to avoid contamination in evaluation (Jain et al., 2024).
In terms of code efficiency, recent work PIE (Shypula et al., 2023) creates a benchmark to evaluate the program optimization capability of LLMs given base C++ programs. Furthermore, PIE (Shypula et al., 2023) employs CPU simulators to profile code execution to address the reproducibility concern. As a general evaluation mechanism, DPE (ours) as a meta technique can be applied to evaluating code generation and optimization, and also use CPU simulators for measurements. More concretely, our EvalPerf dataset based on DPE focuses on evaluating the code efficiency of the setting of direct code generation, which is more realistic in daily software development where oftentimes a base reference program is not available. Meanwhile, for measurement of computational cost, EvalPerf uses hardware performance counters that are low-overhead, reliable, and easy to use, explained in Section A.2.
At the time when the paper is accepted, there have been emerging sibling benchmarks for evaluating efficiency in code generation (Huang et al., 2024; Qiu et al., 2024; Waghjale et al., 2024). While these benchmarks consider additional source tasks (e.g., those from LeetCode) and efficiency aspects (e.g., memory usage), they still suffer from limitations including test computation insufficiency and relying on variation-sensitive compound metrics like average speedups. DPE as a meta-evaluation framework complements these new works and addresses these limitations by automatically creating performance-exercising test inputs and a stable compound metric mechanism for code efficiency. In addition, we suggest ablating impacts of the correctness dimension in efficiency evaluation, by comparing different models over a common set of passing tasks rather than the unaligned whole test suite (Huang et al., 2024).
6 Conclusion
This paper presents Differential Performance Evaluation (DPE), a novel framework to effectively assess the efficiency of code generated by Large Language Models (LLMs). By improving the computational complexity and metric mechanism of existing program synthesis benchmarks, DPE provides a general and robust approach to reasonably evaluate code efficiency. DPE includes two phases: (i) making a performance-exercising benchmark; and (ii) evaluating the global performance of new solutions. In the data curation phase, DPE transforms tasks into challenges that rigorously test code efficiency. In the evaluation phase, DPE profiles new solutions against reference solutions with representative performance characteristics. DPE is general, and based on it we create EvalPerf, a benchmark with 121 performance-challenging coding tasks.
Our evaluation based on EvalPerf reveals new insights into the impact of instruction tuning, promptings, and model sizes on code efficiency. Meanwhile, the evaluation of DPE itself showcases its effectiveness, reliability, and simplicity in performance benchmarking, even across various platforms.
Acknowledgment
This work was partially supported by NSF grant CCF-2131943 and Kwai Inc, as well as API credits from the OpenAI Researcher Access Program.
References
- Amazon Web Services (2023) Amazon Web Services. AI Code Generator - Amazon CodeWhisperer - AWS. https://aws.amazon.com/codewhisperer/, 2023.
- Athiwaratkun et al. (2022) Ben Athiwaratkun, Sanjay Krishna Gouda, Zijian Wang, Xiaopeng Li, Yuchen Tian, Ming Tan, Wasi Uddin Ahmad, Shiqi Wang, Qing Sun, Mingyue Shang, et al. Multi-lingual evaluation of code generation models. In The Eleventh International Conference on Learning Representations, 2022.
- Austin et al. (2021) Jacob Austin, Augustus Odena, Maxwell I. Nye, Maarten Bosma, Henryk Michalewski, David Dohan, Ellen Jiang, Carrie J. Cai, Michael Terry, Quoc V. Le, and Charles Sutton. Program synthesis with large language models. CoRR, abs/2108.07732, 2021. URL https://arxiv.org/abs/2108.07732.
- Baghdadi et al. (2021) Riyadh Baghdadi, Massinissa Merouani, Mohamed-Hicham Leghettas, Kamel Abdous, Taha Arbaoui, Karima Benatchba, et al. A deep learning based cost model for automatic code optimization. Proceedings of Machine Learning and Systems, 3:181–193, 2021.
- Binkert et al. (2011) Nathan Binkert, Bradford Beckmann, Gabriel Black, Steven K Reinhardt, Ali Saidi, Arkaprava Basu, Joel Hestness, Derek R Hower, Tushar Krishna, Somayeh Sardashti, et al. The gem5 simulator. ACM SIGARCH computer architecture news, 39(2):1–7, 2011.
- Cassano et al. (2022) Federico Cassano, John Gouwar, Daniel Nguyen, Sydney Nguyen, Luna Phipps-Costin, Donald Pinckney, Ming-Ho Yee, Yangtian Zi, Carolyn Jane Anderson, Molly Q Feldman, Arjun Guha, Michael Greenberg, and Abhinav Jangda. Multipl-e: A scalable and extensible approach to benchmarking neural code generation, 2022.
- Chen et al. (2021) Mark Chen, Jerry Tworek, Heewoo Jun, Qiming Yuan, Henrique Ponde de Oliveira Pinto, Jared Kaplan, Harri Edwards, Yuri Burda, Nicholas Joseph, Greg Brockman, Alex Ray, Raul Puri, Gretchen Krueger, Michael Petrov, Heidy Khlaaf, Girish Sastry, Pamela Mishkin, Brooke Chan, Scott Gray, Nick Ryder, Mikhail Pavlov, Alethea Power, Lukasz Kaiser, Mohammad Bavarian, Clemens Winter, Philippe Tillet, Felipe Petroski Such, Dave Cummings, Matthias Plappert, Fotios Chantzis, Elizabeth Barnes, Ariel Herbert-Voss, William Hebgen Guss, Alex Nichol, Alex Paino, Nikolas Tezak, Jie Tang, Igor Babuschkin, Suchir Balaji, Shantanu Jain, William Saunders, Christopher Hesse, Andrew N. Carr, Jan Leike, Josh Achiam, Vedant Misra, Evan Morikawa, Alec Radford, Matthew Knight, Miles Brundage, Mira Murati, Katie Mayer, Peter Welinder, Bob McGrew, Dario Amodei, Sam McCandlish, Ilya Sutskever, and Wojciech Zaremba. Evaluating large language models trained on code, 2021.
- DeepSeek AI (2023) DeepSeek AI. Deepseek coder: Let the code write itself. https://github.com/deepseek-ai/DeepSeek-Coder, 2023.
- Ding et al. (2023) Yangruibo Ding, Zijian Wang, Wasi Uddin Ahmad, Hantian Ding, Ming Tan, Nihal Jain, Murali Krishna Ramanathan, Ramesh Nallapati, Parminder Bhatia, Dan Roth, and Bing Xiang. Crosscodeeval: A diverse and multilingual benchmark for cross-file code completion. In Thirty-seventh Conference on Neural Information Processing Systems Datasets and Benchmarks Track, 2023. URL https://openreview.net/forum?id=wgDcbBMSfh.
- Gao et al. (2023) Luyu Gao, Aman Madaan, Shuyan Zhou, Uri Alon, Pengfei Liu, Yiming Yang, Jamie Callan, and Graham Neubig. Pal: Program-aided language models. In International Conference on Machine Learning, pp. 10764–10799. PMLR, 2023.
- GitHub (2023) GitHub. GitHub Copilot – Your AI pair programmer. https://github.com/features/copilot, 2023.
- Gu et al. (2024) Alex Gu, Baptiste Rozière, Hugh Leather, Armando Solar-Lezama, Gabriel Synnaeve, and Sida I Wang. Cruxeval: A benchmark for code reasoning, understanding and execution. arXiv preprint arXiv:2401.03065, 2024.
- Hendrycks et al. (2021) Dan Hendrycks, Steven Basart, Saurav Kadavath, Mantas Mazeika, Akul Arora, Ethan Guo, Collin Burns, Samir Puranik, Horace He, Dawn Song, and Jacob Steinhardt. Measuring coding challenge competence with apps. NeurIPS, 2021.
- Huang et al. (2024) Dong Huang, Jie M Zhang, Yuhao Qing, and Heming Cui. Effibench: Benchmarking the efficiency of automatically generated code. arXiv preprint arXiv:2402.02037, 2024.
- Jain et al. (2024) Naman Jain, King Han, Alex Gu, Wen-Ding Li, Fanjia Yan, Tianjun Zhang, Sida Wang, Armando Solar-Lezama, Koushik Sen, and Ion Stoica. Livecodebench: Holistic and contamination free evaluation of large language models for code. arXiv preprint arXiv:2403.07974, 2024.
- Jimenez et al. (2023) Carlos E. Jimenez, John Yang, Alexander Wettig, Shunyu Yao, Kexin Pei, Ofir Press, and Karthik Narasimhan. Swe-bench: Can language models resolve real-world github issues?, 2023.
- Kaplan et al. (2020) Jared Kaplan, Sam McCandlish, Tom Henighan, Tom B Brown, Benjamin Chess, Rewon Child, Scott Gray, Alec Radford, Jeffrey Wu, and Dario Amodei. Scaling laws for neural language models. arXiv preprint arXiv:2001.08361, 2020.
- Kojima et al. (2022) Takeshi Kojima, Shixiang Shane Gu, Machel Reid, Yutaka Matsuo, and Yusuke Iwasawa. Large language models are zero-shot reasoners. Advances in neural information processing systems, 35:22199–22213, 2022.
- Lai et al. (2022) Yuhang Lai, Chengxi Li, Yiming Wang, Tianyi Zhang, Ruiqi Zhong, Luke Zettlemoyer, Scott Wen tau Yih, Daniel Fried, Sida Wang, and Tao Yu. Ds-1000: A natural and reliable benchmark for data science code generation, 2022.
- Li et al. (2023) Raymond Li, Loubna Ben Allal, Yangtian Zi, Niklas Muennighoff, Denis Kocetkov, Chenghao Mou, Marc Marone, Christopher Akiki, Jia Li, Jenny Chim, Qian Liu, Evgenii Zheltonozhskii, Terry Yue Zhuo, Thomas Wang, Olivier Dehaene, Mishig Davaadorj, Joel Lamy-Poirier, João Monteiro, Oleh Shliazhko, Nicolas Gontier, Nicholas Meade, Armel Zebaze, Ming-Ho Yee, Logesh Kumar Umapathi, Jian Zhu, Benjamin Lipkin, Muhtasham Oblokulov, Zhiruo Wang, Rudra Murthy, Jason Stillerman, Siva Sankalp Patel, Dmitry Abulkhanov, Marco Zocca, Manan Dey, Zhihan Zhang, Nour Fahmy, Urvashi Bhattacharyya, Wenhao Yu, Swayam Singh, Sasha Luccioni, Paulo Villegas, Maxim Kunakov, Fedor Zhdanov, Manuel Romero, Tony Lee, Nadav Timor, Jennifer Ding, Claire Schlesinger, Hailey Schoelkopf, Jan Ebert, Tri Dao, Mayank Mishra, Alex Gu, Jennifer Robinson, Carolyn Jane Anderson, Brendan Dolan-Gavitt, Danish Contractor, Siva Reddy, Daniel Fried, Dzmitry Bahdanau, Yacine Jernite, Carlos Muñoz Ferrandis, Sean Hughes, Thomas Wolf, Arjun Guha, Leandro von Werra, and Harm de Vries. Starcoder: may the source be with you!, 2023.
- Li et al. (2022) Yujia Li, David Choi, Junyoung Chung, Nate Kushman, Julian Schrittwieser, Rémi Leblond, Tom Eccles, James Keeling, Felix Gimeno, Agustin Dal Lago, Thomas Hubert, Peter Choy, Cyprien de Masson d’Autume, Igor Babuschkin, Xinyun Chen, Po-Sen Huang, Johannes Welbl, Sven Gowal, Alexey Cherepanov, James Molloy, Daniel J. Mankowitz, Esme Sutherland Robson, Pushmeet Kohli, Nando de Freitas, Koray Kavukcuoglu, and Oriol Vinyals. Competition-level code generation with alphacode. Science, 378(6624):1092–1097, December 2022. ISSN 1095-9203. doi: 10.1126/science.abq1158. URL http://dx.doi.org/10.1126/science.abq1158.
- Lin et al. (2024) Ji Lin, Jiaming Tang, Haotian Tang, Shang Yang, Wei-Ming Chen, Wei-Chen Wang, Guangxuan Xiao, Xingyu Dang, Chuang Gan, and Song Han. Awq: Activation-aware weight quantization for llm compression and acceleration. In MLSys, 2024.
- Liu et al. (2024) Changshu Liu, Shizhuo Dylan Zhang, and Reyhaneh Jabbarvand. Codemind: A framework to challenge large language models for code reasoning. arXiv preprint arXiv:2402.09664, 2024.
- Liu et al. (2023a) Jiawei Liu, Chunqiu Steven Xia, Yuyao Wang, and Lingming Zhang. Is your code generated by chatGPT really correct? rigorous evaluation of large language models for code generation. In Thirty-seventh Conference on Neural Information Processing Systems, 2023a. URL https://openreview.net/forum?id=1qvx610Cu7.
- Liu et al. (2023b) Tianyang Liu, Canwen Xu, and Julian McAuley. Repobench: Benchmarking repository-level code auto-completion systems. arXiv preprint arXiv:2306.03091, 2023b.
- Lozhkov et al. (2024) Anton Lozhkov, Raymond Li, Loubna Ben Allal, Federico Cassano, Joel Lamy-Poirier, Nouamane Tazi, Ao Tang, Dmytro Pykhtar, Jiawei Liu, Yuxiang Wei, et al. Starcoder 2 and the stack v2: The next generation. arXiv preprint arXiv:2402.19173, 2024.
- Mendis et al. (2019) Charith Mendis, Cambridge Yang, Yewen Pu, Dr Saman Amarasinghe, and Michael Carbin. Compiler auto-vectorization with imitation learning. Advances in Neural Information Processing Systems, 32, 2019.
- Mirhoseini et al. (2017) Azalia Mirhoseini, Hieu Pham, Quoc V Le, Benoit Steiner, Rasmus Larsen, Yuefeng Zhou, Naveen Kumar, Mohammad Norouzi, Samy Bengio, and Jeff Dean. Device placement optimization with reinforcement learning. In International conference on machine learning, pp. 2430–2439. PMLR, 2017.
- Muennighoff et al. (2023) Niklas Muennighoff, Qian Liu, Armel Zebaze, Qinkai Zheng, Binyuan Hui, Terry Yue Zhuo, Swayam Singh, Xiangru Tang, Leandro Von Werra, and Shayne Longpre. Octopack: Instruction tuning code large language models. In NeurIPS 2023 Workshop on Instruction Tuning and Instruction Following, 2023.
- OpenAI (2023) OpenAI. Gpt-4 technical report, 2023.
- Pearce et al. (2022) Hammond Pearce, Baleegh Ahmad, Benjamin Tan, Brendan Dolan-Gavitt, and Ramesh Karri. Asleep at the keyboard? assessing the security of github copilot’s code contributions. In 2022 IEEE Symposium on Security and Privacy (SP), pp. 754–768. IEEE, 2022.
- Qiu et al. (2024) Ruizhong Qiu, Weiliang Will Zeng, Hanghang Tong, James Ezick, and Christopher Lott. How efficient is llm-generated code? a rigorous & high-standard benchmark. arXiv preprint arXiv:2406.06647, 2024.
- Rozière et al. (2023) Baptiste Rozière, Jonas Gehring, Fabian Gloeckle, Sten Sootla, Itai Gat, Xiaoqing Ellen Tan, Yossi Adi, Jingyu Liu, Tal Remez, Jérémy Rapin, Artyom Kozhevnikov, Ivan Evtimov, Joanna Bitton, Manish Bhatt, Cristian Canton Ferrer, Aaron Grattafiori, Wenhan Xiong, Alexandre Défossez, Jade Copet, Faisal Azhar, Hugo Touvron, Louis Martin, Nicolas Usunier, Thomas Scialom, and Gabriel Synnaeve. Code llama: Open foundation models for code, 2023.
- Shypula et al. (2023) Alexander Shypula, Aman Madaan, Yimeng Zeng, Uri Alon, Jacob Gardner, Milad Hashemi, Graham Neubig, Parthasarathy Ranganathan, Osbert Bastani, and Amir Yazdanbakhsh. Learning performance-improving code edits. arXiv preprint arXiv:2302.07867, 2023.
- Waghjale et al. (2024) Siddhant Waghjale, Vishruth Veerendranath, Zora Zhiruo Wang, and Daniel Fried. Ecco: Can we improve model-generated code efficiency without sacrificing functional correctness? arXiv preprint arXiv:2407.14044, 2024.
- Wang et al. (2023) Zhiruo Wang, Shuyan Zhou, Daniel Fried, and Graham Neubig. Execution-based evaluation for open-domain code generation. In The 2023 Conference on Empirical Methods in Natural Language Processing, 2023.
- Weaver (2013a) Vincent M Weaver. Linux perf_event features and overhead. In The 2nd international workshop on performance analysis of workload optimized systems, FastPath, volume 13, pp. 5, 2013a.
- Weaver (2013b) Vincent M Weaver. Linux perf_event features and overhead. In The 2nd international workshop on performance analysis of workload optimized systems, FastPath, volume 13, pp. 5, 2013b.
- Wei et al. (2022) Jason Wei, Xuezhi Wang, Dale Schuurmans, Maarten Bosma, Fei Xia, Ed Chi, Quoc V Le, Denny Zhou, et al. Chain-of-thought prompting elicits reasoning in large language models. Advances in neural information processing systems, 35:24824–24837, 2022.
- Wei et al. (2024) Yuxiang Wei, Zhe Wang, Jiawei Liu, Yifeng Ding, and Lingming Zhang. Magicoder: Empowering code generation with oss-instruct. In Forty-first International Conference on Machine Learning, 2024.
- Wikipedia (2024) Wikipedia. Hardware performance counter - wikipedia, 2024. URL https://en.wikipedia.org/wiki/Hardware_performance_counter.
- Xie et al. (2024) Songrun Xie, Junhao Wang, and Jiawei Liu. Evalplus leaderboard, 2024. URL https://evalplus.github.io/leaderboard.html.
- Yin et al. (2022) Pengcheng Yin, Wen-Ding Li, Kefan Xiao, Abhishek Rao, Yeming Wen, Kensen Shi, Joshua Howland, Paige Bailey, Michele Catasta, Henryk Michalewski, et al. Natural language to code generation in interactive data science notebooks. arXiv preprint arXiv:2212.09248, 2022.
- Zan et al. (2022) Daoguang Zan, Bei Chen, Dejian Yang, Zeqi Lin, Minsu Kim, Bei Guan, Yongji Wang, Weizhu Chen, and Jian-Guang Lou. Cert: continual pre-training on sketches for library-oriented code generation. arXiv preprint arXiv:2206.06888, 2022.
- Zhang et al. (2023) Kexun Zhang, Danqing Wang, Jingtao Xia, William Yang Wang, and Lei Li. ALGO: Synthesizing algorithmic programs with generated oracle verifiers. In Thirty-seventh Conference on Neural Information Processing Systems, 2023. URL https://openreview.net/forum?id=JolrEmMim6.
- Zheng et al. (2020) Lianmin Zheng, Chengfan Jia, Minmin Sun, Zhao Wu, Cody Hao Yu, Ameer Haj-Ali, Yida Wang, Jun Yang, Danyang Zhuo, Koushik Sen, et al. Ansor: Generating High-Performance tensor programs for deep learning. In 14th USENIX symposium on operating systems design and implementation (OSDI 20), pp. 863–879, 2020.
- Zheng et al. (2023) Qinkai Zheng, Xiao Xia, Xu Zou, Yuxiao Dong, Shan Wang, Yufei Xue, Zihan Wang, Lei Shen, Andi Wang, Yang Li, et al. Codegeex: A pre-trained model for code generation with multilingual evaluations on humaneval-x. arXiv preprint arXiv:2303.17568, 2023.
- Zhou et al. (2020) Yanqi Zhou, Sudip Roy, Amirali Abdolrashidi, Daniel Wong, Peter Ma, Qiumin Xu, Hanxiao Liu, Phitchaya Phothilimtha, Shen Wang, Anna Goldie, et al. Transferable graph optimizers for ml compilers. Advances in Neural Information Processing Systems, 33:13844–13855, 2020.
- Zhuo et al. (2024) Terry Yue Zhuo, Minh Chien Vu, Jenny Chim, Han Hu, Wenhao Yu, Ratnadira Widyasari, Imam Nur Bani Yusuf, Haolan Zhan, Junda He, Indraneil Paul, et al. Bigcodebench: Benchmarking code generation with diverse function calls and complex instructions. arXiv preprint arXiv:2406.15877, 2024.
Appendix A Appendix
A.1 Runtime Variation at Different Runtime Scales
We profile each validated solution sample from Section 3 5 times and draw the relation of its runtime variation and mean runtime in Figure 6, on the i7-10700K desktop (Section 4.2) without any other mandatory processes running. Specifically, the X-axis presents the mean runtime and the Y-axis presents the Coefficient of Variation (CV). Each blue dot in Figure 6 corresponds to a data point of one profiled solution and the purple bars draw the mean variation for each runtime magnitude at the scale of . Figure 6 shows that in practice smaller executions are more sensitive to system noise despite using a clean test bed. This motivates the necessity of using large computations for robust and meaningful performance benchmarking.

A.2 Discussion of Performance Measurement and Metrics
In this section, we discuss the pros and cons of different performance measurement methods as well as the commonly used metric of relative speedup.
Measurements. There are three primary measurements in the context of machine learning for code performance.
-
1.
Physical runtime is the most commonly used metric for performance comparison (Mendis et al., 2019; Zheng et al., 2020; Zhou et al., 2020; Baghdadi et al., 2021; Mirhoseini et al., 2017). While physical runtime is easy to measure and can reflect physical differences, it can incur high variation in repetitive executions, especially in noisy environments (e.g., shared cloud platforms that run various applications). As it is difficult to control the system noise when running performance benchmarking in the wild, it oftentimes challenges reproducibility.
-
2.
Architecture simulator is used by Shypula et al. (2023) to address the cross-platform reproducibility issue. Architecture simulators such as Gem5 (Binkert et al., 2011) use software to simulate the CPU behaviors when executing a program and therefore its reproducibility is guaranteed by software. However, also because it is a software-based approach, simulating the program execution is oftentimes much slower than native execution and does not necessarily reflect the physical performance. Meanwhile, it is also not user-friendly to set up and run such simulators for interpreter-based programming languages such as the commonly used Python.
-
3.
Hardware performance counter (Wikipedia, 2024) is used by EvalPerf (ours) to natively record the number of executed instructions between two program points. There are several benefits of using hardware counters: (i) Usability: performance counters are easy to use that one can simply query system calls between two program points to obtain the profile; (ii) Efficiency: performance counters only incur light-weight overheads (Weaver, 2013b); (iii) Reproducibility: the reported #instructions are highly reproducible that the observed variance of repeated executions are at most a few hundred instructions (e.g., caused by context switch), whereas most computations in our benchmark can use billions of instructions. Note that #instructions might vary across platforms due to different hardware and software settings. However, because EvalPerf follows DPE to determine performance ranking by referencing representative solutions, such inconsistency becomes invisible when computing DPS on different test beds, shown in Section 4.2. Last but not least, it does not mean that hardware counter can always replace simulators given that one of its major use cases is to mimic the behaviors of certain CPUs without having them physically.
Relative speedup is also a commonly used compound metric that is agnostic to the measurements mentioned above. Although straightforward for direct comparisons between two programs, its applicability becomes less clear across a broad range of tasks. This is because the degree of speedup varies significantly across different tasks, with the average speedup often skewed by tasks that allow for substantial improvements, such as optimizing an iterative solution over a recursive one for the n-th Fibonacci number calculation. This variability can lead to confusion, making it challenging to discern whether observed efficiency gains reflect a holistic improvement or are merely the result of optimizations for a narrow set of highly improvable tasks.
To overcome these limitations, Differential Performance Evaluation (DPE) defines a new metric, termed Differential Performance Score (DPS). Specifically, DPS for each task has a consistent range from 0 to 100% which stands for its empirical global performance position. This metric allows for an immediate understanding of a solution’s effectiveness and the distance to optimal performance by comparison with benchmark solutions, providing a more nuanced and scalable approach to evaluating program efficiency improvements.
A.3 Extended Results of Code Correctness and Efficiency
In this section, we complement Section 4.1 to show more result details in the code efficiency evaluation of LLMs. Specifically, Table 3 lists the detailed correctness on three sets of tasks and the performance scores of both DPS and DPSnorm on EvalPerf. The sample-wise performance scores are consolidated by calculating the average, maximum, and minimum scores within the initial 10 samples of each task and then we aggregate the task-wise score by computing the average. Notably, different than the main evaluations in Section 4.1, efficiency scores in this section are computed over all passing tasks within each model for global comparison, i.e., the correctness can impact the set of tasks that are used to compute the efficiency scores.
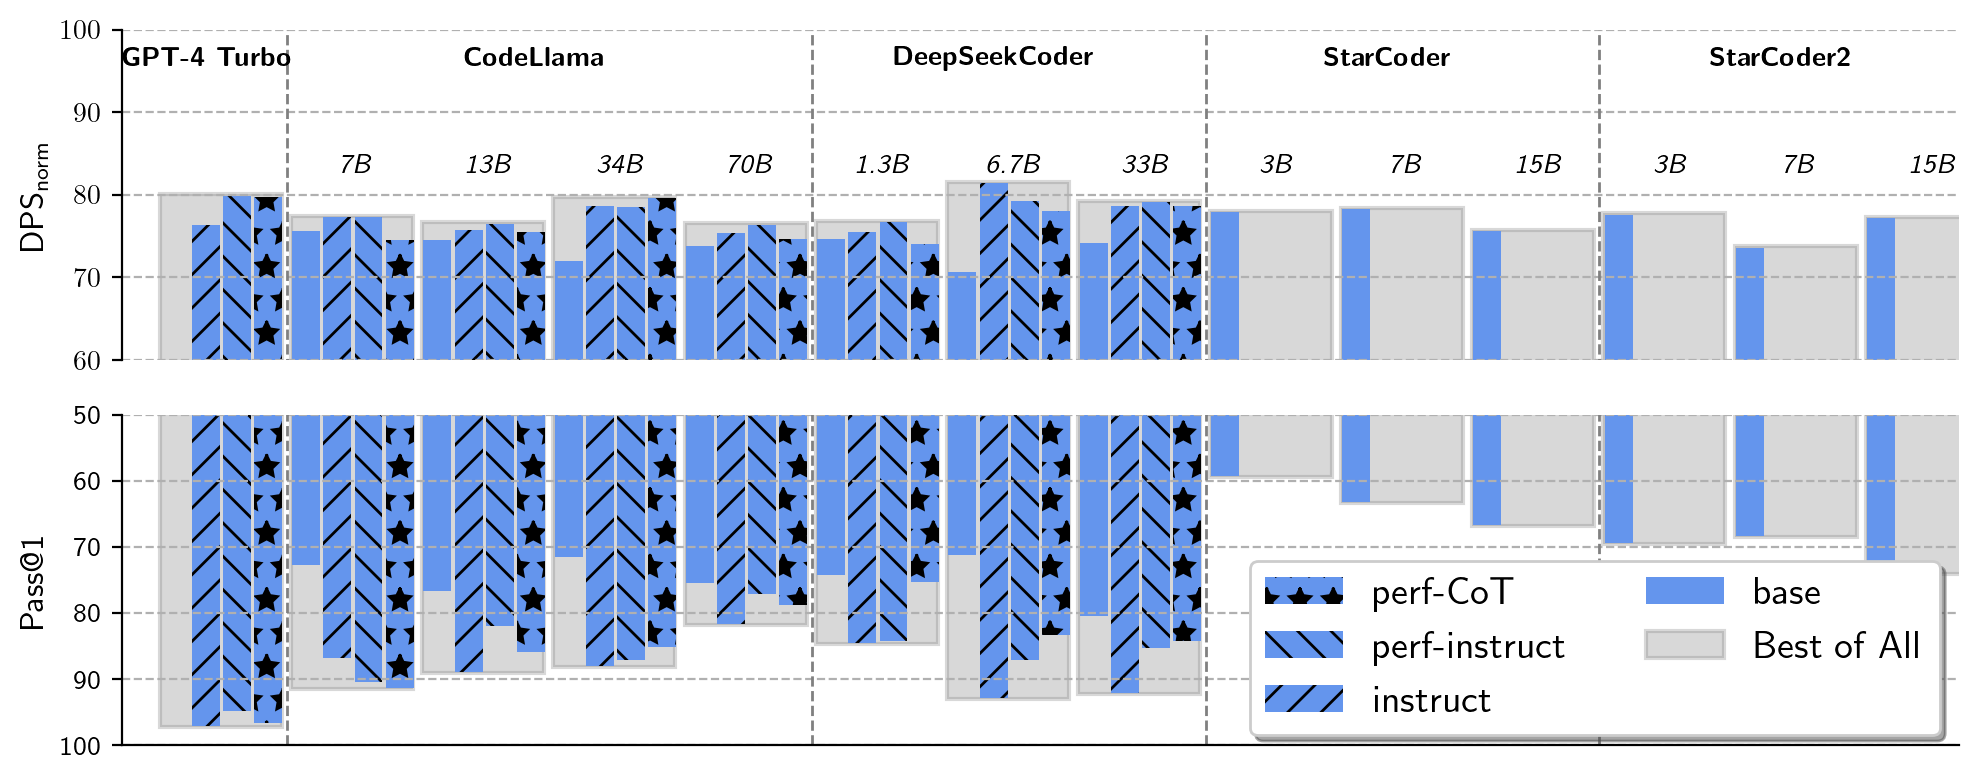
Moreover, Figure 8 offers a side-by-side comparison with Figure 7, illustrating DPSnorm against DPS. Compared to DPS, DPSnorm on EvalPerf tasks tend to be lower, indicating that the distribution of correct LLM samples is skewed to slower implementation. This is expected, as crafting efficient code often presents a greater challenge. Interestingly, while GPT-4 Turbo achieves the best DPS in Figure 7, using DPSnorm the best-performing model becomes DeepSeekCoder-6.7B-instruct. This indicates that GPT-4 Turbo can generate code that is faster than the majority while DeepSeekCoder-6.7B-instruct tends to generate code that is on top of various efficiency levels.
Additionally, Figure 9 and Figure 10 show the correctness scores by computing pass@ for the 121 EvalPerf tasks. Interestingly, we see a trend of reversed scaling law on CodeLlama model family that smaller CodeLlama models even achieve better pass rate. Despite this, other findings are overall consistent with that of Figure 7 and Figure 8.
| Correctness (pass@) | DPS | DPSnorm | |||||||
| HE+ | MBPP+ | EvalPerf | Avg | Max | Min | Avg | Max | Min | |
| CodeLlama-7B base | 35.9 | 46.4 | 72.8 | 79.3 | 85.8 | 71.4 | 75.6 | 80.2 | 69.5 |
| instruct | 36.8 | 44.5 | 86.9 | 80.6 | 80.7 | 80.2 | 77.3 | 77.5 | 77.1 |
| perf-instruct | 33.0 | 44.1 | 90.5 | 80.1 | 80.2 | 79.8 | 77.3 | 77.3 | 77.0 |
| perf-CoT | 32.5 | 44.1 | 91.3 | 77.8 | 78.3 | 77.4 | 74.5 | 74.9 | 74.3 |
| CodeLlama-13B base | 38.7 | 50.4 | 76.7 | 75.6 | 80.6 | 67.7 | 74.5 | 77.2 | 70.0 |
| instruct | 40.2 | 50.6 | 88.9 | 80.3 | 80.7 | 78.7 | 75.8 | 76.3 | 75.2 |
| perf-instruct | 37.4 | 49.4 | 82.0 | 80.9 | 82.2 | 79.4 | 76.5 | 77.3 | 75.7 |
| perf-CoT | 36.4 | 49.1 | 85.9 | 78.7 | 80.9 | 75.5 | 75.5 | 76.8 | 73.5 |
| CodeLlama-34B base | 44.0 | 53.4 | 71.6 | 73.0 | 80.6 | 64.2 | 72.0 | 76.0 | 67.7 |
| instruct | 45.1 | 53.0 | 88.1 | 81.9 | 82.6 | 79.5 | 78.6 | 79.0 | 77.7 |
| perf-instruct | 43.3 | 50.7 | 87.1 | 79.8 | 82.0 | 78.3 | 78.5 | 79.2 | 77.8 |
| perf-CoT | 41.7 | 49.7 | 85.1 | 81.8 | 83.8 | 80.2 | 79.6 | 81.2 | 78.7 |
| CodeLlama-70B base | 50.2 | 52.9 | 75.5 | 75.9 | 84.8 | 65.8 | 73.8 | 79.3 | 68.6 |
| instruct | 62.5 | 60.2 | 81.7 | 79.2 | 85.4 | 71.2 | 75.4 | 79.3 | 70.1 |
| perf-instruct | 59.3 | 59.0 | 77.1 | 79.5 | 82.6 | 72.2 | 76.4 | 78.1 | 72.4 |
| perf-CoT | 60.2 | 58.6 | 78.8 | 76.9 | 82.2 | 71.3 | 74.6 | 78.6 | 70.8 |
| DeepSeekCoder-1.3B base | 25.6 | 45.9 | 74.3 | 74.7 | 79.4 | 69.6 | 74.6 | 78.0 | 71.1 |
| instruct | 59.0 | 50.7 | 84.5 | 80.0 | 83.6 | 76.2 | 75.5 | 77.9 | 73.9 |
| perf-instruct | 59.4 | 49.5 | 84.2 | 82.0 | 84.5 | 79.2 | 76.7 | 77.9 | 75.6 |
| perf-CoT | 60.3 | 47.0 | 75.4 | 77.1 | 82.6 | 69.5 | 74.1 | 77.7 | 69.9 |
| DeepSeekCoder-6.7B base | 36.3 | 55.2 | 71.3 | 73.3 | 80.9 | 64.2 | 70.6 | 74.8 | 65.9 |
| instruct | 74.9 | 63.2 | 92.9 | 89.9 | 90.7 | 88.5 | 81.4 | 81.6 | 80.9 |
| perf-instruct | 74.4 | 60.7 | 87.2 | 86.3 | 87.9 | 84.2 | 79.3 | 80.2 | 78.0 |
| perf-CoT | 70.5 | 59.9 | 83.4 | 81.8 | 88.5 | 74.5 | 78.1 | 82.0 | 74.6 |
| DeepSeekCoder-33B base | 42.3 | 60.6 | 80.5 | 79.2 | 84.2 | 72.1 | 74.2 | 77.6 | 70.2 |
| instruct | 74.6 | 67.5 | 92.2 | 85.4 | 87.4 | 82.3 | 78.6 | 79.7 | 76.7 |
| perf-instruct | 71.6 | 66.5 | 85.3 | 86.3 | 87.9 | 84.3 | 79.1 | 80.3 | 77.9 |
| perf-CoT | 73.2 | 64.4 | 84.2 | 82.4 | 86.0 | 76.2 | 78.6 | 81.8 | 75.0 |
| StarCoder-3B base | 17.1 | 35.4 | 59.3 | 80.3 | 86.1 | 71.5 | 77.9 | 82.3 | 72.4 |
| StarCoder-7B base | 24.0 | 40.5 | 63.3 | 83.2 | 87.0 | 77.1 | 78.3 | 80.7 | 74.8 |
| StarCoder-15B base | 28.7 | 48.1 | 66.7 | 80.4 | 85.0 | 76.3 | 75.6 | 78.3 | 73.4 |
| StarCoder2-3B base | 26.1 | 45.7 | 69.4 | 80.5 | 84.1 | 76.5 | 77.6 | 80.1 | 74.9 |
| StarCoder2-7B base | 29.4 | 45.4 | 68.3 | 73.8 | 81.6 | 65.3 | 73.6 | 77.9 | 69.5 |
| StarCoder2-15B base | 37.8 | 54.2 | 74.0 | 82.1 | 88.2 | 73.8 | 77.2 | 80.7 | 73.2 |
| GPT-4 Turbo instruct | 81.7 | 73.0 | 97.1 | 88.5 | 89.8 | 86.3 | 76.3 | 78.2 | 74.6 |
| perf-instruct | 82.3 | 71.2 | 94.9 | 90.5 | 92.2 | 87.5 | 79.9 | 81.3 | 77.4 |
| perf-CoT | 83.5 | 71.2 | 96.7 | 91.5 | 94.6 | 90.3 | 79.7 | 82.6 | 77.7 |