DNABERT-2: Efficient Foundation Model and Benchmark For Multi-Species Genomes
Abstract
Decoding the linguistic intricacies of the genome is a crucial problem in biology, and pre-trained foundational models such as DNABERT and Nucleotide Transformer have made significant strides in this area. Existing works have largely hinged on k-mer, fixed-length permutations of A, T, C, and G, as the token of the genome language due to its simplicity. However, we argue that the computation and sample inefficiencies introduced by k-mer tokenization are primary obstacles in developing large genome foundational models. We provide conceptual and empirical insights into genome tokenization, building on which we propose to replace k-mer tokenization with Byte Pair Encoding (BPE), a statistics-based data compression algorithm that constructs tokens by iteratively merging the most frequent co-occurring genome segment in the corpus. We demonstrate that BPE not only overcomes the limitations of k-mer tokenization but also benefits from the computational efficiency of non-overlapping tokenization. Based on these insights, we introduce DNABERT-2, a refined genome foundation model that adapts an efficient tokenizer and employs multiple strategies to overcome input length constraints, reduce time and memory expenditure, and enhance model capability. Furthermore, we identify the absence of a comprehensive and standardized benchmark for genome understanding as another significant impediment to fair comparative analysis. In response, we propose the Genome Understanding Evaluation, a comprehensive multi-species genome classification dataset that amalgamates distinct datasets across tasks, with input lengths ranging from to . Through comprehensive experiments on the GUE benchmark, we demonstrate that DNABERT-2 achieves comparable performance to the state-of-the-art model with fewer parameters and approximately less GPU time 111About 14 days on 8 NVIDIA RTX 2080Ti V.S. 28 days on 128 NVIDIA A100. Estimated with the Method 2: GPU Time introduced by OpenAI in https://openai.com/research/ai-and-compute. in pre-training. Compared to DNABERT, while being more efficient, DNABERT-2 outperforms it on out of datasets, with an average improvement of absolute scores on GUE. The code, data, and pre-trained model are available at https://github.com/MAGICS-LAB/DNABERT_2.
1 Introduction
Transformer-based foundation models (Bommasani et al., 2022; Kenton & Toutanova, 2019; OpenAI, 2023) have witnessed significant progress in recent years, particularly exemplified by the advent of groundbreaking language models like ChatGPT (Ouyang et al., 2022; OpenAI, 2023). In parallel, the significance of foundation models has also been increasingly appreciated in the genomics field, as they represent the understanding of genome sequences via numerical embeddings that are directly applicable to various genome analysis tasks. These models can capture complex relationships and dependencies in DNA sequences, opening new avenues for understanding transcriptional regulation (Li et al., 2023), non-coding genetic variants associated with human diseases and traits (Rozowsky et al., 2023), and the functional effects of regulatory elements (Smith et al., 2023). Recent advancements in genome language modeling have demonstrated their superiority in a range of downstream applications, including promoter prediction (Le et al., 2022; Zhang et al., 2022), gene expression prediction (Avsec et al., 2021), DNA methylation prediction (Jin et al., 2022), chromatin state analysis (Lee et al., 2022), promoter-enhancer interaction prediction (Chen et al., 2022; Ni et al., 2022), TF-DNA binding prediction (Wang et al., 2022), variant effect prediction (Rozowsky et al., 2023), gene network prediction (Theodoris et al., 2023) and more. These models provide researchers with powerful tools to understand the functional importance of different genomics elements and unravel key biological processes and mechanisms.
In this context, Ji et al. (2021) developed DNABERT, an initial foundation model (FM), to unravel the human genome from a language perspective. Despite being widely applied in the community, several technical limitations still present at the time with the original DNABERT implementation, limiting its full potential. First, although proven to be generalizable to other organisms, the pretraining was solely done on the human reference genome, omitting the sequence conservation and diversity across species. Second, k-mer tokenization resulted in information leakage and overall poor computational efficiency during pre-training, which hampers its scalability. Lastly, the simplistic DNABERT-XL solution—intended to bypass the restriction of 512 input sequences imposed by the learned positional embedding (Kenton & Toutanova, 2019)—fell short in handling long input sequences, both in efficiency and effectiveness. These limitations underlined the need for further advancements in the domain of DNA language models.
Recently, Dalla-Torre et al. (2023) introduced Nucleotide Transformers (NT), a series of genome foundation models scaling from to parameters. NT alleviated the first two limitations of DNABERT by pre-training on a large collection of genomes from 850 species and replacing overlapping k-mer tokenization with a non-overlapping version, substantially reducing tokenized sequence length. Despite this, a hard input length limitation still exist, while, as we will discuss in Sec. 2, non-overlapping k-mer tokenization also suffered from poor sample efficiency as it complicates the model’s task of aligning significantly distinct representations of near-identical inputs.
In view of the aforementioned limitations, we introduce DNABERT-2, a multi-species genome foundation model that replaces k-mer tokenization with Byte Pair Encoding (BPE) (Sennrich et al., 2016), a data compression algorithm that has been widely used by large language models. We show that BPE effectively addresses the known issues of k-mer tokenization while maintaining the computational efficiency of non-overlapping tokenization. Moreover, DNABERT-2 overcomes the limitation of DNABERT by replacing learned positional embeddings with Attention with Linear Biases (ALiBi) (Press et al., 2021) to get rid of the input length limitation, incorporating Flash Attention (Dao et al., 2022) to increase computational efficiency, and adjusting model architecture to increase model capability. As a result of the efficient tokenizer and advanced model architecture, DNABERT-2 achieves comparable performance to the state-of-the-art model with approximately less computational cost and fewer parameters, identifying its computation- and sample- efficiency and enabling efficient fine-tuning on most consumer GPUs.
Meanwhile, despite progress in genome foundational models, the absence of carefully curated benchmarks has posed a significant challenge. Owing to the unstandardized pre-processing pipeline of genome sequences, it is unjust to directly compare model performances with results reported in previous papers, even when the data originate from the same source. Moreover, many genome understanding evaluation datasets used in existing works (Dalla-Torre et al., 2023) are either too trivial or too challenging, leading to similar scores for most models and failing to accurately reflect different models’ capabilities. The scarcity of high-quality benchmark datasets hampers evaluating and comparing different models and further hinders the development of novel techniques. To this end, we introduce Genome Understanding Evaluation (GUE & GUE+), a standardized and comprehensive multi-species benchmark containing datasets across important genome analysis tasks on genomes of species with input lengths ranging from to . All the datasets are elaborately calibrated with a series of strategies to ensure they are suitable for reflecting the capability level of existing genome foundation models.
Our main contributions can be therefore summarized as follows: 1) We identify key obstacles in genome tokenization and provide deep insights, presenting a simple yet effective solution that balances the efficiency and effectiveness of genome foundation models; 2) We introduce DNABERT-2, an efficient pre-trained foundation model for multi-species genome that delivers performance on par with the state-of-the-art model while being smaller and utilizes approximately less GPU time; 3) We introduce Genome Understanding Evaluation (GUE), a standardized, comprehensive, and well-calibrated multi-species genome classification benchmark including tasks and datasets to facilitate research in genome foundation model.
2 Background
Tokenization serves as a critical initial step in language modeling, significantly impacting the efficiency and effectiveness of the model. DNA sequences consist of unique nucleotide bases: A, T, C, and G. A majority of genome language models (Ji et al., 2021; Dalla-Torre et al., 2023) utilize the k-mer tokenization technique, in which each contiguous -length genome segment is considered as a token. During tokenization, a sliding window with window size and stride is employed to convert the original genome sequence into a series of k-mers. Here, the stride is either set as or , while the first one represents the overlapping version of k-mer tokenization and the other one represents the non-overlapping version. Figure 1 presents examples of overlapping (left) and non-overlapping (right) k-mer tokenizations. Despite its wide application, we argue that both versions of the k-mer tokenization are less optimal.
Overlapping k-mers tokenization ensures adjacent tokens always overlap by characters, resulting in significant information leakage in masked language modeling. As depicted in Figure 1, a masked token is entirely leaked when adjacent tokens from both sides are not masked, and it is partially leaked when adjacent tokens from only one side are present. Generally, in the overlapping -mer tokenization setting, let and denote the distances between a masked token [M] and its closest unmasked adjacent token on the left and right sides, the number of possible options of [M] is . In other words, to prevent the entire leakage of a masked token, at least tokens on its left and right sides in total must be masked, which explains why Ji et al. (2021) opt to mask a continuous span of tokens. Furthermore, to guarantee no leakage of a masked token, at least tokens on both sides must be masked. Nevertheless, information leakage is still inevitable for the leftmost and rightmost masked tokens. Ideally, in masked language modeling, a model is required to select the best option from the entire vocabulary, enabling it to differentiate and evaluate among a large number of options. However, if the search space is undesirably reduced due to information leakage, the model only needs to differentiate between a limited number of options. Consequently, this results in poor sample efficiency, as the model may not be sufficiently challenged to learn the underlying patterns in the data. Also, the tokenized sequence for an input of length consists of tokens, each with a length of . This results in a tokenized sequence with considerable redundancy and a length nearly equivalent to the original sequence, leading to low computation efficiency considering the quadratic computation complexity of Transformer-based (Vaswani et al., 2017) models. This becomes particularly problematic when attempting to scale up the model. Therefore, Dalla-Torre et al. (2023) proposed the non-overlapping k-mer tokenization.
Non-overlapping k-mer tokenization, despite its advantage of reducing sequence length by a factor of , is plagued by a notable issue of sample inefficiency. Figure 1 graphically illustrates this problem. Considering a scenario when the context window is reduced by , the model input is then switched from Sequence 1 to Sequence 2. In theory, this should involve a minor adjustment in tokenized output. However, with the non-overlapping k-mer tokenizer, this minor shift instigates a dramatic alteration in the tokenized output. Despite the two sequences originating from the same genomic segment, their tokenized representations bear little resemblance. This inconsistent behavior introduces unnecessary hurdles for the model during training, as it poses unnecessary difficulty for the model to align distinct representations of identical or near-identical inputs. Consequently, the inefficiency in learning from the data could impede the overall model performance. The implications of these observations advocate for a re-evaluation of tokenization strategies for the genome language, with a focus on strategies that ensure robust and efficient representation.
To address the aforementioned issues, we propose to adapt SentencePiece (Kudo & Richardson, 2018), a subword tokenization framework widely used in natural language processing, to replace k-mer tokenization for genome sequences. We employ Byte-Pair Encoding (BPE) (Sennrich et al., 2016) to iteratively merge frequent pairs of nucleotides and genome segments, forming a vocabulary of variable-length tokens that effectively represent the entire genome dataset. Despite its conceptual simplicity, this method is well-suited for genome foundation models. First, it not only prevents information leakage but also significantly reduces the sequence length by approximately times (detailed statistics are presented in Sec 3.1), substantially improving computational efficiency. Moreover, its robust tokenization result is beneficial for sample efficiency since it allows the model to focus on understanding the genome language semantics without being distracted by the distinct representations of the same input. Furthermore, unlike k-mer tokenization, BPE doesn’t always produce tokens of length . Consequently, when a token containing an unspecified number of nucleotides is masked, the model is challenged to predict both the number of nucleotides and the particular nucleotides themselves. This naturally transforms the masked language modeling objective into a T5-style (Raffel et al., 2020) "replace spans of text" objective, which has been demonstrated to be more effective than standard masked language modeling in various scenarios.
3 Method
In this section, we provide empirical analysis on the BPE tokenizer for genome language (§ 3.1) and describe the model architecture (§ 3.2) and implementation details (§ A.2) of DNABERT-2.
3.1 Tokenizer
DNABERT-2 adapts SentencePiece (Kudo & Richardson, 2018) with Byte Pair Encoding (BPE) (Sennrich et al., 2016) to perform tokenization for DNA sequences. SentencePiece is a language-agnostic tokenizer that considers each input as a raw stream without assuming any pre-tokenization, which matches greatly with genome sequences where the definitions of word and sentence do not exist. BPE is a compression algorithm that has been widely used in the area of natural language processing as a word segmentation strategy. It learns a fixed-sized vocabulary of variable-length tokens based on the co-occurrence frequency of the characters. Figure 2 illustrates the process of constructing a vocabulary from a given corpus with BPE. First, we initialize the vocabulary with all unique characters in the corpus. Then, in each iteration, we view the most frequent character segment (e.g., TA at iteration ) as a new word, add it to the vocabulary, and update the corpus by replacing all the same segments with this new word. The iteration continues till we achieve the desired number of words in the vocabulary. Thus, the target vocabulary size plays a crucial role.
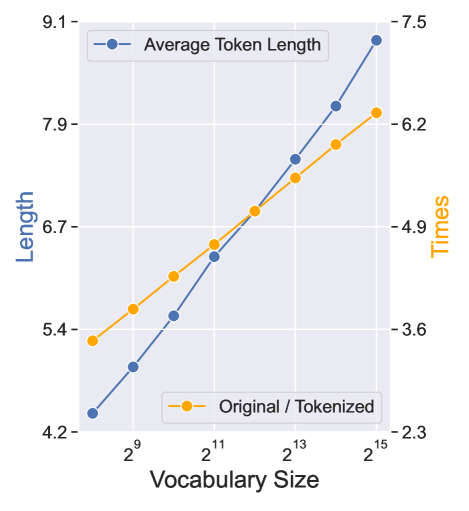
Due to the significant difference between natural language and DNA sequence, vocabulary sizes that are commonly used in the NLP area (Kenton & Toutanova, 2019; Vaswani et al., 2017; Raffel et al., 2020; OpenAI, 2023) may not be appropriate for genome sequences. To determine the most suitable vocabulary size, we constructed vocabularies with target sizes ranging from to on the multi-species genomes (see Sec. 4.1) to empirically evaluate the impact of varying vocabulary sizes. As indicated in Figure 3a, larger vocabularies tend to encompass more lengthy tokens, which enables the tokenizer to represent the same input sequence with fewer tokens. Shorter tokenized sequences consequently reduce the computational cost (See Figure 3b), as the computational complexity of Transformers is quadratic in relation to the input sequence length. Therefore, from the computation efficiency perspective, a larger vocabulary size is favorable.
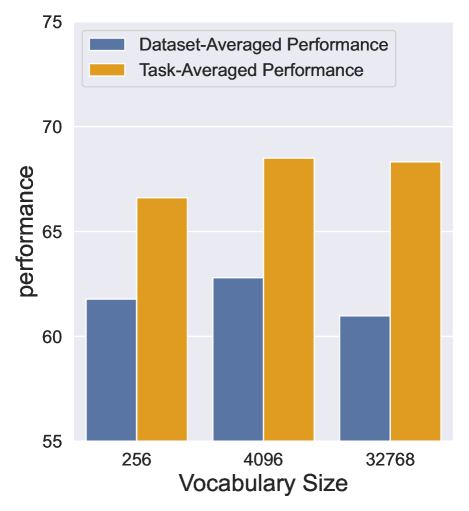
However, a larger vocabulary leads to more sparse updates to the embedding layer, given that each token would be used less frequently, which might compromise the model’s performance. We empirically analyzed this issue by pre-training three different DNABERT-2 variants with vocabulary sizes of , , and on the multi-species genome dataset with a batch size of for steps and evaluating them on the GUE benchmark (see Sec. 4.2). Figure 3c displays the performance of each variant, where the model performance is measured by the dataset- and task-average scores. As depicted in the figure, unlike computational efficiency, the model’s performance does not consistently improve as the vocabulary size increases. Therefore, we selected a vocabulary size of for training the final DNABERT-2 model, as it best balances model performance with computational efficiency among the candidates.

3.2 Model
DNABERT-2 adapts the Transformer Encoder architecture. To address the limitations of existing models, we incorporate a series of recent advances in deep learning to increase the model’s efficiency and capability, including: 1) replacing learned positional embeddings with the Attention with Linear Biases (ALiBi) (Press et al., 2021) to overcome the input length limitation; 2) utilizing FlashAttention (Dao et al., 2022) and Low Precision Layer Normalization to increase computation and memory efficiency; 3) employing the Low-Rank Adaptation (LoRA) (Hu et al., 2021) in the fine-tuning stage (if necessary) for parameter-efficient training.
Attention with Linear Biases.
Due to the permutation-invariant nature of the attention mechanism, explicit positional information is required in attention-based models. Existing solutions such as Sinusoidal (Vaswani et al., 2017), learned (Kenton & Toutanova, 2019), and Rotary (Su et al., 2021) positional embedding methods either suffer from input length restriction or poor extrapolation capability when applied to sequences longer than training data. Attention with Linear Biases (ALiBi) provides an efficient yet effective solution. Instead of adding position embeddings to the input, ALiBi adds a fixed set of static, non-learned biases to each attention calculation to incorporate positional information into attention scores. Specifically, let define the - query in the input sequence of length and defines the key matrix, the attention score of query is calculated as: , where is a fixed head-specific constant. ALiBi used a geometric sequence (i.e., ) of different to each attention head. Intuitively, ALiBi increasingly penalizes attention scores between key-query pairs as their distances increase, and determines the penalty rate. Replacing learned position embedding with ALiBi allows DNABERT-2 to effectively handle arbitrarily long sequences during fine-tuning and inference despite being pre-trained on relatively short sequences.
Flash Attention.
Flash attention is an IO-aware algorithm that implements the exact standard attention calculation in a more time- and memory-efficient way. It identifies a main bottleneck of standard attention implementation as the lack of taking the number of reads and writes to fast GPU on-chip SRAM and relatively slow GPU high bandwidth memory (HBM) into account. To avoid reading and writing to the slow HBM, it splits Key/Query/Value matrices into blocks and incrementally performs softmax over the entire input. It also proposes to recompute large intermediate results like attention scores in backward pass to trade extra computation for fewer IO with HBM, which empirically leads to less computational time without sacrificing model performance.
Low-Rank Adaptation (LoRA).
Fine-tuning all the parameters of a model becomes increasingly expensive as the pre-trained model becomes much larger. Thus, we adopt LoRA, a parameter-efficient fine-tuning method that significantly reduces the computation and memory costs with ignorable performance sacrifice. Let define the same weight matrix before and after task-specific fine-tuning, and we have , where represents the change of each weight element during the fine-tuning. In ordinary fine-tuning, we independently update each weight based on its corresponding gradient, while in LoRA, we represent with a low-rank decomposition , where , , and . Modeling with low-rank decomposition reduces the number of trainable parameters from to , leading to significant improvement in training time and memory usage.
Besides, we replace the Relu activation function with GEGLU (Shazeer, 2020), a variant of GLU (Dauphin et al., 2017) that has been shown to improve the performance of Transformer models. The GEGLU function is calculated as , where is the function input, and are learnable weights, and and are learnable biases. The GELU function is defined as , where is the cumulative distribution function (CDF) of the standard normal distribution.
4 Data
In order to facilitate further research on large-scale genome foundational models, we have collated and made available multi-species genome datasets for both pre-training of models (Sec. 4.1) and benchmarking (Sec. 4.2).
4.1 Pre-Train: Human and Multi-Species Genome
To investigate the impact of species diversity on genome foundation models, we compile and made publicly available two datasets for foundation model pre-training: the human genome and the multi-species genome. The human genome dataset is the one used in DNABERT (Ji et al., 2021), which comprises B nucleotide bases. The multi-species genome dataset encompasses genomes from species, spread across categories. In total, this dataset includes B nucleotide bases, nearly times the volume of the human genome dataset. We exclude all sequences with N and retain only sequences that consist of A, T, C, and G. Detailed statistics are presented in Table LABEL:tb:multi_species_details.
4.2 Benckmark: Genome Understanding Evaluation (GUE & GUE+)
| Species | Task | Num. Datasets | Num. Classes | Sequence Length |
| Human | Core Promoter Detection | 3 | 2 | 70 |
| Transcription Factor Prediction | 5 | 2 | 100 | |
| Promoter Detection | 3 | 2 | 300 | |
| Splice Site Detection | 1 | 3 | 400 | |
| Mouse | Transcription Factor Prediction | 5 | 2 | 100 |
| Yeast | Epigenetic Marks Prediction | 10 | 2 | 500 |
| Virus | Covid Variant Classification | 1 | 9 | 1000 |
| Species | Task | Num. Datasets | Num. Classes | Sequence Length |
| Human | Enhancer Promoter Interaction | 6 | 2 | 5000 |
| Fungi | Species Classification | 1 | 25 | 5000 |
| Virus | Species Classification | 1 | 20 | 10000 |
We introduce a large benchmark for genome foundation models. Due to the input length limits of existing genome foundation models, we split the benchmark into two parts: GUE and GUE+. GUE (See Table 1) includes genome sequence classification problems with datasets with input lengths ranging from to . GUE+ (See Table 2), on the other hand, focuses on relatively longer input sequences, rating from to . To evaluate the multi-species transferability in genome understanding of each model, this benchmarks contains tasks for various species, including human, fungi, virus, and yeast. We explicitly define evaluation metrics for each task and split each dataset into training, validation, and test data for a fair comparison across different models.
To calibrate the benchmark’s difficulty level and better illuminate each model’s capabilities, we carefully selected datasets that are neither too simple nor overly challenging for current models. For example, when the Nucleotide Transformer variants (Dalla-Torre et al., 2023) were tested on the Splice Site Prediction dataset, all variants achieved an accuracy between and . Similar outcomes were observed in tasks like Promoter Prediction and Enhancer Prediction. These high scores might suggest these variants perform similarly, but as our experiments in Section 5 show, they vary significantly on more discerning datasets.
The construction of the benchmark starts with the aggregation of various biologically important genome analysis datasets, followed by the assessment of existing models such as DNABERT (Ji et al., 2021) and Nucleotide Transformer (Dalla-Torre et al., 2023) on these datasets. Datasets where the majority of models yielded moderate (e.g., F1-scores between 0.3 and 0.8) and distinguishable performance scores were retained. On the other hand, datasets that did not meet these criteria underwent a restructuring process involving various strategies such as class balancing, adversarial sample inclusion, and reduction of training sample volume, among others. After several iterations of this process, we ultimately arrived at 36 representative datasets of moderate difficulty. Due to space limits, we present the detailed data processing and statistics of each dataset in Sec. LABEL:subsec:appen_data_gue.
5 Experiments
We evaluate DNABERT-2 using the proposed benchmark to thoroughly investigate its versatility and robustness across a variety of tasks involving multi-species genomes.
5.1 Baseline
We compare DNABERT-2 with two state-of-the-art genome foundation models: DNABERT (Ji et al., 2021) and Nucleotide Transformer (Dalla-Torre et al., 2023).
DNABERT was the first pre-trained foundational model for genome sequences, trained on human genome sequences. It has four variants, namely DNABERT (3-mer), DNABERT (4-mer), DNABERT (5-mer), and DNABERT (6-mer), which utilize overlapping -kmer tokenization respectively. While DNABERT employs the same architecture as BERT-base, it has a different vocabulary size, which is dependent on the chosen -mer.
Nucleotide Transformer (NT) scales up the data and model size to achieve state-of-the-art performance in DNA analysis tasks. It also has variants: NT-500M-human, NT-500M-1000g, NT-2500M-1000g, and NT-2500M-multi, where human, 1000g, and multi respectively refers to the GRCh38/hg38 human reference genome, 3202 high-coverage human genomes from the 1000 Genome project (Byrska-Bishop et al., 2021), and genome from 850 different species.
It is important to note that NT models are 6 to 29 times larger than DNABERT, which precludes standard model fine-tuning on consumer GPUs. Therefore, we perform standard fine-tuning for DNABERT and DNABERT-2, while adapting the Low-Rank Adaptation (LoRA) technique for fine-tuning the Nucleotide Transformer to enhance efficiency. For a fair comparison, we conducted preliminary experiments to confirm that our implementation of NT achieves comparable results to those reported in their original paper (Dalla-Torre et al., 2023) (see Appendix A.4 for more details).
5.2 Setup and Metric
We evaluate the models from two perspectives: computational efficiency and performance on downstream tasks. To measure each model’s computational cost, we consider the number of model parameters and the relative Floating Point Operations (FLOPs)—which is the total number of multiplication and addition operations during a forward pass—compared to DNABERT-2. We evaluate FLOPs on genome sequences with a length of 500, a commonly used setup in genome analysis. To measure model performance, we utilize F1-Score and Matthews Correlation Coefficient (MCC). We use different metrics for different tasks, following conventional practices (refer to Table LABEL:tb:gue_details for details). Table 3 presents the overall performance of each model on the GUE benchmark. It provides the average score of each model and the number of times it ranks in the top two among all models. The average results across all tasks are reported in Table 4, while task-specific results are presented in Table 6 due to space constraints. We also include statistics on the number of tokens each model processed during its pre-training phase, providing insight into the effects of training steps on model performance. For each model, we keep most of the hyperparameters (e.g., learning rate, batch size, weight decay, etc.) constant across all datasets, adjusting only the maximum sequence length and the number of training steps according to the specific dataset. Hyperparameter tuning tailored to each dataset is left for future work. Throughout the training process, we validate the model every 200 steps, save the model that yields the smallest loss on the validation set, and report its evaluation results on the test set. We train each model using three different random seeds and report the average results.
Further Pre-Training.
We also investigate the impact of additional in-domain pre-training on DNA language models. We combine the training sets of the 28 GUE datasets and further pre-train DNABERT-2 on this combined set. Following Sun et al. (2020), we train the model with a batch size of 32, a maximum sequence length of 128, and a learning rate of for 100,000 steps. This results in 0.41B training tokens, which only constitute 0.08% of the tokens processed during the entire training process of DNABERT-2.
5.3 Results on GUE
| Model | Params. | FLOPs | Trn. Tokens | Num. Top-2 | Ave. Scores |
| DNABERT (3-mer) | 86M | 3.27 | 122B | 2 0 | 61.62 |
| DNABERT (4-mer) | 86M | 3.26 | 122B | 0 1 | 61.14 |
| DNABERT (5-mer) | 87M | 3.26 | 122B | 0 1 | 60.05 |
| DNABERT (6-mer) | 89M | 3.25 | 122B | 0 1 | 60.51 |
| NT-500M-human | 480M | 3.19 | 50B | 0 0 | 55.43 |
| NT-500M-1000g | 480M | 3.19 | 50B | 0 1 | 58.23 |
| NT-2500M-1000g | 2537M | 19.44 | 300B | 0 1 | 61.41 |
| NT-2500M-multi | 2537M | 19.44 | 300B | 7 9 | 66.93 |
| DNABERT-2 | 117M | 1.00 | 262B | 8 4 | 66.80 |
| DNABERT-2 | 117M | 1.00 | 263B | 11 10 | 67.77 |
Table 3 outlines the statistics and aggregate performance of the models. As indicated in the table, despite being smaller and requiring fewer FLOPs, DNABERT-2 delivers a performance comparable to the state-of-the-art model while significantly surpassing other baselines. When DNABERT-2 undergoes additional pre-training on the GUE benchmark, which requires negligible computational overhead, it delivers the highest average performance and consistently ranks in the top two across the 28 tasks of the GUE benchmark. These results showcase the model’s remarkable efficiency and effectiveness.
Despite having 30% more parameters than DNABERT, DNABERT-2 requires only one-third the number of FLOPs. This indicates the superiority of the Byte Pair Encoding (BPE)-based tokenization method over overlapping k-mer tokenization in terms of modeling efficiency. Armed with the new tokenization method and the Attention with Linear Biases (ALiBi) module, DNABERT-2 can effectively process long genome sequences arbitrarily, demonstrating enhanced efficiency. This improvement becomes even more significant as the length of the input sequence increases. Moreover, DNABERT-2 consistently outperforms DNABERT by a large margin, indicating the effectiveness of multi-species pre-training and new model architecture.
Although DNABERT-2 is times smaller, it surpasses NT-500M while using fewer FLOPs. This underscores the importance of providing the model with adequate data, particularly when the model size is scaled up, and further highlights the inefficiency of overlapping k-mer tokenization. The comparison between DNABERT and NT-2500M-1000g exposes the sample inefficiency of non-overlapping k-mer tokenization. Despite being trained on times more tokens, NT-2500M-1000g achieves a performance similar to that of DNABERT.
| Species | Yeast | Mouse | Virus | Human | |||
| Task | EMP | TF-M | CVC | TF-H | PD | CPD | SSP |
| DNABERT (3-mer) | 49.54 | 57.73 | 62.23 | 64.43 | 84.63 | 72.96 | 84.14 |
| DNABERT (4-mer) | 48.59 | 59.58 | 59.87 | 64.41 | 82.99 | 71.10 | 84.05 |
| DNABERT (5-mer) | 48.62 | 54.85 | 63.64 | 50.46 | 84.04 | 72.03 | 84.02 |
| DNABERT (6-mer) | 49.10 | 56.43 | 55.50 | 64.17 | 81.70 | 71.81 | 84.07 |
| NT-500M-human | 45.35 | 45.24 | 57.13 | 50.82 | 85.51 | 66.54 | 79.71 |
| NT-500M-1000g | 47.68 | 49.31 | 52.06 | 58.92 | 86.58 | 69.13 | 80.97 |
| NT-2500M-1000g | 50.86 | 56.82 | 66.73 | 61.99 | 86.61 | 68.17 | 85.78 |
| NT-2500M-multi | 58.06 | 67.01 | 73.04 | 63.32 | 88.14 | 71.62 | 89.36 |
| DNABERT-2 | 55.98 | 67.99 | 71.02 | 70.10 | 84.21 | 70.52 | 84.99 |
| DNABERT-2 | 58.83 | 71.21 | 68.49 | 66.84 | 83.81 | 71.07 | 85.93 |
The averaged results for each task are displayed in Table 4. DNABERT-2 and NT-2500M-multi consistently achieve top-tier performance across most tasks. Their dominance over other baselines is particularly notable in non-human genome analysis tasks, demonstrating the effectiveness of multi-species genomes pre-training. Furthermore, models trained on multi-species genomes also show strong performance on human genome analysis tasks, proving their ability to develop a comprehensive understanding of multi-species genomes without compromising their grasp of the human genome. We also observe that additional pre-training does not uniformly enhance all tasks, indicating that task-specific further pre-training might be necessary when addressing a certain downstream task.
Additionally, DNABERT variants achieve optimal performance in the Core Promoter Detection task, where inputs are sequences of length . However, their performance diminishes in the similar task of Promoter Detection, where the input length increases to . These results highlight a common challenge associated with non-overlapping k-mer tokenization and BPE-based tokenization: the capacity to identify subtle signals from limited input. Although inefficient, the overlapping k-mer tokenization adopted by DNABERT retains most of the information in the original sequences. In contrast, the sequence length is significantly reduced (i.e., from to ) with non-overlapping k-mer and BPE tokenization, which might limit the retained information and hinder informed decision-making. This identifies a critical area for future exploration in DNA language models.
5.4 Results on GUE+
| Task | SC (Fungi) | SC (Virus) | EPI (Human) | |||||
| Dataset | 0 | 1 | 2 | 3 | 4 | 5 | ||
| DNABERT (6-mer) | 89.29 | 44.51 | - | - | - | - | - | - |
| NT-2500M-multi | 92.85 | 45.00 | 61.91 | 72.15 | 73.13 | 79.49 | 86.48 | 68.64 |
| DNABERT-2 | 93.04 | 48.50 | 76.21 | 79.19 | 83.50 | 86.71 | 92.90 | 73.70 |
In this section, we further compare DNABERT-2 with DNABERT and Nucleotide Transformers on the GUE+ benchmark. The input size of datasets in GUE+ ranges from to . For DNABERT, due to its 512 input limitation, we follow its origin setting by splitting the input into 512bp-len pieces, generating embedding independently, and feeding the averaged embedding to the output layer. Table 5 shows DNABERT, Nucleotide Transformer, and DNABERT-2’s performance on the GUE+ benchmark. As shown in the table, DNABERT-2 consistently outperforms the baselines on all the datasets, showing its good capability in handling long DNA sequences. Notably, despite DNABERT-2 is pre-trained purely on 700bp-len sequences, it performs well even on 10000-bp sequences with a few epochs of fine-tuning, indicating DNABERT-2’s extrapolation capability offered by ALiBi.
6 Conclusion
In this paper, we introduce DNABERT-2, an efficient foundational model pre-trained on multi-species genomes. We identify the computational and sample inefficiencies of the existing k-mer tokenization method and propose the adaptation of Byte Pair Encoding (BPE) for DNA language modeling. We provide insightful and comprehensive empirical analyses, building DNABERT-2 based on these findings. Moreover, we integrate several techniques such as Attention with Linear Biases (ALiBi) and Low-Rank Adaptation (LoRA) to address the limitations of current DNA language models. We also compile and introduce the Genome Understanding Evaluation, a benchmark for multi-species genome analysis comprising tasks and datasets with well-defined data split, evaluation metrics, and elaborately calibrated difficulty. Empirical analysis on the GUE benchmark shows that DNABERT-2 achieves comparable performance as the SOTA models while being much more efficient. For future work, we are interested in effective modeling strategies for short and extra-long genome sequences and the introduction of training targets and data processing/augmentation methods that leverage the unique double-strand structure of DNA.
Acknowledge
This work is supported by NIH R01LM01372201.
References
- Avsec et al. (2021) Žiga Avsec, Vikram Agarwal, Daniel Visentin, Joseph R Ledsam, Agnieszka Grabska-Barwinska, Kyle R Taylor, Yannis Assael, John Jumper, Pushmeet Kohli, and David R Kelley. Effective gene expression prediction from sequence by integrating long-range interactions. Nature methods, 18(10):1196–1203, 2021.
- Benson et al. (2012) Dennis A Benson, Mark Cavanaugh, Karen Clark, Ilene Karsch-Mizrachi, David J Lipman, James Ostell, and Eric W Sayers. Genbank. Nucleic acids research, 41(D1):D36–D42, 2012.
- Bommasani et al. (2022) Rishi Bommasani, Drew A. Hudson, Ehsan Adeli, Russ Altman, Simran Arora, Sydney von Arx, Michael S. Bernstein, Jeannette Bohg, Antoine Bosselut, Emma Brunskill, Erik Brynjolfsson, Shyamal Buch, Dallas Card, Rodrigo Castellon, Niladri Chatterji, Annie Chen, Kathleen Creel, Jared Quincy Davis, Dora Demszky, Chris Donahue, Moussa Doumbouya, Esin Durmus, Stefano Ermon, John Etchemendy, Kawin Ethayarajh, Li Fei-Fei, Chelsea Finn, Trevor Gale, Lauren Gillespie, Karan Goel, Noah Goodman, Shelby Grossman, Neel Guha, Tatsunori Hashimoto, Peter Henderson, John Hewitt, Daniel E. Ho, Jenny Hong, Kyle Hsu, Jing Huang, Thomas Icard, Saahil Jain, Dan Jurafsky, Pratyusha Kalluri, Siddharth Karamcheti, Geoff Keeling, Fereshte Khani, Omar Khattab, Pang Wei Koh, Mark Krass, Ranjay Krishna, Rohith Kuditipudi, Ananya Kumar, Faisal Ladhak, Mina Lee, Tony Lee, Jure Leskovec, Isabelle Levent, Xiang Lisa Li, Xuechen Li, Tengyu Ma, Ali Malik, Christopher D. Manning, Suvir Mirchandani, Eric Mitchell, Zanele Munyikwa, Suraj Nair, Avanika Narayan, Deepak Narayanan, Ben Newman, Allen Nie, Juan Carlos Niebles, Hamed Nilforoshan, Julian Nyarko, Giray Ogut, Laurel Orr, Isabel Papadimitriou, Joon Sung Park, Chris Piech, Eva Portelance, Christopher Potts, Aditi Raghunathan, Rob Reich, Hongyu Ren, Frieda Rong, Yusuf Roohani, Camilo Ruiz, Jack Ryan, Christopher Ré, Dorsa Sadigh, Shiori Sagawa, Keshav Santhanam, Andy Shih, Krishnan Srinivasan, Alex Tamkin, Rohan Taori, Armin W. Thomas, Florian Tramèr, Rose E. Wang, William Wang, Bohan Wu, Jiajun Wu, Yuhuai Wu, Sang Michael Xie, Michihiro Yasunaga, Jiaxuan You, Matei Zaharia, Michael Zhang, Tianyi Zhang, Xikun Zhang, Yuhui Zhang, Lucia Zheng, Kaitlyn Zhou, and Percy Liang. On the opportunities and risks of foundation models, 2022.
- Byrska-Bishop et al. (2021) Marta Byrska-Bishop, Uday S. Evani, Xuefang Zhao, Anna O. Basile, Haley J. Abel, Allison A. Regier, André Corvelo, Wayne E. Clarke, Rajeeva Musunuri, Kshithija Nagulapalli, Susan Fairley, Alexi Runnels, Lara Winterkorn, Ernesto Lowy-Gallego, The Human Genome Structural Variation Consortium, Paul Flicek, Soren Germer, Harrison Brand, Ira M. Hall, Michael E. Talkowski, Giuseppe Narzisi, and Michael C. Zody. High coverage whole genome sequencing of the expanded 1000 genomes project cohort including 602 trios. bioRxiv, 2021. doi: 10.1101/2021.02.06.430068. URL https://www.biorxiv.org/content/early/2021/02/07/2021.02.06.430068.
- Chen et al. (2022) Ken Chen, Huiying Zhao, and Yuedong Yang. Capturing large genomic contexts for accurately predicting enhancer-promoter interactions. Brief. Bioinform., 23(2), March 2022.
- Consortium et al. (2012) ENCODE Project Consortium et al. An integrated encyclopedia of dna elements in the human genome. Nature, 489(7414):57, 2012.
- Dalla-Torre et al. (2023) Hugo Dalla-Torre, Liam Gonzalez, Javier Mendoza-Revilla, Nicolas Lopez Carranza, Adam Henryk Grzywaczewski, Francesco Oteri, Christian Dallago, Evan Trop, Hassan Sirelkhatim, Guillaume Richard, Marcin Skwark, Karim Beguir, Marie Lopez, and Thomas Pierrot. The nucleotide transformer: Building and evaluating robust foundation models for human genomics. bioRxiv, 2023. doi: 10.1101/2023.01.11.523679. URL https://www.biorxiv.org/content/early/2023/03/09/2023.01.11.523679.
- Dao et al. (2022) Tri Dao, Daniel Y. Fu, Stefano Ermon, Atri Rudra, and Christopher Ré. Flashattention: Fast and memory-efficient exact attention with io-awareness, 2022.
- Dauphin et al. (2017) Yann N. Dauphin, Angela Fan, Michael Auli, and David Grangier. Language modeling with gated convolutional networks. In Proceedings of the 34th International Conference on Machine Learning - Volume 70, ICML’17, pp. 933–941. JMLR.org, 2017.
- Dreos et al. (2013) René Dreos, Giovanna Ambrosini, Rouayda Cavin Périer, and Philipp Bucher. Epd and epdnew, high-quality promoter resources in the next-generation sequencing era. Nucleic acids research, 41(D1):D157–D164, 2013.
- Grešová et al. (2023) Katarína Grešová, Vlastimil Martinek, David Čechák, Petr Šimeček, and Panagiotis Alexiou. Genomic benchmarks: a collection of datasets for genomic sequence classification. BMC Genomic Data, 24(1):25, 2023.
- Hu et al. (2021) Edward J. Hu, Yelong Shen, Phillip Wallis, Zeyuan Allen-Zhu, Yuanzhi Li, Shean Wang, Lu Wang, and Weizhu Chen. Lora: Low-rank adaptation of large language models, 2021.
- Ji et al. (2021) Yanrong Ji, Zhihan Zhou, Han Liu, and Ramana V Davuluri. Dnabert: pre-trained bidirectional encoder representations from transformers model for dna-language in genome. Bioinformatics, 37(15):2112–2120, 2021.
- Jin et al. (2022) Junru Jin, Yingying Yu, Ruheng Wang, Xin Zeng, Chao Pang, Yi Jiang, Zhongshen Li, Yutong Dai, Ran Su, Quan Zou, Kenta Nakai, and Leyi Wei. iDNA-ABF: multi-scale deep biological language learning model for the interpretable prediction of DNA methylations. Genome Biol., 23(1):219, October 2022.
- Kenton & Toutanova (2019) Jacob Devlin Ming-Wei Chang Kenton and Lee Kristina Toutanova. Bert: Pre-training of deep bidirectional transformers for language understanding. In Proceedings of NAACL-HLT, pp. 4171–4186, 2019.
- Khare et al. (2021) Shruti Khare, Céline Gurry, Lucas Freitas, Mark B Schultz, Gunter Bach, Amadou Diallo, Nancy Akite, Joses Ho, Raphael TC Lee, Winston Yeo, et al. Gisaid’s role in pandemic response. China CDC weekly, 3(49):1049, 2021.
- Kudo & Richardson (2018) Taku Kudo and John Richardson. Sentencepiece: A simple and language independent subword tokenizer and detokenizer for neural text processing, 2018.
- Le et al. (2022) Nguyen Quoc Khanh Le, Quang-Thai Ho, Van-Nui Nguyen, and Jung-Su Chang. Bert-promoter: An improved sequence-based predictor of dna promoter using bert pre-trained model and shap feature selection. Computational Biology and Chemistry, 99:107732, 2022.
- Lee et al. (2022) Dohoon Lee, Jeewon Yang, and Sun Kim. Learning the histone codes with large genomic windows and three-dimensional chromatin interactions using transformer. Nature Communications, 13(1):6678, 2022.
- Li et al. (2023) Zhongxiao Li, Elva Gao, Juexiao Zhou, Wenkai Han, Xiaopeng Xu, and Xin Gao. Applications of deep learning in understanding gene regulation. Cell Reports Methods, 3(1):100384, 2023. ISSN 2667-2375. doi: https://doi.org/10.1016/j.crmeth.2022.100384. URL https://www.sciencedirect.com/science/article/pii/S2667237522002892.
- Loshchilov & Hutter (2019) Ilya Loshchilov and Frank Hutter. Decoupled weight decay regularization, 2019.
- Nguyen et al. (2024) Eric Nguyen, Michael Poli, Marjan Faizi, Armin Thomas, Michael Wornow, Callum Birch-Sykes, Stefano Massaroli, Aman Patel, Clayton Rabideau, Yoshua Bengio, et al. Hyenadna: Long-range genomic sequence modeling at single nucleotide resolution. Advances in neural information processing systems, 36, 2024.
- Ni et al. (2022) Yu Ni, Linqi Fan, Miao Wang, Ning Zhang, Yongchun Zuo, and Mingzhi Liao. EPI-Mind: Identifying enhancer-promoter interactions based on transformer mechanism. Interdiscip. Sci., 14(3):786–794, September 2022.
- OpenAI (2023) OpenAI. Gpt-4 technical report, 2023.
- Ouyang et al. (2022) Long Ouyang, Jeff Wu, Xu Jiang, Diogo Almeida, Carroll L. Wainwright, Pamela Mishkin, Chong Zhang, Sandhini Agarwal, Katarina Slama, Alex Ray, John Schulman, Jacob Hilton, Fraser Kelton, Luke Miller, Maddie Simens, Amanda Askell, Peter Welinder, Paul Christiano, Jan Leike, and Ryan Lowe. Training language models to follow instructions with human feedback, 2022.
- Press et al. (2021) Ofir Press, Noah A Smith, and Mike Lewis. Train short, test long: Attention with linear biases enables input length extrapolation. arXiv preprint arXiv:2108.12409, 2021.
- Raffel et al. (2020) Colin Raffel, Noam Shazeer, Adam Roberts, Katherine Lee, Sharan Narang, Michael Matena, Yanqi Zhou, Wei Li, and Peter J Liu. Exploring the limits of transfer learning with a unified text-to-text transformer. The Journal of Machine Learning Research, 21(1):5485–5551, 2020.
- Rozowsky et al. (2023) Joel Rozowsky, Jiahao Gao, Beatrice Borsari, Yucheng T Yang, Timur Galeev, Gamze Gürsoy, Charles B Epstein, Kun Xiong, Jinrui Xu, Tianxiao Li, Jason Liu, Keyang Yu, Ana Berthel, Zhanlin Chen, Fabio Navarro, Maxwell S Sun, James Wright, Justin Chang, Christopher J F Cameron, Noam Shoresh, Elizabeth Gaskell, Jorg Drenkow, Jessika Adrian, Sergey Aganezov, François Aguet, Gabriela Balderrama-Gutierrez, Samridhi Banskota, Guillermo Barreto Corona, Sora Chee, Surya B Chhetri, Gabriel Conte Cortez Martins, Cassidy Danyko, Carrie A Davis, Daniel Farid, Nina P Farrell, Idan Gabdank, Yoel Gofin, David U Gorkin, Mengting Gu, Vivian Hecht, Benjamin C Hitz, Robbyn Issner, Yunzhe Jiang, Melanie Kirsche, Xiangmeng Kong, Bonita R Lam, Shantao Li, Bian Li, Xiqi Li, Khine Zin Lin, Ruibang Luo, Mark Mackiewicz, Ran Meng, Jill E Moore, Jonathan Mudge, Nicholas Nelson, Chad Nusbaum, Ioann Popov, Henry E Pratt, Yunjiang Qiu, Srividya Ramakrishnan, Joe Raymond, Leonidas Salichos, Alexandra Scavelli, Jacob M Schreiber, Fritz J Sedlazeck, Lei Hoon See, Rachel M Sherman, Xu Shi, Minyi Shi, Cricket Alicia Sloan, J Seth Strattan, Zhen Tan, Forrest Y Tanaka, Anna Vlasova, Jun Wang, Jonathan Werner, Brian Williams, Min Xu, Chengfei Yan, Lu Yu, Christopher Zaleski, Jing Zhang, Kristin Ardlie, J Michael Cherry, Eric M Mendenhall, William S Noble, Zhiping Weng, Morgan E Levine, Alexander Dobin, Barbara Wold, Ali Mortazavi, Bing Ren, Jesse Gillis, Richard M Myers, Michael P Snyder, Jyoti Choudhary, Aleksandar Milosavljevic, Michael C Schatz, Bradley E Bernstein, Roderic Guigó, Thomas R Gingeras, and Mark Gerstein. The EN-TEx resource of multi-tissue personal epigenomes & variant-impact models. Cell, 186(7):1493–1511.e40, March 2023.
- Sennrich et al. (2016) Rico Sennrich, Barry Haddow, and Alexandra Birch. Neural machine translation of rare words with subword units. In Proceedings of the 54th Annual Meeting of the Association for Computational Linguistics (Volume 1: Long Papers), pp. 1715–1725, Berlin, Germany, August 2016. Association for Computational Linguistics. doi: 10.18653/v1/P16-1162. URL https://aclanthology.org/P16-1162.
- Shazeer (2020) Noam Shazeer. Glu variants improve transformer, 2020.
- Smith et al. (2023) Gabrielle D Smith, Wan Hern Ching, Paola Cornejo-Páramo, and Emily S Wong. Decoding enhancer complexity with machine learning and high-throughput discovery. Genome Biol., 24(1):116, May 2023.
- Stamatoyannopoulos et al. (2012) John A Stamatoyannopoulos, Michael Snyder, Ross Hardison, Bing Ren, Thomas Gingeras, David M Gilbert, Mark Groudine, Michael Bender, Rajinder Kaul, Theresa Canfield, et al. An encyclopedia of mouse dna elements (mouse encode). Genome biology, 13(8):1–5, 2012.
- Su et al. (2021) Jianlin Su, Yu Lu, Shengfeng Pan, Ahmed Murtadha, Bo Wen, and Yunfeng Liu. Roformer: Enhanced transformer with rotary position embedding. arXiv preprint arXiv:2104.09864, 2021.
- Sun et al. (2020) Chi Sun, Xipeng Qiu, Yige Xu, and Xuanjing Huang. How to fine-tune bert for text classification?, 2020.
- Team (2021) The Mosaic ML Team. composer. https://github.com/mosaicml/composer/, 2021.
- Theodoris et al. (2023) Christina V Theodoris, Ling Xiao, Anant Chopra, Mark D Chaffin, Zeina R Al Sayed, Matthew C Hill, Helene Mantineo, Elizabeth M Brydon, Zexian Zeng, X Shirley Liu, and Patrick T Ellinor. Transfer learning enables predictions in network biology. Nature, 618(7965):616–624, June 2023.
- Vaswani et al. (2017) Ashish Vaswani, Noam Shazeer, Niki Parmar, Jakob Uszkoreit, Llion Jones, Aidan N Gomez, Łukasz Kaiser, and Illia Polosukhin. Attention is all you need. Advances in neural information processing systems, 30, 2017.
- Wang et al. (2019) Ruohan Wang, Zishuai Wang, Jianping Wang, and Shuaicheng Li. Splicefinder: ab initio prediction of splice sites using convolutional neural network. BMC bioinformatics, 20:1–13, 2019.
- Wang et al. (2022) Zixuan Wang, Yongqing Zhang, Yuhang Liu, Shuwen Xiong, Maocheng Wang, Jiliu Zhou, and Meiqin Gong. Towards a better understanding of tf-dna binding prediction from genomic features. Computers in Biology and Medicine, pp. 105993, 2022.
- Wolf et al. (2020) Thomas Wolf, Lysandre Debut, Victor Sanh, Julien Chaumond, Clement Delangue, Anthony Moi, Pierric Cistac, Tim Rault, Rémi Louf, Morgan Funtowicz, Joe Davison, Sam Shleifer, Patrick von Platen, Clara Ma, Yacine Jernite, Julien Plu, Canwen Xu, Teven Le Scao, Sylvain Gugger, Mariama Drame, Quentin Lhoest, and Alexander M. Rush. Transformers: State-of-the-art natural language processing. In Proceedings of the 2020 Conference on Empirical Methods in Natural Language Processing: System Demonstrations, pp. 38–45, Online, October 2020. Association for Computational Linguistics. URL https://www.aclweb.org/anthology/2020.emnlp-demos.6.
- Zhang et al. (2022) Pengyu Zhang, Hongming Zhang, and Hao Wu. ipro-wael: a comprehensive and robust framework for identifying promoters in multiple species. Nucleic Acids Research, 50(18):10278–10289, 2022.
Appendix A Experiments
A.1 All Experiment Results
| Epigenetic Marks Prediction | ||||||
| H3 | H3K14ac | H3K36me3 | H3K4me1 | H3K4me2 | H3K4me3 | |
| DNABERT (3-mer) | 74.15 | 42.07 | 48.49 | 42.95 | 31.34 | 28.92 |
| DNABERT (4-mer) | 73.03 | 41.88 | 48.03 | 41.06 | 30.66 | 25.31 |
| DNABERT (5-mer) | 73.40 | 40.68 | 48.29 | 40.65 | 30.67 | 27.10 |
| DNABERT (6-mer) | 73.10 | 40.06 | 47.25 | 41.44 | 32.27 | 27.81 |
| NT-500M-human | 69.67 | 33.55 | 44.14 | 37.15 | 30.87 | 24.06 |
| NT-500M-1000g | 72.52 | 39.37 | 45.58 | 40.45 | 31.05 | 26.16 |
| NT-2500M-1000g | 74.61 | 44.08 | 50.86 | 43.10 | 30.28 | 30.87 |
| NT-2500M-multi | 78.77 | 56.20 | 61.99 | 55.30 | 36.49 | 40.34 |
| DNABERT-2 | 78.27 | 52.57 | 56.88 | 50.52 | 31.13 | 36.27 |
| DNABERT-2 | 80.17 | 57.42 | 61.90 | 53.00 | 39.89 | 41.20 |
| Epigenetic Marks Prediction | Promoter Detection | ||||||
| H3K79me3 | H3K9ac | H4 | H4ac | all | notata | tata | |
| DNABERT (3-mer) | 60.12 | 50.48 | 78.27 | 38.60 | 90.44 | 93.61 | 69.83 |
| DNABERT (4-mer) | 59.77 | 51.44 | 78.28 | 36.40 | 89.54 | 92.65 | 66.78 |
| DNABERT (5-mer) | 59.61 | 51.11 | 77.27 | 37.48 | 90.16 | 92.45 | 69.51 |
| DNABERT (6-mer) | 61.17 | 51.22 | 79.26 | 37.43 | 90.48 | 93.05 | 61.56 |
| NT-500M-human | 58.35 | 45.81 | 76.17 | 33.74 | 87.71 | 90.75 | 78.07 |
| NT-500M-1000g | 59.33 | 49.29 | 76.29 | 36.79 | 89.76 | 91.75 | 78.23 |
| NT-2500M-1000g | 61.20 | 52.36 | 79.76 | 41.46 | 90.95 | 93.07 | 75.80 |
| NT-2500M-multi | 64.70 | 56.01 | 81.67 | 49.13 | 91.01 | 94.00 | 79.43 |
| DNABERT-2 | 67.39 | 55.63 | 80.71 | 50.43 | 86.77 | 94.27 | 71.59 |
| DNABERT-2 | 65.46 | 57.07 | 81.86 | 50.35 | 88.31 | 94.34 | 68.79 |
| Transcription Factor Prediction (Human) | Core Promoter Detection | |||||||
| 0 | 1 | 2 | 3 | 4 | all | notata | tata | |
| DNABERT (3-mer) | 67.95 | 70.90 | 60.51 | 53.03 | 69.76 | 70.92 | 69.82 | 78.15 |
| DNABERT (4-mer) | 67.90 | 73.05 | 59.52 | 50.37 | 71.23 | 69.00 | 70.04 | 74.25 |
| DNABERT (5-mer) | 66.97 | 69.98 | 59.03 | 52.95 | 69.26 | 69.48 | 69.81 | 76.79 |
| DNABERT (6-mer) | 66.84 | 70.14 | 61.03 | 51.89 | 70.97 | 68.90 | 70.47 | 76.06 |
| NT-500M-human | 61.59 | 66.75 | 53.58 | 42.95 | 60.81 | 63.45 | 64.82 | 71.34 |
| NT-500M-1000g | 63.64 | 70.17 | 52.73 | 45.24 | 62.82 | 66.70 | 67.17 | 73.52 |
| NT-2500M-1000g | 66.31 | 68.30 | 58.70 | 49.08 | 67.59 | 67.39 | 67.46 | 69.66 |
| NT-2500M-multi | 66.64 | 70.28 | 58.72 | 51.65 | 69.34 | 70.33 | 71.58 | 72.97 |
| DNABERT-2 | 71.99 | 76.06 | 66.52 | 58.54 | 77.43 | 69.37 | 68.04 | 74.17 |
| DNABERT-2 | 69.12 | 71.87 | 62.96 | 55.35 | 74.94 | 67.50 | 69.53 | 76.18 |
| Transcription Factor Prediction (Mouse) | Virus | Splice | |||||
| 0 | 1 | 2 | 3 | 4 | Covid | Reconstruct | |
| DNABERT (3-mer) | 42.31 | 79.10 | 69.90 | 55.40 | 41.97 | 62.23 | 84.14 |
| DNABERT (4-mer) | 49.42 | 79.95 | 72.62 | 51.79 | 44.13 | 59.87 | 84.05 |
| DNABERT (5-mer) | 42.45 | 79.32 | 62.22 | 49.92 | 40.34 | 50.46 | 84.02 |
| DNABERT (6-mer) | 44.42 | 78.94 | 71.44 | 44.89 | 42.48 | 55.50 | 84.07 |
| NT-500M-human | 31.04 | 75.04 | 61.67 | 29.17 | 29.27 | 50.82 | 79.71 |
| NT-500M-1000g | 39.26 | 75.49 | 64.70 | 33.07 | 34.01 | 52.06 | 80.97 |
| NT-2500M-1000g | 48.31 | 80.02 | 70.14 | 42.25 | 43.40 | 66.73 | 85.78 |
| NT-2500M-multi | 63.31 | 83.76 | 71.52 | 69.44 | 47.07 | 73.04 | 89.35 |
| DNABERT-2 | 56.76 | 84.77 | 79.32 | 66.47 | 52.66 | 71.02 | 84.99 |
| DNABERT-2 | 64.23 | 86.28 | 81.28 | 73.49 | 50.80 | 68.49 | 85.93 |
Table 6 presents the evaluation results of DNABERT-2 and baselines on the GUE benchmark.
A.2 Implementation
We pre-train DNABERT-2 with the Masked Language Modeling (MLM) loss with a mask ratio of . Notably, we independently mask every token instead of masking spans of continuous tokens like Ji et al. (2021). We use a batch size of and a max sequence length of . We train the model for steps using the AdamW (Loshchilov & Hutter, 2019) optimizer with , , and weight decay of . The learning rate linearly increases from to during the first steps while linearly decreasing to in the last steps.
A.3 Hyperparameters
This section presents the hyperparameters we used in the fine-tuning stage on each model. Table 7 shows the number of training steps we used for each task. We use AdamW (Loshchilov & Hutter, 2019) as optimizer. We keep most of the other hyperparameters the same for all the models across all the datasets, including a batch size of , a warmup step of , and a weight decay of . For DNABERT and DNABERT-2, we perform standard fine-tuning with a learning rate of , while for the Nucleotide Transformers, we perform parameter efficient fine-tuning (PEFT) using Low-Rank Adaptation (LoRA) with a learning rate of , a LoRA alpha of , a LoRA dropout of , and a LoRA of . The hyperparameters are selected based on grid searches over commonly used ones in preliminary experiments. The pre-training stage takes approximately 14 days using eight Nvidia RTX 2080Ti GPUs. To train the model, we used the Transformers library (Wolf et al., 2020) and the Composer library (Team, 2021).
| EMP | TF-M | CVC | TF-H | PD-tata | PD-o | CPD-tata | CPD-o | SSP | |
| Epochs | 3 | 1k | 8 | 3 | 10 | 4 | 10 | 4 | 5 |
A.4 Preliminary Experiments on Nucleotide Transformer
Since there is no official fine-tuning code of Nucleotide Transformer (Dalla-Torre et al., 2023), we use its open-sourced checkpoints in Huggingface Modelhub222https://huggingface.co/InstaDeepAI and train it with our code base using LoRA. For a fair comparison with this model, in this section, we present preliminary experiments that compare the results reported in their paper with the performance of this model under our implementation. We select the epigenetic marks prediction task for benchmarking since it is the only shared task among Dalla-Torre et al. (2023) and GUE. The task contains datasets. For each dataset, we randomly split it into training and test sets with a ratio of 9:1. As shown in Table 8, our LoRA implementation leads to slightly better results than the results reported in the original paper, making our comparison to the model fair and convincing despite the fact that we do not have access to its official fine-tuning implementation.
| H3 | H3K14ac | H3K36me3 | H3K4me1 | H3K4me2 | H3K4me3 | |
| 500M-human* | 72.00 | 37.00 | 45.00 | 36.00 | 27.00 | 24.00 |
| 500M-human | 69.67 | 33.55 | 44.14 | 37.15 | 30.87 | 24.06 |
| 500M-1000g* | 74.00 | 38.00 | 47.00 | 38.00 | 26.00 | 24.00 |
| 500M-1000g | 72.52 | 39.37 | 45.58 | 40.45 | 31.05 | 26.16 |
| 2500M-1000g* | 75.00 | 45.00 | 53.00 | 42.00 | 28.00 | 31.00 |
| 2500M-1000g | 74.61 | 44.08 | 50.86 | 43.10 | 30.28 | 30.87 |
| 2500M-multi* | 79.00 | 54.00 | 62.00 | 54.00 | 32.00 | 41.00 |
| 2500M-multi | 78.77 | 56.20 | 61.99 | 55.30 | 36.49 | 40.34 |
| H3K79me3 | H3K9ac | H4 | H4ac | Average | |
| 500M-human* | 57.00 | 45.00 | 75.00 | 33.00 | 45.10 |
| 500M-human | 58.35 | 45.81 | 76.17 | 33.74 | 45.35 |
| 500M-1000g* | 56.00 | 48.00 | 76.00 | 34.00 | 46.10 |
| 500M-1000g | 59.33 | 49.29 | 76.29 | 36.79 | 47.68 |
| 2500M-1000g* | 57.00 | 49.00 | 79.00 | 41.00 | 50.00 |
| 2500M-1000g | 61.20 | 52.36 | 79.76 | 41.46 | 50.86 |
| 2500M-multi* | 62.00 | 55.00 | 81.00 | 49.00 | 56.90 |
| 2500M-multi | 64.70 | 56.01 | 81.67 | 49.13 | 58.06 |
A.5 Comparing DNABERT-2 with other baselines
We also compare DNABERT-2 with other baselines, including HyenaDNA (Nguyen et al., 2024), a convolutional neural network (CNN) designed for DNA classification by Grešová et al. (2023), and DNABERT-2 model without pre-training. We implement HyenaDNA with their official implementation https://huggingface.co/LongSafari/hyenadna-medium-450k-seqlen-hf on HuggingFace and Huggingface Trainer. We implement CNN with official code on GitHub. For both papers, we use the default hyperparameter described in the papers, and we follow our own evaluation setting (e.g., use the same set of hyperparameters across all the datasets and test on the checkpoint with the lowest validation loss).
As shown in Table 9, DNABERT-2 consistently outperforms the baselines. We note that using the official checkpoint of HyenaDNA on Huggingface does not achieve the same level of performance on the EMP task as reported in their paper. This could be due to multiple reasons: 1) the reported results are not based on the open-source checkpoints, 2) the Huggingface trainer does not train the model properly, and 3) more careful hyperparameter searches are needed.
| Epigenetic Marks Prediction | ||||||
| H3 | H3K14ac | H3K36me3 | H3K4me1 | H3K4me2 | H3K4me3 | |
| HyenaDNA | 67.17 | 31.98 | 48.27 | 35.83 | 25.81 | 23.15 |
| CNN | 61.52 | 29.73 | 38.60 | 26.06 | 25.76 | 20.52 |
| DNABERT-2 w/o PT | 57.36 | 32.25 | 38.07 | 23.80 | 28.57 | 18.12 |
| DNABERT-2 | 78.27 | 52.57 | 56.88 | 50.52 | 31.13 | 36.27 |
| Epigenetic Marks Prediction | Promoter Detection | ||||||
| H3K79me3 | H3K9ac | H4 | H4ac | all | notata | tata | |
| HyenaDNA | 54.09 | 50.84 | 73.69 | 38.44 | 47.38 | 52.24 | 5.34 |
| CNN | 46.30 | 40.03 | 62.34 | 25.54 | 75.78 | 85.14 | 70.30 |
| DNABERT-2 w/o PT | 51.71 | 44.38 | 66.73 | 30.07 | 76.49 | 84.07 | 34.11 |
| DNABERT-2 | 67.39 | 55.63 | 80.71 | 50.43 | 86.77 | 94.27 | 71.59 |
| Transcription Factor Prediction (Human) | Core Promoter Detection | |||||||
| 0 | 1 | 2 | 3 | 4 | all | notata | tata | |
| HyenaDNA | 62.3 | 67.86 | 46.85 | 41.78 | 61.23 | 36.95 | 35.38 | 72.87 |
| CNN | 53.95 | 63.20 | 45.22 | 29.84 | 61.48 | 58.07 | 60.09 | 69.33 |
| DNABERT-2 w/o PT | 59.35 | 59.27 | 46.13 | 31.36 | 60.14 | 54.58 | 58.26 | 47.15 |
| DNABERT-2 | 84.38 | 87.16 | 83.99 | 79.85 | 87.80 | 69.47 | 68.04 | 74.17 |
| Transcription Factor Prediction (Mouse) | Virus | Splice | |||||
| 0 | 1 | 2 | 3 | 4 | Covid | Reconstruct | |
| HyenaDNA | 35.62 | 80.50 | 65.34 | 54.20 | 19.17 | 23.27 | 72.67 |
| CNN 0 | 31.14 | 59.74 | 63.15 | 45.48 | 27.18 | 22.23 | 76.79 |
| DNABERT-2 w/o PT | 30.55 | 63.74 | 59.92 | 24.12 | 27.20 | 69.76 | 46.80 |
| DNABERT-2 | 81.60 | 92.67 | 92.38 | 84.91 | 76.10 | 71.02 | 84.99 |
A.6 Ablation Study on Tokenization Method
In this section, we present an ablation study on the tokenization method: the overlapping K-mer tokenization used in DNABERT v.s. the BPE tokenization used in DNABERT-2. We train two DNABERT-2 variants on the same training data and with the same model architecture and hyperparameters. We use a batch size of , max sequence length of , and train each model for steps. Since the vocab size of BPE is 4096, to keep the number of parameters similar enough, we use 6-mer tokenization, which results in 4101 tokens. We then evaluate the two variants on the GUE benchmark. Table 10 presents the results. As shown in the Table, the variant trained with the BPE tokenizer outperforms the K-mer counterparts on 21 out of 28 datasets, with an average score of 65.33 and 60.92, respectively. As a result, we empirically show that BPE leads to better performance than k-mer after being pre-trained and finetuned with the same data, architecture, and hyperparameters, showing its data efficiency. Also, as shown in Table 6 of the paper, BPE also leads to 3-4 times less computational costs than K-mer.
| Epigenetic Marks Prediction | ||||||
| Tokenizer | H3 | H3K14ac | H3K36me3 | H3K4me1 | H3K4me2 | H3K4me3 |
| K-mer | 74.62 | 42.71 | 47.26 | 39.66 | 25.33 | 27.43 |
| BPE | 77.08 | 55.60 | 57.25 | 45.51 | 40.83 | 42.57 |
| Epigenetic Marks Prediction | Promoter Detection | ||||||
| Tokenizer | H3K79me3 | H3K9ac | H4 | H4ac | all | notata | tata |
| K-mer | 61.03 | 49.35 | 78.61 | 37.14 | 83.78 | 92.65 | 57.75 |
| BPE | 66.01 | 56.79 | 80.07 | 54.19 | 85.57 | 92.55 | 60.85 |
| Transcription Factor Prediction (Human) | Core Promoter Detection | |||||||
| Tokenizer | 0 | 1 | 2 | 3 | 4 | all | notata | tata |
| K-mer | 67.99 | 67.06 | 59.45 | 50.24 | 72.80 | 74.91 | 69.23 | 74.91 |
| BPE | 66.99 | 70.98 | 61.40 | 55.10 | 71.31 | 66.28 | 67.99 | 72.73 |
| Transcription Factor Prediction (Mouse) | Virus | Splice | |||||
| Tokenizer | 0 | 1 | 2 | 3 | 4 | Covid | Reconstruct |
| K-mer | 48.96 | 81.69 | 81.71 | 63.17 | 42.83 | 62.16 | 77.90 |
| BPE | 48.01 | 81.86 | 82.98 | 73.22 | 46.15 | 69.75 | 79.62 |
Appendix B Data
B.1 Multi-Species Genome for Pre-Training
Table LABEL:tb:multi_species_details lists the 135 species in 7 categories that we randomly selected for genome foundation model pre-training and presents the number of nucleotides we achieved from each species.
| Fungi | Ceratobasidium | 655.37 |
| Claviceps Maximensis | 329.79 | |
| Fusarium Annulatum | 449.98 | |
| Melampsora | 699.52 | |
| Metschnikowia | 109.36 | |
| Mucor Saturninus | 391.17 | |
| Penicillium Chermesinum | 275.81 | |
| Saccharomyces Cerevisiae | 121.54 | |
| Sporopachydermia Quercuum | 155.71 | |
| Tranzscheliella Williamsii | 184.77 | |
| Xylariales | 399.96 | |
| Protozoa | Phytophthora Sojae | 792.65 |
| Pythium Apiculatum | 450.99 | |
| Mammalian | Bubalus Bubalis | 28768.00 |
| Camelus Dromedarius | 19757.02 | |
| Human | 31372.10 | |
| Macaca Assamensis | 27593.76 | |
| Macaca Nigra | 28217.13 | |
| Mus Musculus | 26545.98 | |
| Peromyscus Californicus | 24677.56 | |
| Invertebrate | Brachionus Rubens | 1327.37 |
| Ceroptres Masudai | 12.95 | |
| Cotesia Typhae | 1866.62 | |
| Croniades Pieria | 3889.85 | |
| Drosophila Athabasca | 1221.16 | |
| Emesis Russula | 4848.08 | |
| Hydra Oligactis | 12597.75 | |
| Meganola Albula | 3604.25 | |
| Oscheius | 383.21 | |
| Rutpela Maculata | 20213.33 | |
| Anas Zonorhyncha | 11697.08 | |
| Other | Coregonus Clupeaformis | 26824.02 |
| Vertebrate | Gnathonemus Longibarbis | 7314.74 |
| Myxocyprinus Asiaticus | 23407.19 | |
| Rhipidura Dahli | 10112.96 | |
| Bacteria | Aeromonas | 47.33 |
| Agrobacterium | 97.22 | |
| Alcaligenaceae Bacterium | 20.88 | |
| Aliivibrio | 46.48 | |
| Alphaproteobacteria Bacterium | 14.22 | |
| Amycolatopsis Antarctica | 63.43 | |
| Anaerostipes Faecis | 32.00 | |
| Arthrobacter | 36.27 | |
| Atopobium | 28.63 | |
| Bacillus Bc15 | 57.34 | |
| Bacillus Bs3 2021 | 43.51 | |
| Bacterium | 7.54 | |
| Bacteroidetes Bacterium Qs | 8.99 | |
| Breoghania Corrubedonensis | 53.32 | |
| Caldicoprobacter Oshimai | 27.25 | |
| Candidatus Cryptobacteroides Excrementipullorum | 27.63 | |
| Candidatus Dadabacteria Bacterium Rbg Combo | 11.49 | |
| Candidatus Dwaynia Gallinarum | 16.82 | |
| Candidatus Falkowbacteria Bacterium | 13.88 | |
| Candidatus Geothermincola Secundus | 24.76 | |
| Candidatus Gottesmanbacteria Bacterium | 11.08 | |
| Candidatus Nomurabacteria Bacterium Full | 6.29 | |
| Candidatus Portnoybacteria Bacterium Big Fil Rev | 8.17 | |
| Candidatus Regiella Insecticola | 20.62 | |
| Candidatus Roizmanbacteria Bacterium Combo All | 11.13 | |
| Candidatus Rokubacteria Bacterium | 22.06 | |
| Candidatus Saccharibacteria Bacterium | 6.55 | |
| Candidatus Staskawiczbacteria Bacterium Full | 6.79 | |
| Christensenella | 18.75 | |
| Clostridiaceae Bacterium | 29.62 | |
| Clostridiales Bacterium | 16.59 | |
| Clostridium Cag 505 | 21.26 | |
| Clostridium Mcc328 | 36.43 | |
| Clostridium Nexile | 38.43 | |
| Clostridium Uba3521 | 25.99 | |
| Collinsella Urealyticum | 19.45 | |
| Coprobacillus Cateniformis | 38.38 | |
| Cyanobium | 40.33 | |
| Dehalococcoidia Bacterium | 17.59 | |
| Enterobacteriaceae Bacterium | 41.46 | |
| Evtepia Gabavorous | 24.94 | |
| Firmicutes Bacterium | 36.66 | |
| Fulvivirga | 65.24 | |
| Jeongeupia Chitinilytica | 39.11 | |
| Legionella Endosymbiont Of Polyplax Serrata | 5.30 | |
| Listeria Ilorinensis | 30.31 | |
| Maribacter Cobaltidurans | 46.40 | |
| Marinomonas | 37.73 | |
| Mesorhizobium | 65.15 | |
| Methyloceanibacter Caenitepidi | 34.25 | |
| Microvirga | 68.63 | |
| Mycolicibacter Engbaekii | 45.21 | |
| Novosphingobium | 46.18 | |
| Omnitrophica Wor Bacterium Rbg | 12.52 | |
| Pantoea | 43.14 | |
| Paraburkholderia Edwinii | 82.99 | |
| Parerythrobacter Lutipelagi | 30.98 | |
| Paulownia Witches Phytoplasma | 8.92 | |
| Polaromonas Eurypsychrophila | 41.61 | |
| Prevotella Ag 487 50 53 | 29.63 | |
| Bacteria | Prevotella Uba3619 | 31.72 |
| Prevotella Uba634 | 18.51 | |
| Prochlorococcus Ag-321-I09 | 3.29 | |
| Prochlorococcus Ag-363-B18 | 15.54 | |
| Prochlorococcus Ag-402-L19 | 11.17 | |
| Prochlorococcus Scb243 498N4 | 14.12 | |
| Providencia | 41.89 | |
| Pseudomonas 35 E 8 | 63.56 | |
| Pseudomonas Bigb0408 | 59.52 | |
| Pseudomonas P867 | 62.01 | |
| Pseudomonas Promysalinigenes | 50.47 | |
| Roseobacter | 44.14 | |
| Salinicola Peritrichatus | 46.19 | |
| Salmonella S096 02912 | 48.09 | |
| Salmonella Zj-F75 | 47.87 | |
| Sinorhizobium | 65.53 | |
| Sodalis Ligni | 63.85 | |
| Sphaerochaeta | 28.61 | |
| Sphingobacterium | 36.55 | |
| Sphingomonas Carotinifaciens | 37.53 | |
| Sphingomonas Mesophila | 22.91 | |
| Sporosarcina Jiandibaonis | 36.30 | |
| Sporosarcina Ureilytica | 34.37 | |
| Staphylococcus Gdq20D1P | 28.50 | |
| Staphylococcus M0911 | 24.38 | |
| Streptococcus | 22.18 | |
| Streptomyces 8401 | 88.39 | |
| Streptomyces Di166 | 88.71 | |
| Streptomyces Durbertensis | 59.24 | |
| Streptomyces Neau-Yj-81 | 118.84 | |
| Streptomyces Rk74B | 87.36 | |
| Thermopetrobacter | 26.06 | |
| Uncultured Kushneria | 35.31 | |
| Uncultured Phascolarctobacterium | 17.95 | |
| Uncultured Proteus | 35.66 | |
| Bacteria | Verrucomicrobiales Bacterium | 3.15 |
| Vibrio | 41.47 | |
| Victivallis Lenta | 55.45 | |
| Virgibacillus Salexigens | 44.18 | |
| Xanthomonadales Bacterium | 37.47 |