

Hot-mode accretion and the physics of thin-disk galaxy formation
Abstract
We use FIRE simulations to study disk formation in , Milky Way-mass galaxies, and conclude that a key ingredient for the formation of thin stellar disks is the ability for accreting gas to develop an aligned angular momentum distribution via internal cancellation prior to joining the galaxy. Among galaxies with a high fraction () of their young stars in a thin disk (), we find that: (i) hot, virial-temperature gas dominates the inflowing gas mass on halo scales ( kpc), with radiative losses offset by compression heating; (ii) this hot accretion proceeds until angular momentum support slows inward motion, at which point the gas cools to ; (iii) prior to cooling, the accreting gas develops an angular momentum distribution that is aligned with the galaxy disk, and while cooling transitions from a quasi-spherical spatial configuration to a more-flattened, disk-like configuration. We show that the existence of this “rotating cooling flow” accretion mode is strongly correlated with the fraction of stars forming in a thin disk, using a sample of 17 galaxies spanning a halo mass range of and stellar mass range of . Notably, galaxies with a thick disk or irregular morphology do not undergo significant angular momentum alignment of gas prior to accretion and show no correspondence between halo gas cooling and flattening. Our results suggest that rotating cooling flows (or, more generally, rotating subsonic flows) that become coherent and angular momentum-supported prior to accretion onto the galaxy are likely a necessary condition for the formation of thin, star-forming disk galaxies in a CDM universe.
Keywords:
galaxies: disk – galaxies: evolution – galaxies: haloes – cosmology: theory1 Introduction

Our present picture for the formation of galactic disks can be largely traced to analytic ideas first explored by Fall & Efstathiou (1980), where a galaxy’s angular momentum is intimately tied to the corresponding properties of its host dark matter halo. Collapsing structures in an otherwise expanding universe will be spun up by the large-scale matter field (Peebles, 1969); this can deliver enough angular momentum to allow (at least some) galaxies to have significant angular-momentum support (Mo et al., 1998, e.g.). While these ideas have provided foundational insights into the origin of disk galaxies in a CDM universe, our understanding of disk formation, and thin-disk galaxy formation in particular, remains incomplete. While dark matter haloes of all masses are predicted to have similar angular momentum distributions (Barnes & Efstathiou, 1987, e.g.), disk fraction varies noticeably as a function of galaxy mass (Bernardi et al., 2010; Bluck et al., 2014; Moffett et al., 2016, e.g.). Moreover, dark matter spin alone is insufficient to explain the detailed properties of disks formed in cosmological simulations (Sales et al., 2012; Garrison-Kimmel et al., 2018a; Rohr et al., 2021, e.g.).
Given what we know about the angular momentum distribution in galactic haloes, it is somewhat surprising that so many galaxies are dominated by thin disks, with scale heights and vertical velocity dispersions that are small compared to their scale radii and circular speeds, (Kregel et al., 2002). We know, for example, that the angular momentum distribution of dark matter (Bullock et al., 2001; Lian et al., 2018) and gas (Stewart et al., 2013; DeFelippis et al., 2020) in galactic haloes is quite broad. This means that in order for a tightly-ordered thin disk to emerge, the gas must become coherently aligned along a single plane after being part of the quasi-spherical extended galactic halo and before forming stars. This suggests that the process by which gas is deposited from the galactic halo into the galaxy, and how this process affects the angular momentum distribution, is an essential aspect of thin disk formation.
The process by which gas is deposited into a galaxy from the circumgalactic medium (CGM) has been explored considerably (Kereš et al., 2005; Kereš et al., 2009a; Dekel & Birnboim, 2006; Faucher-Giguère et al., 2011; van de Voort et al., 2011; Anglés-Alcázar et al., 2017; Stevens et al., 2017; Martin et al., 2019, e.g.). Broadly speaking two paths of galaxy fueling have been identified: hot mode and cold mode. In the cold-mode case, gas is deposited into the galaxy without ever virializing; this occurs typically in lower-mass haloes, where the gas cooling time is shorter than the infall time. In hot-mode accretion, which dominates for massive haloes at late times (, ; e.g. Faucher-Giguère et al. 2011; Van de Voort et al. 2011; Van de Voort & Schaye 2012; Joung et al. 2012; Murante et al. 2012; Nelson et al. 2013; Fielding et al. 2017), gas first shock-heats to the halo virial temperature, and then radiates away its gravitational and thermal energy prior to accreting onto the galaxy. Our own Milky Way (MW) is one such galaxy for which hot-mode accretion is expected to dominate. As discussed above, we expect the mode of gas delivery, and the precise means by which gas mixes, cools, and accretes to have a substantial bearing on the ability to form thin, coherently rotating disks.
In cold mode accretion, cool ( K) gas travels from cosmological scales through the CGM and intergalactic medium (IGM), and into the galaxy in filaments (Kereš et al., 2005; Kereš et al., 2009b; Dekel & Birnboim, 2006; Faucher-Giguère et al., 2011; Martin et al., 2019, e.g.), often along with embedded satellite galaxies (Faucher-Giguère et al., 2015; Faucher-Giguère et al., 2016; Hafen et al., 2019; Esmerian et al., 2021, e.g.). This mode is expected to dominate the mass inflow rate at high redshifts (Kereš et al., 2009a; Dekel et al., 2009; Huscher et al., 2021, ; e.g.). It is unclear, however, if the cool filaments remain intact down to the galaxy, or rather heat up and dissolve into the surrounding hot phase (e.g. Kereš & Hernquist 2009; Nelson et al. 2016; Mandelker et al. 2016; Mandelker et al. 2018; Mandelker et al. 2020), in which case hot accretion onto the galaxy would also be important at high redshift). Cool filamentary inflow typically carries more specific angular momentum (on average) than either hot gas or dark matter (Stewart et al., 2017, e.g.), and systems fed by cold accretion often have extended, messy, “cold flow disks” orbiting the galaxy (Stewart et al., 2011; Stewart et al., 2013; Danovich et al., 2015; Dekel et al., 2019, e.g.). However, the tendency for such gas to have a wide range of trajectories as it approaches the galactic region may hinder the ability to develop a thin, coherently aligned structure prior to star formation. Also, the fact that thin disk galaxies are common only among fairly massive systems () at lower redshift (Kranz et al., 2003; Kassin et al., 2006; Bizyaev et al., 2021; Kassin et al., 2012b; Simons et al., 2015; Simons et al., 2017, e.g.), suggests that cold-mode delivery may not be conducive to thin disk formation.
An alternative possibility is that hot-mode accretion, believed to dominate in more massive haloes at lower redshift, is more favorable to thin-disk formation. Indeed, some cosmological simulations show a correlation between hot accretion and disk formation, albeit with wide scatter (Sales et al., 2012). The connection depends on the specific mechanics of this accretion mode, and on whether the hot gas manages to cool and accrete rather than being reheated by galactic feedback processes. One possible subset of hot-mode accretion is instability-driven accretion, wherein gas precipitates out of a hydrostatic hot halo due to thermal instabilities, forming cool clouds that lose buoyancy and accrete onto the galaxy (Fall & Rees, 1985; Maller & Bullock, 2004; McCourt et al., 2012; Voit et al., 2015; Armillotta et al., 2016; Gronke & Oh, 2020; Fielding et al., 2020; Voit, 2021, e.g.). Alternatively, radiative cooling in the hot CGM can cause the entire hot halo to flow radially inward. In this latter scenario, compression heating of the hot gas due to the inflow roughly balances radiative losses, so the hot gas stays at an approximately constant temperature. This type of hot accretion has been termed a ‘cooling flow’ in the context of galaxy cluster studies (Mathews & Bregman, 1978; Cowie et al., 1980; Fabian et al., 1984; Balbus, 1988; Bertschinger, 1989; McNamara & Nulsen, 2007), and was recently revisited in the context of galaxy-scale haloes by Stern et al. (2019). A hot inflow is qualitatively distinct from precipitation, since the entire hot medium inflows on a cooling timescale, which implies that thermal instabilities do not have time to grow substantially (Balbus & Soker 1989, see also Fig. 10 in Stern et al. 2019). The angular momentum content of such hot inflows was considered by Stern et al. (2020), who showed that angular momentum sets a maximum accretion rate in which the inflow remains hot and subsonic down to the galaxy scale. In the present paper we demonstrate that such cooling flows with angular momentum (i.e. ‘rotating cooling flows’) are the primary mode of gas accretion onto disky Milky Way-mass galaxies at in the FIRE-2 cosmological simulations (Hopkins et al., 2018), and may be a necessary condition for the formation of thin star-forming disks.
The analysis here follows Stern et al. (2021a), which showed that the formation of disks is closely connected to the formation of a virialized and stable hot CGM. Yu et al. (2021) subsequently showed that the emergence of an inner virialized CGM correlates specifically with a transition from thick-disk to thin-disk formation. The conditions necessary for thin disk formation thus appear to correlate with the conditions necessary for the onset of hot accretion modes, and cooling flows in particular. In contrast, it seems unlikely that the transition to a thin disk in FIRE-2 is driven by increased ejection of low angular momentum gas by feedback as suggested by analysis of other simulations (Brook et al., 2011; Übler et al., 2014; Genel et al., 2015; DeFelippis et al., 2017, e.g.), since in FIRE-2 the mass loss due to feedback drops when the galaxy becomes disky (Hafen et al., 2020; Pandya et al., 2021; Stern et al., 2021b). These findings motivate the exploration that follows.
Central to our analysis, and the analyzes of Stern et al. and Yu et al., are the FIRE simulations (Feedback in Realistic Environments; Hopkins et al. 2014; Hopkins et al. 2018)11 1 https://fire.northwestern.edu/ a set of “zoom-in” simulations that resolve stellar feedback on the scale of giant molecular clouds in the interstellar medium (ISM) (Guszejnov et al., 2020; Benincasa et al., 2020), producing winds that expand into the CGM and interact with accreting gas (Muratov et al., 2015; Muratov et al., 2017; Anglés-Alcázar et al., 2017; Hafen et al., 2019; Hafen et al., 2020; Pandya et al., 2021). The resultant galaxies are broadly consistent with the stellar mass-halo mass relation (Hopkins, 2017), satellite galaxy populations (Wetzel et al., 2016; Garrison-Kimmel et al., 2019; Samuel et al., 2020), and can have thin-disks consistent with Milky Way-like galaxies (Ma et al., 2017; Garrison-Kimmel et al., 2018b; El-Badry et al., 2018b; Yu et al., 2021), albeit potentially with hotter kinematics (Sanderson et al., 2020). Here we use the FIRE-2 simulations to study gas accretion onto galaxies and its relation to thin disk morphology. Our approach uses the particle-tracking methodology developed in Hafen et al. (2019); Hafen et al. (2020) to explore the mechanics of rotating cooling flows near the disk-halo interface where angular momentum support is substantial. Our analysis goes beyond 1D steady-state solutions for rotating cooling flows developed in classic ICM studies (Cowie et al., 1980, e.g.), and extends the idealised 3D simulations of rotating cooling flows in Stern et al. (2020) to a more realistic cosmological setting. Our work is complementary to Trapp et al. (2021), who characterized the phenomenological properties of accretion onto MW-like FIRE galaxies, and the particle tracking analysis of Anglés-Alcázar et al. (2017), who provided an overview of the connection between the cosmic baryon cycle and galaxy mass assembly.
This paper is structured as follows. In §2 we describe our sample of FIRE simulations and the sample of accreting particles selected from the simulations. In §3 we analyze the characteristics and mechanics of gas accretion onto galaxies in FIRE, and their relation to thin disk morphology in the central galaxy. We discuss our results in §4 and conclude in §5.
2 Methods
2.1 Simulations
| Name | Metal diffusion? | Reference | |||||
|---|---|---|---|---|---|---|---|
| kpc | |||||||
| m12i | 0.94 | 268 | 0.34 | ✓ | Wetzel et al. (2016) | ||
| m12i_core | 0.89 | 274 | 0.34 | Hopkins et al. (2018) | |||
| m12b | 0.88 | 286 | 0.35 | ✓ | Garrison-Kimmel et al. (2019) | ||
| m12c | 0.87 | 283 | 0.25 | ✓ | Garrison-Kimmel et al. (2019) | ||
| m12f | 0.87 | 302 | 0.24 | ✓ | Garrison-Kimmel et al. (2017) | ||
| m11h | 0.52 | 146 | 0.047 | ✓ | El-Badry et al. (2018a) | ||
| m12w | 0.49 | 253 | 0.15 | ✓ | Samuel et al. (2020) | ||
| m12m | ∗0.46 | 298 | 0.26 | Hopkins et al. (2018) | |||
| m11b | 0.44 | 92.4 | 0.12 | Chan et al. (2018) | |||
| m12r | 0.31 | 257 | 0.11 | ✓ | Samuel et al. (2020) | ||
| m12z | 0.11 | 242 | 0.052 | ✓ | Garrison-Kimmel et al. (2019) | ||
| m11i | 0.046 | 106 | 0.013 | ✓ | El-Badry et al. (2018a) | ||
| m11c | 0.035 | 137 | 0.0068 | Hopkins et al. (2018) | |||
| m11e | 0.031 | 136 | 0.044 | ✓ | El-Badry et al. (2018a) | ||
| m11d | 0.03 | 169 | 0.0026 | ✓ | El-Badry et al. (2018a) | ||
| m11a | 0.022 | 90.3 | -0.022 | Chan et al. (2018) | |||
| m11q | 0.0066 | 138 | 0.0045 | ✓ | Hopkins et al. (2018) |
Properties at of the sample of FIRE galaxies analyzed in this work. The value of is the fraction of stars formed in the last Gyr prior to that are in a thin disk configuration (; e.g. Yu et al. 2021). The m12m galaxy has a sizable bar, which drives the thin-disk fraction lower by our adopted definition (marked by ∗). The value of is a measure of the relation between cooling and flattening in accreted gas (§3.3). The “metal diffusion” column marks whether or not the simulation includes a subgrid prescription for metal diffusion.
We analyze hydrodynamical cosmological zoom-in simulations produced as part of the FIRE project (Hopkins et al., 2014). The simulation sample, listed in Table 1, were run with the FIRE-2 version (Hopkins et al., 2018) of the gravity and hydrodynamics code GIZMO22 2 http://www.tapir.caltech.edu/~phopkins/Site/GIZMO.html (Hopkins, 2015). The simulations were produced using the meshless finite-mass (“MFM”) mode of GIZMO, a Lagrangian method with no inter-element mass flux. This enables us to track the history of each resolution element. The full details of simulations produced with the FIRE-2 code are available in Hopkins et al. (2018). The FIRE simulations include detailed prescriptions for star formation and stellar feedback. Each star particle contributes to the simulation momentum from radiation pressure; energy, momentum, mass, and metals from Type Ia and II supernovae and stellar winds; and photo-ionization and photo-electric heating. The mass of the resolution elements ranges from 2100-7100 . Star formation is limited to self-gravitating, self-shielding (molecular) gas with a density of at least cm-3. In addition to stellar radiation, the simulations include a uniform meta-galactic radiation background that ionizes gas in the intergalactic and circumgalactic medium (Faucher-Giguère et al., 2009). In the simulations and throughout our analysis we use a standard flat CDM cosmology with , , , and km s-1 Mpc-1 (Planck Collaboration et al., 2018, e.g.,).
Fig. 1 shows edge-on mock Hubble images for the snapshots of four of our simulated galaxies, neglecting dust attenuation to more clearly illustrate the stellar distribution. The bottom-left and top panels show three MW-mass galaxies (m12i, m12b, and m12c) while the bottom-right panel shows a dwarf galaxy, m11d. As noted in previous studies (Garrison-Kimmel et al., 2018b; El-Badry et al., 2018b) MW-mass galaxies in FIRE typically have thin disk morphologies, while lower mass galaxies show a thick disk / irregular morphology. We quantify this trend using , defined as the mass fraction of stars with age Gyr (at ) that have . Here is the specific angular momentum in the direction and is the angular momentum that the star would have if it had the same energy but was in a circular orbit. The axis is defined as the direction of the total angular momentum vector of stars inside the galaxy. This definition of the thin disk is the same definition used in Yu et al. (2021). Values of correspond to height to size ratios (confirmed across a number of choices of and ) and rotation to dispersion ratios , and correlate strongly with the observed thin disk fraction in the band (Appendix A). The values of are noted in Fig. 1 and listed in Table 1. Throughout we will refer to galaxies with as thin disk galaxies and galaxies with as irregular or thick disk galaxies.
2.2 Analysis
For each galaxy we use the particle tracking method described in Hafen et al. (2019); Hafen et al. (2020), which in turn applies insight from previous particle-tracking applied to the FIRE simulations (Anglés-Alcázar et al., 2017). We select an unbiased sample of resolution elements (particles) that have accreted onto the central galaxy during the last Gyr prior to . To select such particles, we require that they are (1) within the galaxy radius at , either in stars or in gas with density cm-3, and (2) within the CGM (gas at ) in the snapshot corresponding to 1 Gyr prior to . Throughout the paper we use for the 3D distance. We define following Hafen et al. (2019); Hafen et al. (2020), where is the stellar half-mass radius. When selected this way, the number of particles that meet these conditions ranges from for the low-mass irregular galaxies to for the thin-disk galaxies. For each selected particle we retrieve the full history of the particle, including temperature, density, and metallicity. We discard a small fraction () of the particles whose mass increases by a factor two as a consequence of mass deposition by stellar feedback33 3 These particles pose a problem for our tracking method because the history of the additional mass is not recorded, and because they are split into multiple particles after gaining sufficient mass.. In Appendix B we show that the accretion histories of selected particles are representative of the accretion histories of all stars formed within Gyr of , and that around thin disk galaxies our selected particles are drawn from the angular momentum distribution of the CGM without bias.
A key time for our analysis is the accretion time , the time at which a particle first accretes onto the galaxy after being identified as part of the CGM 1 Gyr prior to . Explicitly, is:
| (1) |
i.e. the last snapshot prior to the particle matching the above criteria for being within a galaxy.
Another key time for our analysis is the last time a particle cools prior to entering the galaxy. For a given particle, we define this time as:
| (2) |
i.e., the last snapshot the particle was hot prior to . For gas that cools as it accretes, occurs as the gas passes through the galaxy-halo interface. In all halos we find that of tracked particles heat above K at some point prior to accretion, even in our low mass halos where the virial temperature is K and accretion onto the galaxy is dominated by cold inflows. In such halos heating is typically temporary due to the short cooling times, but hot gas still comprises of the halo’s gas mass at any given time (Hafen et al., 2019; Hafen et al., 2020). Below we analyze the statistical properties of all accreting particles as a function of time relative to their cooling time () or relative to their accretion time ().
3 Results

To characterize gas accretion we analyze the central galaxy and its CGM from to one Gyr prior. Fig. 2 shows a visual overview of how gas accretes onto m12i – a MW-mass galaxy that forms a substantial thin disk (). The top and right panels plot the temperature and spatial evolution of accreting gas versus time prior to cooling (), while the bottom-left panel plots three representative trajectories for accreting gas elements. The trajectories were visualized using the Firefly visualization software (Geller & Gurvich, 2018).44 4 A 3D version of these trajectories is available online at zhafen.github.io/rotating-cooling-flows. The Firefly homepage is at alexbgurvi.ch/Firefly. The trajectory color scales with temperature, with red, white, and blue indicating K, K, and K, respectively. The figure shows that at early times relative to cooling ( Myr) the accretion is hot ( K) and contracts quasi-spherically. Then, around the time of cooling the geometry of accreting gas transitions from quasi-spherical at Myr to a cool disk aligned with the galaxy at Myr. A quantitative analysis of this transition follows in §§3.1–3.4.
3.1 Gas inflow onto thin-disk MW analogs is hot through the CGM
Fig. 3 plots various characteristics of accreting gas on the m12i thin disk galaxy, as a function of time relative to the accretion’s last cooling time (). In each panel, solid lines and shaded regions mark the medians and 16th to 84th percentile ranges of all particles accreted within Gyr prior to . The lower limit on the time range applied in this figure is to ensure that particles are present for most of the time displayed after , although removing the limit does not change the qualitative results. In the temperature panel (A) we exclude from the distribution particles that have converted into stars.
Panel (A) demonstrates that during the 500 Myr prior to cooling for a final time, the inflow is predominantly hot ( K), with a median temperature of K, similar to the halo virial temperature of K. This is not true by construction — gas could maintain a temperature K for only a short time prior to cooling. In Appendix C we verify that the inflow is predominantly hot also in terms of mass inflow rate. During the time prior to cooling the accreting gas is inflowing toward the galaxy (panel B), from a median kpc at Myr, to a median at , after which time the inflow decelerates. The characteristic inflow velocity of km s-1 (Panel C) is substantially lower than the circular velocity of km s-1. This radial velocity is also smaller than the median sound speed of km s-1, indicating a subsonic flow.
We show below that a similar hot inflow is seen in other thin disk galaxies in our sample, and that the accretion occurs on a cooling timescale. Thus, accretion from the CGM onto thin disks in FIRE is dominated by the inflow of hot, virial temperature gas, as in classic cooling flow solutions (Fabian et al., 1984, e.g.). This hot accretion mode, in which the entire hot phase inflows, is qualitatively different from ‘precipitation’, in which gas clumps cool out of the hot phase at halo scales, lose buoyancy and subsequently accrete (see introduction). The dominance of a hot inflow over precipitation in MW-like galaxies simulated in FIRE has previously been noted by Esmerian et al. (2021).
3.2 Accretion cools and decelerates at the galaxy-halo interface
Panel (A) in Fig. 3 demonstrates that at the temperature drops quickly from K to K. Panel (B) shows that this cooling occurs at the galaxy edge or shortly beyond, at kpc, equivalent to 55 5 Gas can have if it is under-dense relative to the galaxy when it crosses ( cm-3; see section 2.2).. Less than of particles cool beyond kpc. After cooling to K, the temperature further drops to cool ISM temperatures of K and stars begin to form at a rate of per Myr (panel D), roughly equal to the average rate in the galaxy ISM. The vertical grey line in panel (A) marks the median time at which the gas accretes, though spans Myr depending on the particle.
Panel (C) in Fig. 3 demonstrates that cooling at the galaxy scale is further associated with a change in kinematics. The radial inflow velocity starts decelerating Myr prior to cooling, finishing at km s-1 after cooling. The deceleration is associated with reaching , where is defined with respect to the total angular momentum of stars in the galaxy at , indicating a transition from pressure-support in the hot CGM to rotational support in the cool ISM. Note that deceleration prior to accretion is possible due to the subsonic nature of the radial hot flow — the gas pressure can adjust close to the galaxy so the transition to a rotating disk happens smoothly rather than in a single shock. Similar results are seen for accretion onto other thin-disk galaxies in our sample (see below), indicating that the majority of accretion onto thin disk galaxies in FIRE is a hot inflow which cools and decelerates just outside the galaxy. As shown below (§3.5; Appendix D), this is not the case for galaxies that lack thin disks in our sample. Galaxies that are dominated by thick/irregular morphology demonstrate no such deceleration at the galaxy-halo interface.
3.3 Cooling of accreted gas is concurrent with flattening
Panel (B) in Fig. 3 also plots the distance above or below the disk plane as a function of time. The panel shows that as the gas collapses, it becomes increasingly flattened in the disk plane. At the time of cooling, the gas has a median height of kpc, indicating a disk geometry with height to radius ratio of , consistent with the transition to rotation support indicated by panel (C). Panel (D) in Fig. 3 emphasizes that all of the star formation occurs after rotation support is achieved and the disk geometry is in place.
This correspondence between a transition to disk geometry and cooling is further explored in Fig. 4, which plots the geometry of accreting gas at different times relative to for the four galaxies shown in Fig. 1. Times prior to cooling are colored in red, while times after cooling are plotted in blue. All particles with within 30 Myr of the value noted in the legend are included in the distribution. The curves show the PDF of , i.e. is the angle between the gas element position and the total angular momentum vector of stars in the galaxy at . A spherical distribution of accreted gas would have a flat PDF with a value of 0.5, while the PDF of an infinitely thin disk would be a -function centered at . The figure shows that gas accreting onto the three thin-disk galaxies transitions from being distributed quasi-spherically at Myr to being distributed in the galaxy plane at Myr. This indicates that the cooling and flattening of the accreting gas occurs simultaneously in these galaxies, consistent with the conclusion from Figs. 2 and 3. In contrast, in the irregular galaxy shown in the bottom-right there is no association between cooling and flattening. Rather, the geometry of accreting gas is quasi-spherical both before and after cooling.
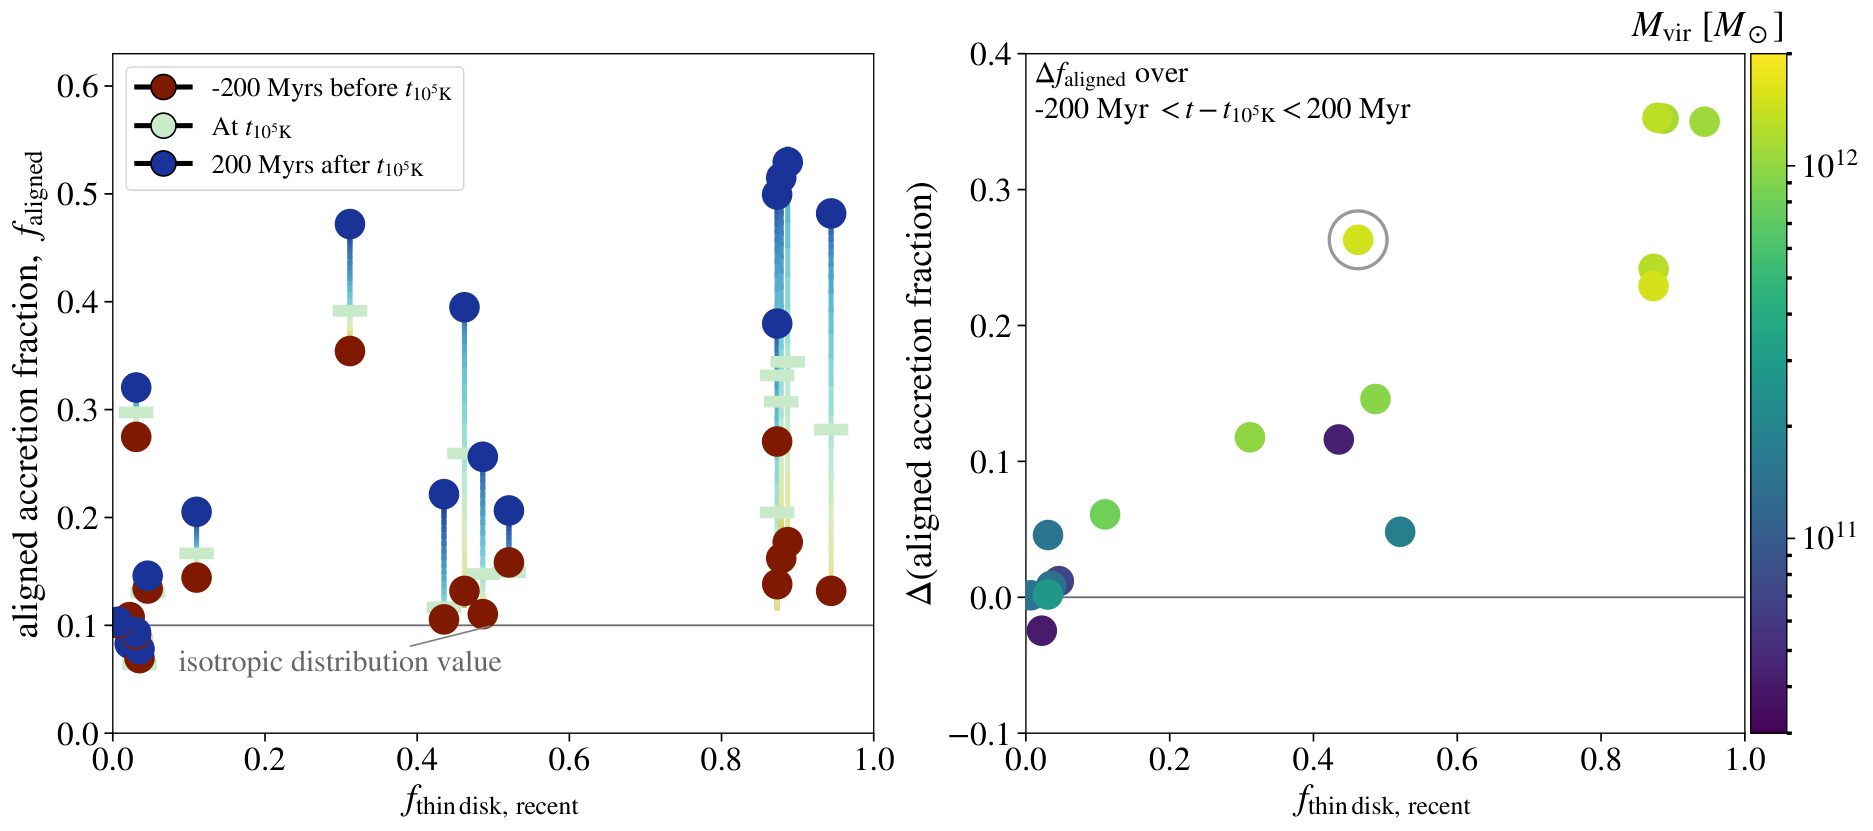
Fig. 5 extends the analysis in Fig. 4 to the full sample. We parametrize the extent of flattening via a parameter (for “aligned accretion”), which corresponds to the fraction of accreting gas mass aligned with the disk plane (, marked by dashed vertical lines in Fig. 4). The left panel of Fig. 5 shows the evolution of from 200 Myr before (red) to 200 Myr after (blue), while the right panel shows the change in between these two epochs. The horizontal axes plot the fraction of young stars in a thin disk . For most haloes the accreting gas is largely unaligned prior to cooling, with comparable to expected for an isotropic distribution. Upon cooling, the alignment of accreting gas sharply increases in haloes with — in most cases of mass collapses to during this time. In contrast, in haloes with there is practically no change in upon cooling. Intermediate cases with typically show a modest increase in . The right panel of Fig. 5 demonstrates the strong correlation between the change in when the gas cools and the fraction of recent stars in a thin disk. That is, this panel shows that flattening is concurrent with cooling in accretion onto thin-disk galaxies, while no such association exists for accretion onto irregular or thick disk galaxies.
The galaxy circled in the right panel, m12m, has a stellar bar (Debattista et al., 2019), which tends to decrease . This bar may help explain why this galaxy is somewhat offset to low relative to other galaxies with a similar large change in .
3.4 Angular momentum and energetics of accreting gas
The mechanics of concurrent cooling and flattening in rotating cooling flows is explored in Fig. 6, for the example case of m12i. The shaded region in panel (A) shows the 16th–84th percentiles in , the ratio of angular momentum in the direction to the magnitude of total angular momentum, for individual particles as a function of . The dashed line plots , i.e. the same ratio but for the total angular momentum of accreting gas at a given . Note that this latter ratio is not identical to unity because the direction is with respect to the central galaxy rather than the gas itself. At Myr the ratio spans a large range of , while by nearly all the accreting gas has , indicating all hot accreting gas particles are co-rotating. On the other hand, the alignment of the total angular momentum is nearly constant with time prior to accretion. These trends indicate that components unaligned with the net angular momentum are canceling out due to interaction in the hot halo.
Fig. 6 panel (B) shows the magnitude of the specific angular momentum (; green) and the z-component of the specific angular momentum (; purple). The median value of decreases prior to cooling, from kpc km s-1 to , in contrast with which remains constant. The nearly constant indicates the inflow roughly conserves its net angular momentum. At the same time the decreasing indicates the inflow is cancelling out unaligned components, consistent with the conclusion from panel (A). We note that this result appears contradictory to the result of Stevens et al. (2017) based on the EAGLE simulations, which found a decrease in net angular momentum when accreting hot gas cools onto the galaxy.
The value of kpc km s-1 is comparable to the average specific angular momentum of expected in dark matter haloes due to tidal torques (Bullock et al., 2001, e.g.). Using a typical dimensionless spin parameter , and the virial radius kpc and virial velocity km s-1 of this halo, we get kpc km s-1, i.e. the expected average value of the dark matter is within of the net angular momentum of accreting hot gas shown in Fig. 6. The fact that the gas has slightly more angular momentum than naively expected for the dark matter is consistent with previous findings that gas typically has a slightly higher spin than dark matter (Stewart et al., 2017, e.g.).
The dashed line in panel (B) of Fig. 6 plots the median specific angular momentum necessary for gas to be fully supported by angular momentum at a given radius, i.e. . The accretion attains significant angular momentum support as it proceeds through the inner CGM, consistent with other analyzes of CGM rotational support which find that rotation support is more prominent at smaller CGM radii (Oppenheimer, 2018; Trapp et al., 2021). The values of and converge shortly after , indicating that cooling and a transition to rotational support occur almost simultaneously, as indicated also by Fig. 3. This result is consistent with 1D steady-state cooling flow solutions which include angular momentum – these solutions demonstrate that the hot inflow cools to K at the radius where , as long as the flow remains subsonic down to this radius (Cowie et al., 1980; Stern et al., 2020).
There is a small but noticeable increase in at , i.e., the angular momentum of accreting gas increases somewhat when it transitions from the hot CGM to the ISM. This increase is similar to the observed difference between the rotation velocity of the Milky Way disk and its hot CGM (Hodges-Kluck et al., 2016). While this increase is not the focus of our analysis, we note that it may be a result of a difference in orientation between the angular momentum of the galaxy and the angular momentum of the accreting gas (Danovich et al., 2012; DeFelippis et al., 2017, e.g.), which forces the accreting gas to co-rotate with the galaxy upon accretion. Any angular momentum gained is expected to be lost by other particles, driving an inflow in the disk or disk-halo interface (Mayor & Vigroux, 1981; Pezzulli & Fraternali, 2016).
Fig. 6 panel (C) shows the distribution of the accreting gas density versus time relative to cooling. Prior to cooling the gas density increases steadily due to the inflow, reaching cm-3 just before cooling at . This density is comparable to observational estimates of the hot gas density just outside the Milky Way disk (e.g., Li & Bregman 2017). At , the gas density sharply increases, reaching cm-3 within Myr, due to the decreasing radial velocity of the inflow upon accretion (Fig. 3), and due to the collapse from a quasi-spherical geometry into a disk geometry. The gas then starts forming stars shortly after cooling (Fig. 3). Note that star formation occurs despite that the 84th density percentile after cooling is cm-3, well below the minimum density for star formation of cm-3 in FIRE. This is because gas remains at densities approaching only for a short time before forming stars.
In Fig. 6 panel (D) we assess the energetics of the hot gas to determine why it cools. We study the energetics through two types of change in specific energy: radiative cooling (blue lines) and compression heating (red lines). Radiative cooling per unit mass for an individual particle is calculated as , where is the hydrogen density, is the mass density, and is the cooling function. We include only fluid elements with K, to avoid optical thickness effects on cooling, and to avoid large fluctuations when approaches zero at K. As our focus is the energetics of the hot gas, this cut does not affect our conclusions. Compression heating per unit mass for an individual resolution element is calculated as , where is the thermal pressure, is the specific volume, is the change in density from one snapshot to the next, and is the snapshot time spacing. Because accreting gas elements interact with other accreting gas elements thermodynamically we show the mean specific energy tracks of all gas elements binned into 100 Myr bins of . Also, to focus on the behavior of the majority of the particles we do not bin the of particles with the highest change in specific energy. Some bins contain much more accreting gas than others, and to reflect this we set the darkness of the lines proportional to the number of particles in the bin.
At Myr the radiative cooling rate is erg s-1 g-1, corresponding to a cooling time Myr for the median temperature of K at this epoch (see Fig. 3, panel A). At later but still prior to cooling, the radiative cooling rate increases due to the increase in gas density. The panel shows that this energy loss to radiation is followed closely by compressive heating, explaining the roughly flat temperature profile at (Fig. 3). This approximate equality between radiative cooling and compressive heating is a defining characteristic of classic cooling flows in which angular momentum support can be neglected (Mathews & Bregman, 1978; McNamara & Nulsen, 2007; Stern et al., 2019). This balance between radiative cooling and compressive heating is not possible in a perfectly hydrostatic halo, since without inward movement compression will not occur.
Around the cooling rate and compressive heating diverge. This can be understood by noting that the radiative cooling rate per unit mass scales as , while the compressive heating rate scales as . The deceleration of the hot inflow prior to accretion onto the galaxy causes to increase faster than , causing radiative cooling to exceed compressive heating and the temperature to decrease. This in turn increases the cooling rate which further accelerates the drop in temperature. The result is gas that cools from K to K over the course of Myr.
Panel D also shows that after when the gas is part of the ISM, radiative cooling greatly exceeds compression heating, indicating that hot gas in the ISM is short lived.
3.5 Comparison of accretion onto thin disk galaxies and onto irregular galaxies
Figure 7 compares the properties of accretion onto galaxies with (“thin disk galaxies”) versus accretion onto galaxies with (“irregular galaxies”). For each property the colored lines show the median of the medians of the individual simulations in the group at a given . The properties are plotted as a function of time relative to the time at which gas accretes onto the main galaxy (), defined as the first time gas is within and with a density cm-3. This is in contrast with plotting properties versus as done above, since in irregular galaxies where accretion is generally cool (K) the last cooling time is not associated with accretion onto the galaxy. We also exclude m12f from the thin disk group since the gas cools and becomes rotationally supported at significantly larger radii than , due to the exceptionally large kpc km s-1 of hot gas in this galaxy. This galaxy is further discussed in Appendix D.
The red lines in Fig. 7 demonstrate that the conclusions from Figs. 3 and 6 hold on average for all thin disk galaxies in our sample: gas inflow is hot through the CGM with a median K, and cooling and deceleration occurs at the galaxy edge, at which time the gas distribution also flattens. In contrast, accretion onto irregular galaxies is primarily cold, with no change in median temperature before and after accretion. Gas becomes more spatially aligned as it accretes, but still has a median , and never becomes fully rotationally supported. Accretion onto thin disks and irregulars also differ significantly in their spin-aligned fraction prior to (lower-left panel) – at the fraction of spin-aligned accretion onto thin disk galaxies is , a factor of three higher than the fraction of in irregular galaxies. This suggests that achieving angular momentum coherence in the CGM is conducive to the formation of thin disks.


3.6 Angular momentum coherence in accreted gas
Figure 8 shows the evolution of the angular momentum distribution for m12i versus time relative to . We use an “on-sky” azimuthal equidistant projection of the angular momentum direction for m12i. Azimuthal equidistant projections preserve the distance to the central point (the angular momentum direction of the galaxy at ) as well as the orientation () relative to the central point. Each histogram bin covers an equal area. The total angular momentum of the accreting gas at each time is shown via a black point outlined in white. The Figure shows that prior to Myrs accretion is composed of gas rotating in a variety of directions, including counter-rotating ( or equivalently ). The net angular momentum is however roughly centered on the angular momentum of the galaxy . By Myrs the angular momentum distribution is significantly more coherent/narrower, while only a minor change in seen in the direction of net angular momentum vector. At and shortly after the angular momentum distribution further narrows and the net vector nearly fully aligns itself with the galaxy.
Fig. 9 shows the cumulative distribution function of in the accreted gas, weighted by mass, for the four simulations shown in Fig. 4. This distribution quantifies the level of alignment of angular momentum in the accreted gas with respect to the rotation axis of the stars. For reference, perfectly co-rotating gas has , while perpendicular and counter-rotating gas have and , respectively. An isotropic distribution of angular momentum would appear as a diagonal line in this plot. Each curve corresponds to a different as noted in the legend. Outlined in black are the CDFs for -200, 0, 200 Myr.
In gas accreting onto thin disk galaxies (top and bottom-left panels of Fig. 9) the angular momentum distribution becomes increasingly coherent with time relative to . At Gyr the angular momentum distribution is marginally coherent, with of accreting gas co-rotating with . In contrast at Myr the distribution is highly coherent, with for of accretion. The majority of the evolution in coherence occurs over Myr prior to , as seen by the differences between the distributions for Myr and Myr. This increase in coherence allows the accreting gas to collapse into a thin disk as shown in Figs. 4–5. Furthermore, this result shows that accreting gas is almost entirely co-rotating with the galaxy prior to accreting, i.e., while the accretion is still part of the galactic ‘hot corona’.
In stark contrast with thin disk galaxies, the irregular galaxy m11d shown in the bottom-right panel of Fig. 9 experiences only a very mild evolution in angular momentum coherence — angular momentum remains only marginally co-rotating both before and after accreting.
In Figure 10 we show the change in angular momentum alignment across the full sample, similar to Fig. 5 for spatial alignment. In this case, spin alignment is defined as the fraction of gas with . The change in spin alignment is calculated focusing on the time prior to accretion, Gyr Gyr. The figure shows a correlation between thin disk fraction and the increase in angular momentum alignment prior to accretion, suggesting that achieving angular momentum coherence in the CGM is conducive to the formation of thin disks.
4 Discussion
In this paper we analyze the properties of gas accreting onto galaxies simulated in FIRE, focusing on Milky-Way mass galaxies in which new stars form in a thin disk. We find that thin disk galaxies in FIRE accrete via ‘rotating cooling flows’, which is a type of ‘hot accretion’. In this accretion mode the quasi-spherical CGM phase inflows towards the galaxy, remaining hot down to the radius where its angular momentum is sufficient to provide rotational support. At this radius (, just outside the galaxy radius) the hot inflow both decelerates and becomes coherently rotating, and then simultaneously cools and collapses into a rotating cool disk. Our results thus extend classic cooling flow theory by demonstrating their applicability in realistic cosmological simulations, and by exploring the mechanics of cooling flows with angular momentum, a subject which has not yet been studied extensively (Cowie et al., 1980; Stern et al., 2020, c.f.). Moreover, we find a strong correlation between the prevalence of this accretion mode and the fraction of stars in the central galaxies that form in a thin disk, potentially indicating that a rotating cooling flow is a necessary condition for the formation of a thin star-forming disk. In this section we discuss several interpretations, caveats, and implications of our results.
4.1 Why are rotating cooling flows conducive to thin disk formation?
A main result of our analysis is that when accretion occurs via rotating cooling flows, the accreted gas forms a coherently rotating disk prior to cooling and accreting onto the ISM. This is due to the decrease in angular momentum dispersion prior to cooling (Figs. 8–10, and panels A–B in Fig. 6) and due to the deceleration of the flow prior to accretion (panel D in Fig. 3). Combined, these two properties indicate that upon accretion the flow is already in a coherent disk with and . In contrast, in other accretion modes (such as cold streams and precipitation) the inflow may reach the ISM with a large dispersion in angular momentum and substantial radial momentum, so equilibration will start only after accretion onto the ISM. That stars in FIRE galaxies which are fed by cool accretion form in irregular distributions for many Gyrs (Figures 7 and 16) suggests that equilibration in the ISM alone may be insufficient to form a thin disk, and hence equilibriation in the CGM as we find in galaxies fed by rotating cooling flows is conducive to the formation of thin disks.
Why is equilibration in the ISM alone insufficient to form a thin disk in FIRE? Equilibration is expected to proceed on a dynamical timescale ( Myr), which is short relative to the star formation timescale of Gyr (e.g. Fig. 3; Bigiel et al. 2008). However, some stars may succeed in forming while the accreting gas morphology is still a thick disk or irregular. Such stars inject feedback momentum and energy into their surroundings which could further delay the equilibration process, allowing even more stars to form outside of a thin disk.
The tendency of hot inflows to decelerate and rotate coherently prior to accretion is potentially a result of the subsonic nature of the flow. In a subsonic flow gradual deceleration prior to accretion is expected since the inflow is ‘forewarned’ (via changes in pressure) of the transition to rotational support at the galaxy scale. This is in contrast with supersonic accretion modes where the accreting gas is expected to shock and halt abruptly at the galaxy scale. Also, subsonic accretion makes it easier for the flow to reach angular momentum coherence, since the inflow timescale is longer than the sound-crossing timescale on which coherence can be achieved. In contrast, in supersonic, free-falling accretion flows as we find in low mass galaxies, the accretion and coherence timescales are both comparable to the dynamical time and hence comparable to each other, so coherence is not achieved in the CGM.
Panels A–B in Fig. 6 and Figs. 8–10 demonstrate that angular momentum coherence is achieved in hot inflows just before cooling and accretion, roughly at the rotational support radius (defined via , where is the net angular momentum in the flow), rather than farther out in the halo. Since the hot inflow is subsonic at all radii, this result suggests that a dynamical timescale longer than the sound-crossing timescale is not, on its own, a sufficient condition for the flow to achieve angular momentum coherence. We suspect that coherence is achieved specifically near because of the relation between average rotation speed and subsonic turbulence in the hot CGM, where the latter is driven by e.g., clumpy cosmological accretion, stirring by subhalos, and feedback from the galaxy. To understand this, we can look at the relative magnitude of angular momentum fluctuations due to turbulence , where is the turbulent velocity. For subsonic turbulence with a mach number of say we have , since the sound speed in hot inflows is roughly equal to . Combining this with the definition of and the conservation of in the inflow (Fig. 6, panel B), we get that angular momentum fluctuations are of order . Thus, for subsonic turbulence the relative magnitude of angular momentum fluctuations will be small at , but could be large at larger radii, as found above. We defer further exploration of this potential relation between turbulence and angular momentum coherence to future work.
We note that accretion via a rotating cooling flow does not ensure a thin disk forms. A merger, a strong feedback event, or other disruptions may take a thin gaseous disk and disturb it, preventing stars from forming in a thin disk. Simulation m12m provides an example of this: it has rotating cooling flow accretion comparable to thin disk galaxies (), but has a relatively small (circled point in Fig. 5) due to the presence of a bar. However, the strong correlation seen in Fig. 5 between the prevalence of rotating cooling flow accretion (quantified via ) and the thin disk fraction suggests that such events are relatively rare.
4.2 When and where do we expect thin disks?

The scenario suggested by this paper, that thin star forming disks are a result of accretion via rotating cooling flows, allows us to predict at which halo masses and redshifts we expect thin disks to form. At low redshift, cooling flows are expected if a time-steady and pressure-supported ‘virialized CGM’ has formed, which occurs when the cooling time of hot shocked CGM gas exceeds the free-fall time , typically at halo masses above a threshold of (White & Rees, 1978; White & Frenk, 1991; Birnboim & Dekel, 2003, e.g.,). The existence of cooling flows also requires that radiative cooling in this hot gas is not balanced by feedback. While there is evidence for feedback balancing radiative cooling in group and cluster halos, at which the cooling rate implied by X-ray observations greatly exceeds the central galaxy SFR (i.e., halos with a ‘cooling flow problem’, see McDonald et al. 2018 for a recent study), there is no similar evidence for a cooling flow problem in the halos of disk galaxies (Li et al., 2014), though uncertainties are still large due to the weak X-ray emission from the hot gas at this mass scale. Cooling flows in the low redshift universe are thus possible at intermediate masses, where on one hand the halo is massive enough so the CGM has virialized, but on the other hand the halo is not so massive that X-ray observations rule them out.
Stern et al. (2020) recently refined the classic condition for the existence of cooling flows, by showing that even if a virialized CGM exists in the outer halo the resulting cooling flow may go through a sonic point and reach the galaxy as cool supersonic accretion. Thus, to produce cooling flows that remain hot and subsonic down to the galaxy scale as found above for thin disk galaxies, a more specific condition should be satisfied, namely that exceeds at an inner CGM radius of , i.e. subsonic cooling flow requires that the inner CGM is virialized. In our simulation sample, the condition at is met at (Stern et al. 2021a). Fig. 11 shows the relationship between thin disk fraction and virial mass (left panel), at (middle panel), and dark-matter spin parameter in our sample of FIRE galaxies. Markers are colored by , a measure of the dominance of rotating cooling flows in accreting gas (Fig. 5). The figure shows that thin disks and rotating cooling flows appear at and , consistent with the expectation noted above that cooling flows and hence thin disks commence only when the inner CGM virializes. This mass scale for thin disk formation is however somewhat larger than in observations, as further discussed in section 4.5. While thin disk fraction does correlate with mass scale, the dark-matter mass and angular momentum properties alone are likely insufficient to predict galaxy morphology, as indicated by the lack of correlation between the dark-matter spin parameter and .
How does thin disk formation depend on redshift? While the threshold of inner CGM virialization in FIRE is roughly independent of redshift (Stern et al., 2021a; Stern et al., 2021b), at cold streams may penetrate the hot halo and dominate the accretion (Kereš et al., 2005; Dekel & Birnboim, 2006; Dekel et al., 2009, e.g.,), and thus if thin disks form as a result of hot accretion as suggested in this work they would be rarer at high redshift. Alternatively, thin disks could be rarer at high redshift due to evolving gas fractions, since in equilibrium disk models the thickness of the disk scales with gas fraction (Thompson et al., 2005; Faucher-Giguère et al., 2013; Krumholz et al., 2018). These predictions are consistent with morphological and kinematic observations of galaxy samples, where thin disks are found mainly at and intermediate galaxy masses (Kassin et al., 2012a; van der Wel et al., 2014, e.g.,).
4.3 Comparison to other models for the hot CGM
Our result that the inner CGM of Milky-Way mass galaxies forms a rotating cooling flow can be compared to other models for the hot CGM of Milky Way-like galaxies. In both the precipitation-regulated model of Sharma et al. (2012) and Voit et al. (2017) and the isentropic model of Faerman et al. (2020), the expected inflow induced by radiation is suppressed due to a balance between radiative cooling and heating by feedback (‘thermal balance’), and the hot gas is in hydrostatic equilibrium. Our results based on the FIRE simulations suggest a different scenario, where the hot CGM is not in thermal balance but rather inflows on a cooling timescale as expected from classic cooling flow solutions. This implies that stellar feedback in Milky-Way mass galaxies in FIRE is insufficient to disrupt the cooling flow, consistent with the weak outflows at this mass and redshift scale in the FIRE simulations (Muratov et al., 2015; Muratov et al., 2017; Anglés-Alcázar et al., 2017; Pandya et al., 2021) and in observations (Heckman & Thompson, 2019, e.g.,). The potential effects of AGN feedback, not implemented in the FIRE sample used in this work, are further discussed in section 4.5. We note though that even in cooling flows the pressure profile of the hot CGM is consistent with hydrostatic equilibrium to zeroth-order, with relatively small deviations of order (Stern et al., 2019).
Our results also differ from precipitation models in that the hot inflow dominates the accretion onto disk galaxies, rather than accretion by cool clouds condensed from the hot medium (Figures. 7 and 15, see also Esmerian et al. 2021). We expect this dominance of hot inflows to be robust to resolution effects despite that the formation of cool clouds in simulations depends on resolution (McCourt et al., 2018; Mandelker et al., 2019; Mandelker et al., 2021; Fielding et al., 2020, e.g.). This follows since the hot gas accretes on the cooling timescale (§3.4), i.e., the same timescale on which thermal instabilities grow. Thermal instabilities in an inflowing hot CGM thus do not have time to grow substantially, as indicated by idealized calculations of cooling flows (Balbus & Soker, 1989; Stern et al., 2019). A systematic resolution test of this result is however beyond the scope of this paper.
It is also interesting to compare our results to the calculations of Pezzulli et al. (2017) and Sormani et al. (2018), who considered the effect of angular momentum support on the structure of a hot CGM which is hydrostatic except for the rotation component. Since cooling flows are also hydrostatic to zeroth-order as mentioned above, they are expected to satisfy similar constraints on their pressure profiles as in these previous models (see eqn. 1 in Sormani et al. 2018). Our results however suggest another constraint on the hot CGM structure which was not considered by these previous studies – the radial distribution of the net angular momentum is flat, since the hot CGM conserves angular momentum as it inflows (Fig. 6, panel B). We defer building idealized hot CGM models which satisfy this additional constraint to future work.
4.4 Analogous accretion in cosmic ray-dominated haloes
The dark grey line in Fig. 7 shows the median properties of accreting gas in a simulation that includes cosmic ray physics (Chan et al., 2019; Hopkins et al., 2020, m12i_cr;), thus providing a window into the differences in gas accretion modes in simulations with cosmic-ray (CR) support in the CGM. The accretion onto the central galaxy in the cosmic ray-dominated halo is similar to rotating cooling flows in many aspects: accreting gas gains coherence in the halo, becomes rotationally supported at the galaxy edge (with a decreased radial velocity), and subsequently collapses into a disk. These properties were highlighted also by Trapp et al. (2021), who performed an analysis on the accretion of gas onto MW-mass disk galaxies with CR-dominated haloes. Consistent with our results, Trapp et al. found that accretion onto MW-mass disks has the same qualitative behavior, regardless of whether or not the halo is CR-dominated. However, the top left panel of Fig. 7 demonstrates that accreting gas in CR-dominated haloes never shocks to a temperature K — instead the median temperature for the CR-dominated halo is K. This is because in m12i_cr the CGM is not supported against gravity by thermal pressure, but rather by CR pressure (Ji et al., 2020).
Increased coherence and decreased radial velocity prior to accretion are the two properties of rotating cooling flows we identify as promoting thin disk formation (§4.1), and are clearly present in m12i_cr (Fig. 7). Consistent with this, m12i_cr has a high thin disk fraction, . In §4.1 we argue that the coherent co-rotation and deceleration of rotating cooling flows is a result of its subsonic nature. The accreting gas in the CR-dominated halo is also effectively subsonic — gas velocities are below the effective sound speed and therefore have properties characteristic of subsonic gas. The effective sound speed is defined as part of the local strong-coupling approximation used for the subgrid cosmic ray physics prescription, wherein the total pressure used to determine gas trajectories is a combination of hydrodynamic and CR pressure () and the sound speed is (Hopkins et al., 2020). Cool K accreting gas can therefore act subsonic, and thus be conducive to thin disk formation, as long as is sufficiently large. The qualitatively similar behavior between both rotating cooling flows and accretion in CR-dominated haloes may suggest that these accretion modes are a subset of a more general form of disk-conducive subsonic accretion.
4.5 Caveats
In our MW-mass haloes the average SFR over is SFR yr, while the observationally-based average SFR for haloes over the same redshift range is a lower SFR yr (Behroozi et al., 2013). Since one component that regulates the SFR is the gas accretion rate onto the galaxy, this may suggest that our simulations have higher accretion rates from the CGM onto the galaxy than in real galaxies at the same mass scale. The CGM accretion rate in FIRE may be reduced if the cooling flow is disrupted by additional physics implemented in some other suites of FIRE simulations, including cosmic rays (Chan et al., 2019; Hopkins et al., 2020; Hopkins et al., 2021a; Hopkins et al., 2021b) and AGN feedback (Wellons et al., 2022). It is however unclear whether additional processes such as these can disrupt cooling flows around MW-way mass galaxies. For example, CR transport models remain highly uncertain, especially in the CGM (Hopkins et al., 2021c; Quataert et al., 2021a; Quataert et al., 2021b), and it is not yet known how AGN feedback couples to halo gas. Moreover, if AGN feedback is intermittent, it is possible that a rotating cooling flow could reform between bursts of AGN feedback, especially at small CGM radii as analyzed above where cooling and dynamical times are relatively short.
An alternative solution to the elevated accretion rate problem is that the cooling flow is not disrupted, but just weaker than in FIRE, as expected if the CGM mass or metallicity are overpredicted in FIRE at . This follows since in a cooling flow , where and are the CGM mass and metallicity, respectively, while is the cooling function. Thus, if the CGM mass is overpredicted by a factor of two then and the SFR would be overestimated by a factor of four. Both the CGM mass and metallicity are a result of the integrated enrichment and depletion of the CGM by outflows over cosmic time, and thus are uncertain (Davies et al., 2021; Kelly et al., 2021, e.g.,).
A lower CGM mass or metallicity may also help address the difference between the mass threshold for rotational support in FIRE and in observations. At , FIRE galaxies have significant rotational support () above , higher than in observations which find rotationally-supported galaxies above (Wheeler et al. 2016; El-Badry et al. 2018a; El-Badry et al. 2018b, see also Peebles 2020). A lower or would imply a higher and for a given halo mass, thus decreasing the mass threshold for inner CGM virialization. The latter effect would cause the onset of cooling flows and the formation of thin disks to occur at lower halo masses than suggested by Fig. 11. At , a factor of a few increase in relative to that in FIRE would decrease the threshold halo mass in which the inner CGM virializes to (Stern et al., 2021a), corresponding to a threshold stellar mass for thin disk formation of similar to the observed value.
This difference between observed and simulated CGM mass or metallicity, as well as the general picture of rotating cooling flows, can be tested by comparison with CGM observations. The analysis of Stern et al. (2019) suggests that a cooling flow model with yr-1, roughly equal to the accretion rate needed to sustain star formation in the Galaxy, is consistent with X-ray absorption and emission observations in the Milky-Way CGM. Also, in line with the above scenario where FIRE somewhat overpredicts , some estimates of the CGM mass based on X-ray observations find (Li et al., 2018; Bregman et al., 2018), where is the cosmological baryon fraction multiplied by the halo mass. This is lower than for similar-mass FIRE haloes (Hafen et al., 2019). However, other studies deduce a higher based on the same X-ray data (Faerman et al., 2020), while Chan et al. (2021) find X-ray emission in FIRE is at the low end of the observed distribution when matching simulated and observed galaxies by their SFR. We defer a more direct comparison of the predictions of the rotating cooling flow model realized in FIRE with observations to future work.
5 Summary
In this paper we use the particle-tracking method developed in Hafen et al. (2019); Hafen et al. (2020) to study how gas accretes onto galaxies in the FIRE-2 cosmological zoom simulations (Hopkins et al., 2018), focusing on Milky-Way mass galaxies in which stars form in a thin disk. Our main results are as follows.
- 1.
Mechanics of rotating cooling flows at : We find that gas accretion onto thin disk galaxies in FIRE is dominated by rotating cooling flows, wherein the hot CGM forms a subsonic and angular momentum-conserving inflow down to the galaxy-halo interface, at which it cools to K (Figs. 3 and 6). Cooling occurs at the radius where rotational support in the flow becomes substantial, and is concurrent with flattening of the flow, i.e. the flow transitions rapidly from a quasi-spherical hot medium into a cool thin disk (Figs. 2 and 4). Prior to cooling and flattening, the hot flow decelerates and becomes coherently rotating with a narrow angular momentum distribution (Figs. 8– 10), properties which we attribute to the subsonic nature of the flow (§ 4.1). Our results thus extend classic cooling flow theory by demonstrating rotating cooling flows are a primary accretion mode for many cosmologically-simulated galaxies, and by further exploring the mechanics of cooling flows with angular momentum beyond previous studies (Cowie et al., 1980; Stern et al., 2020). Also, the inflowing nature of the hot CGM phase surrounding disk galaxies in FIRE is in contrast with the common assumption that the hot CGM is static (Maller & Bullock, 2004; Sharma et al., 2012; Voit et al., 2017; Faerman et al., 2017; Faerman et al., 2020, e.g.,).
- 2.
Relation between rotating cooling flows and thin stellar disks: We find that across a sample of 17 galaxies spanning , there is strong correlation between the dominance of cooling flow accretion and the fraction of stars formed in a thin disk in the central galaxy (Figs. 4–5, Fig 10). This expands the result of Stern et al. (2021a), which found a relation between the formation of disks and the virialization of the inner CGM in FIRE, where the latter is a necessary condition for the onset of cooling flows. We theorize that rotating cooling flows are conducive to the formation of thin disks since these flows achieve coherent, purely rotating kinematics prior to cooling to K, and thus before any star-formation in the accreting gas takes place (Fig. 3, §4.1). If rotating cooling flows are indeed a requirement for forming thin disks, then we expect thin disks mainly in relatively massive star-forming galaxies in which the CGM has virialized or is composed of subsonic gas, and at low redshift where cold streams are not expected to dominate the accretion. These trends are qualitatively consistent with observations which shows that thin disk morphologies are prevalent mainly in high mass and low-redshift star forming galaxies (Kassin et al., 2012a; Simons et al., 2017).
Acknowledgements
ZH was supported by a Gary A. McCue postdoctoral fellowship at UC Irvine. JS was supported by the Israel Science Foundation (grant No. 2584/21) and by the German Science Foundation via DIP grant STE 1869/2-1 GE 625/17-1. JSB was supported by NSF grant AST-1910346. ABG was supported by an NSF-GRFP under grant DGE-1842165 and was additionally supported by NSF grants DGE-0948017 and DGE-145000. SY was supported by NSF grant AST-1910346. CAFG was supported by NSF through grants AST-1715216, AST-2108230, and CAREER award AST-1652522; by NASA through grant 17-ATP17-0067; by STScI through grant HST-AR-16124.001-A; and by the Research Corporation for Science Advancement through a Cottrell Scholar Award. DBF is supported by the Simons Foundation through the Flatiron Institute. DAA was supported in part by NSF grants AST-2009687 and AST-2108944 and by the Flatiron Institute, which is supported by the Simons Foundation. EQ was supported in part by a Simons Investigator grant from the Simons Foundation and NSF grant 2107872. AW received support from: NSF grants CAREER 2045928 and 2107772; NASA ATP grant 80NSSC20K0513; HST grants AR-15809 and GO-15902 from STScI; a Scialog Award from the Heising-Simons Foundation; and a Hellman Fellowship. MBK acknowledges support from NSF CAREER award AST-1752913, NSF grants AST-1910346 and AST-2108962, NASA grant NNX17AG29G, and HST-AR-15006, HST-AR-15809, HST-GO-15658, HST-GO-15901, HST-GO-15902, HST-AR-16159, and HST-GO-16226 from the Space Telescope Science Institute, which is operated by AURA, Inc., under NASA contract NAS5-26555. JM gratefully acknowledges sabbatical leave support from Pomona College and the Harry and Grace Steele Foundation. RF acknowledges financial support from the Swiss National Science Foundation (grant no PP00P2_194814 and 200021_188552). TKC is supported by Science and Technology Facilities Council (STFC) astronomy consolidated grant ST/P000541/1 and ST/T000244/1. CT and DK were supported by NSF grants AST-1715101 and AST-2108314. Numerical calculations were performed on the Quest computing cluster at Northwestern University, the Wheeler computing cluster at Caltech, XSEDE allocations TG-AST130039, TG-AST120025, TG-AST140064, and TG-AST140023, Blue Waters PRAC allocation NSF.1713353, NASA HEC allocation SMD16-7592, and allocations AST21010 and AST20016 supported by the NSF and TACC. This research benefited from the Halo21 KITP workshop which was supported in part by the National Science Foundation under Grant No. NSF PHY-1748958.
This research used the Python programming language and the following modules: Firefly (Geller & Gurvich, 2018), Numpy (Harris et al., 2020), Matplotlib (Hunter, 2007), pytest (Krekel et al., 2004), Jug (Coelho, 2017), h5py (Collette, 2013), SciPy (Virtanen et al., 2020), pandas (McKinney, 2010; Reback et al., 2020), palettable (https://github.com/jiffyclub/palettable), and Numba (Lam et al., 2015).
Data availability
The data underlying this article will be shared on reasonable request to the corresponding author (ZH). The simulation initial conditions, snapshot files, and visualization can be found in https://fire.northwestern.edu/data/. A public version of the GIZMO simulation code is available http://www.tapir.caltech.edu/ phopkins/Site/GIZMO.html.
References
- Anglés-Alcázar et al. (2017) Anglés-Alcázar D., Faucher-Giguère C.-A., Kereš D., Hopkins P. F., Quataert E., Murray N., 2017, Monthly Notices of the Royal Astronomical Society, 470, 4698
- Armillotta et al. (2016) Armillotta L., Fraternali F., Marinacci F., 2016, Monthly Notices of the Royal Astronomical Society, 462, 4157
- Balbus (1988) Balbus S. A., 1988, The Astrophysical Journal, 328, 395
- Balbus & Soker (1989) Balbus S. A., Soker N., 1989, The Astrophysical Journal, 341, 611
- Barnes & Efstathiou (1987) Barnes J., Efstathiou G., 1987, ApJ, 319, 575
- Behroozi et al. (2013) Behroozi P. S., Wechsler R. H., Conroy C., 2013, The Astrophysical Journal, 770, 57
- Benincasa et al. (2020) Benincasa S. M., et al., 2020, Monthly Notices of the Royal Astronomical Society, 497, 3993
- Bernardi et al. (2010) Bernardi M., Shankar F., Hyde J. B., Mei S., Marulli F., Sheth R. K., 2010, MNRAS, 404, 2087
- Bertschinger (1989) Bertschinger E., 1989, The Astrophysical Journal, 340, 666
- Bigiel et al. (2008) Bigiel F., Leroy A., Walter F., Brinks E., de Blok W. J. G., Madore B., Thornley M. D., 2008, The Astronomical Journal, 136, 2846
- Birnboim & Dekel (2003) Birnboim Y., Dekel A., 2003, Monthly Notices of the Royal Astronomical Society, 345, 349
- Bizyaev et al. (2021) Bizyaev D., Makarov D. I., Reshetnikov V. P., Mosenkov A. V., Kautsch S. J., Antipova A. V., 2021, arXiv:2105.11855 [astro-ph]
- Bluck et al. (2014) Bluck A. F. L., Mendel J. T., Ellison S. L., Moreno J., Simard L., Patton D. R., Starkenburg E., 2014, Monthly Notices of the Royal Astronomical Society, 441, 599
- Bregman et al. (2018) Bregman J. N., Anderson M. E., Miller M. J., Hodges-Kluck E., Dai X., Li J.-T., Li Y., Qu Z., 2018, The Astrophysical Journal, 862, 3
- Brook et al. (2011) Brook C. B., et al., 2011, Monthly Notices of the Royal Astronomical Society, 415, 1051
- Bullock et al. (2001) Bullock J. S., Dekel A., Kolatt T. S., Kravtsov A. V., Klypin A. A., Porciani C., Primack J. R., 2001, The Astrophysical Journal, 555, 240
- Chan et al. (2018) Chan T. K., Kereš D., Wetzel A., Hopkins P. F., Faucher-Giguère C.-A., El-Badry K., Garrison-Kimmel S., Boylan-Kolchin M., 2018, Monthly Notices of the Royal Astronomical Society, 478, 906
- Chan et al. (2019) Chan T. K., Kereš D., Hopkins P. F., Quataert E., Su K.-Y., Hayward C. C., Faucher-Giguère C.-A., 2019, Monthly Notices of the Royal Astronomical Society, 488, 3716
- Chan et al. (2021) Chan T. K., Keres D., Gurvich A. B., Hopkins P., Trapp C., Ji S., Faucher-Giguere C.-A., 2021, arXiv:2110.06231 [astro-ph]
- Coelho (2017) Coelho L. P., 2017, Journal of Open Research Software, 5, 30
- Collette (2013) Collette A., 2013, Python and HDF5. O’Reilly
- Cowie et al. (1980) Cowie L. L., Fabian A. C., Nulsen P. E. J., 1980, Monthly Notices of the Royal Astronomical Society, 191, 399
- Danovich et al. (2012) Danovich M., Dekel A., Hahn O., Teyssier R., 2012, Monthly Notices of the Royal Astronomical Society, 422, 1732
- Danovich et al. (2015) Danovich M., Dekel A., Hahn O., Ceverino D., Primack J., 2015, Monthly Notices of the Royal Astronomical Society, 449, 2087
- Davies et al. (2021) Davies J. J., Crain R. A., Pontzen A., 2021, Monthly Notices of the Royal Astronomical Society, 501, 236
- DeFelippis et al. (2017) DeFelippis D., Genel S., Bryan G. L., Fall S. M., 2017, The Astrophysical Journal, 841, 16
- DeFelippis et al. (2020) DeFelippis D., Genel S., Bryan G. L., Nelson D., Pillepich A., Hernquist L., 2020, ApJ, 895, 17
- Debattista et al. (2019) Debattista V. P., Gonzalez O. A., Sanderson R. E., El-Badry K., Garrison-Kimmel S., Wetzel A., Faucher-Giguère C.-A., Hopkins P. F., 2019, Monthly Notices of the Royal Astronomical Society, 485, 5073
- Dekel & Birnboim (2006) Dekel A., Birnboim Y., 2006, Monthly Notices of the Royal Astronomical Society, 368, 2
- Dekel et al. (2009) Dekel A., et al., 2009, Nature, 457, 451
- Dekel et al. (2019) Dekel A., Lapiner S., Dubois Y., 2019, arXiv:1904.08431
- El-Badry et al. (2018a) El-Badry K., et al., 2018a, Monthly Notices of the Royal Astronomical Society, 473, 1930
- El-Badry et al. (2018b) El-Badry K., et al., 2018b, Monthly Notices of the Royal Astronomical Society, 477, 1536
- Esmerian et al. (2021) Esmerian C. J., Kravtsov A. V., Hafen Z., Faucher-Giguère C.-A., Quataert E., Stern J., Kereš D., Wetzel A., 2021, Monthly Notices of the Royal Astronomical Society, 505, 1841
- Fabian et al. (1984) Fabian A. C., Nulsen P. E. J., Canizares C. R., 1984, Nature, 310, 733
- Faerman et al. (2017) Faerman Y., Sternberg A., McKee C. F., 2017, The Astrophysical Journal, 835, 52
- Faerman et al. (2020) Faerman Y., Sternberg A., McKee C. F., 2020, ApJ, 893, 82
- Fall & Efstathiou (1980) Fall S. M., Efstathiou G., 1980, Monthly Notices of the Royal Astronomical Society, 193, 189
- Fall & Rees (1985) Fall S. M., Rees M. J., 1985, ApJ, 298, 18
- Faucher-Giguère et al. (2009) Faucher-Giguère C., Lidz A., Zaldarriaga M., Hernquist L., 2009, The Astrophysical Journal, 703, 1416
- Faucher-Giguère et al. (2011) Faucher-Giguère C. A., Kereš D., Ma C. P., 2011, Monthly Notices of the Royal Astronomical Society, 417, 2982
- Faucher-Giguère et al. (2013) Faucher-Giguère C.-A., Quataert E., Hopkins P. F., 2013, Monthly Notices of the Royal Astronomical Society, 433, 1970
- Faucher-Giguère et al. (2015) Faucher-Giguère C.-A., Hopkins P. F., Kere D., Muratov A. L., Quataert E., Murray N., 2015, Monthly Notices of the Royal Astronomical Society, 449, 987
- Faucher-Giguère et al. (2016) Faucher-Giguère C.-A., Feldmann R., Quataert E., Kereš D., Hopkins P. F., Murray N., 2016, Monthly Notices of the Royal Astronomical Society: Letters, 461, L32
- Fielding et al. (2017) Fielding D., Quataert E., McCourt M., Thompson T. A., 2017, Mon. Not. R. Astron. Soc., 466, 3810
- Fielding et al. (2020) Fielding D. B., Ostriker E. C., Bryan G. L., Jermyn A. S., 2020, The Astrophysical Journal, 894, L24
- Garrison-Kimmel et al. (2017) Garrison-Kimmel S., et al., 2017, Monthly Notices of the Royal Astronomical Society, 471, 1709
- Garrison-Kimmel et al. (2018b) Garrison-Kimmel S., et al., 2018b, Monthly Notices of the Royal Astronomical Society, 481, 4133
- Garrison-Kimmel et al. (2018a) Garrison-Kimmel S., et al., 2018a, MNRAS, 481, 4133
- Garrison-Kimmel et al. (2019) Garrison-Kimmel S., et al., 2019, Monthly Notices of the Royal Astronomical Society, 487, 1380
- Geller & Gurvich (2018) Geller A. M., Gurvich A., 2018, Astrophysics Source Code Library, p. ascl:1810.021
- Genel et al. (2015) Genel S., Fall S. M., Hernquist L., Vogelsberger M., Snyder G. F., Rodriguez-Gomez V., Sijacki D., Springel V., 2015, The Astrophysical Journal, 804, L40
- Gronke & Oh (2020) Gronke M., Oh S. P., 2020, Monthly Notices of the Royal Astronomical Society, 494, L27
- Guszejnov et al. (2020) Guszejnov D., Grudić M. Y., Offner S. S. R., Boylan-Kolchin M., Faucher-Giguère C.-A., Wetzel A., Benincasa S. M., Loebman S., 2020, Monthly Notices of the Royal Astronomical Society, 492, 488
- Hafen et al. (2019) Hafen Z., et al., 2019, Monthly Notices of the Royal Astronomical Society, 488, 1248
- Hafen et al. (2020) Hafen Z., et al., 2020, Monthly Notices of the Royal Astronomical Society, 494, 3581
- Harris et al. (2020) Harris C. R., et al., 2020, Nature, 585, 357
- Heckman & Thompson (2019) Heckman T. M., Thompson T. A., 2019, arXiv:1701.09062 [astro-ph]
- Hodges-Kluck et al. (2016) Hodges-Kluck E. J., Miller M. J., Bregman J. N., 2016, The Astrophysical Journal, 822, 21
- Hopkins (2015) Hopkins P. F., 2015, Monthly Notices of the Royal Astronomical Society, 450, 53
- Hopkins (2017) Hopkins P. F., 2017, Monthly Notices of the Royal Astronomical Society, 466, 3387
- Hopkins et al. (2014) Hopkins P. F., Keres D., Onorbe J., Faucher-Giguere C.-A., Quataert E., Murray N., Bullock J. S., 2014, Monthly Notices of the Royal Astronomical Society, 445, 581
- Hopkins et al. (2018) Hopkins P. F., et al., 2018, Monthly Notices of the Royal Astronomical Society, 480, 800
- Hopkins et al. (2020) Hopkins P. F., et al., 2020, Monthly Notices of the Royal Astronomical Society, 492, 3465
- Hopkins et al. (2021a) Hopkins P. F., Squire J., Chan T. K., Quataert E., Ji S., Keres D., Faucher-Giguere C.-A., 2021a, Monthly Notices of the Royal Astronomical Society, 501, 4184
- Hopkins et al. (2021b) Hopkins P. F., Chan T. K., Squire J., Quataert E., Ji S., Kereš D., Faucher-Giguère C.-A., 2021b, Monthly Notices of the Royal Astronomical Society, 501, 3663
- Hopkins et al. (2021c) Hopkins P. F., Chan T. K., Ji S., Hummels C. B., Kereš D., Quataert E., Faucher-Giguère C.-A., 2021c, Monthly Notices of the Royal Astronomical Society, 501, 3640
- Hunter (2007) Hunter J. D., 2007, Computing in Science Engineering, 9, 90
- Huscher et al. (2021) Huscher E., Oppenheimer B. D., Lonardi A., Crain R. A., Richings A. J., Schaye J., 2021, Monthly Notices of the Royal Astronomical Society, 500, 1476
- Ji et al. (2020) Ji S., et al., 2020, Monthly Notices of the Royal Astronomical Society, 496, 4221
- Joung et al. (2012) Joung M. R., Putman M. E., Bryan G. L., Fernández X., Peek J. E. G., 2012, The Astrophysical Journal, 759, 137
- Kassin et al. (2006) Kassin S. A., de Jong R. S., Weiner B. J., 2006, The Astrophysical Journal, 643, 804
- Kassin et al. (2012a) Kassin S. A., Devriendt J., Fall S. M., de Jong R. S., Allgood B., Primack J. R., 2012a, Monthly Notices of the Royal Astronomical Society, 424, 502
- Kassin et al. (2012b) Kassin S. A., et al., 2012b, The Astrophysical Journal, 758, 106
- Kelly et al. (2021) Kelly A. J., Jenkins A., Deason A., Fattahi A., Grand R. J. J., Pakmor R., Springel V., Frenk C. S., 2021, arXiv:2106.08618 [astro-ph]
- Kereš & Hernquist (2009) Kereš D., Hernquist L., 2009, The Astrophysical Journal, 700, L1
- Kereš et al. (2005) Kereš D., Katz N., Weinberg D. H., Davé R., 2005, Monthly Notices of the Royal Astronomical Society, 363, 2
- Kereš et al. (2009a) Kereš D., Katz N., Fardal M., Davé R., Weinberg D. H., 2009a, Monthly Notices of the Royal Astronomical Society, 395, 160
- Kereš et al. (2009b) Kereš D., Katz N., Davé R., Fardal M., Weinberg D. H., 2009b, Monthly Notices of the Royal Astronomical Society, 396, 2332
- Kranz et al. (2003) Kranz T., Slyz A., Rix H.-W., 2003, The Astrophysical Journal, 586, 143
- Kregel et al. (2002) Kregel M., Van Der Kruit P. C., De Grijs R., 2002, Monthly Notices of the Royal Astronomical Society, 334, 646
- Krekel et al. (2004) Krekel H., Oliveira B., Pfannschmidt R., Bruynooghe F., Laugher B., Bruhin F., 2004, pytest 3.4, https://github.com/pytest-dev/pytest
- Krumholz et al. (2018) Krumholz M. R., Burkhart B., Forbes J. C., Crocker R. M., 2018, Monthly Notices of the Royal Astronomical Society, 477, 2716
- Lam et al. (2015) Lam S. K., Pitrou A., Seibert S., 2015, Proceedings of the Second Workshop on the LLVM Compiler Infrastructure in HPC - LLVM ’15, pp 1–6
- Li & Bregman (2017) Li Y., Bregman J., 2017, The Astrophysical Journal, 849, 105
- Li et al. (2014) Li J.-T., Crain R. A., Wang Q. D., 2014, MNRAS, 440, 859
- Li et al. (2018) Li J.-T., Bregman J. N., Wang Q. D., Crain R. A., Anderson M. E., 2018, ApJ, 855, L24
- Lian et al. (2018) Lian J., Thomas D., Maraston C., Goddard D., Comparat J., Gonzalez-Perez V., Ventura P., 2018, Monthly Notices of the Royal Astronomical Society, 474, 1143
- Ma et al. (2017) Ma X., Hopkins P. F., Wetzel A. R., Kirby E. N., Anglés-Alcázar D., Faucher-Giguère C.-A., Kereš D., Quataert E., 2017, Monthly Notices of the Royal Astronomical Society, 467, 2430
- Maller & Bullock (2004) Maller A. H., Bullock J. S., 2004, Monthly Notices of the Royal Astronomical Society, 355, 694
- Mandelker et al. (2016) Mandelker N., Padnos D., Dekel A., Birnboim Y., Burkert A., Krumholz M. R., Steinberg E., 2016, Monthly Notices of the Royal Astronomical Society, 463, 3921
- Mandelker et al. (2018) Mandelker N., van Dokkum P. G., Brodie J. P., van den Bosch F. C., Ceverino D., 2018, The Astrophysical Journal, 861, 148
- Mandelker et al. (2019) Mandelker N., Nagai D., Aung H., Dekel A., Padnos D., Birnboim Y., 2019, Monthly Notices of the Royal Astronomical Society, 484, 1100
- Mandelker et al. (2020) Mandelker N., Nagai D., Aung H., Dekel A., Birnboim Y., van den Bosch F. C., 2020, Monthly Notices of the Royal Astronomical Society, 494, 2641
- Mandelker et al. (2021) Mandelker N., van den Bosch F. C., Springel V., van de Voort F., Burchett J. N., Butsky I. S., Nagai D., Oh S. P., 2021, arXiv:2107.03395 [astro-ph]
- Martin et al. (2019) Martin D. C., et al., 2019, arXiv
- Mathews & Bregman (1978) Mathews W. G., Bregman J. N., 1978, The Astrophysical Journal, 224, 308
- Mayor & Vigroux (1981) Mayor M., Vigroux L., 1981, Astronomy and Astrophysics, vol. 98, no. 1, May 1981, p. 1-8., 98, 1
- McCourt et al. (2012) McCourt M., Sharma P., Quataert E., Parrish I. J., 2012, Monthly Notices of the Royal Astronomical Society, 419, 3319
- McCourt et al. (2018) McCourt M., Oh S. P., O’Leary R. M., Madigan A.-M., 2018, Monthly Notices of the Royal Astronomical Society, 473, 5407
- McDonald et al. (2018) McDonald M., Gaspari M., McNamara B. R., Tremblay G. R., 2018, ApJ, 858, 45
- McKinney (2010) McKinney W., 2010, in Python in Science Conference. Austin, Texas, pp 56–61, doi:10.25080/Majora-92bf1922-00a
- McNamara & Nulsen (2007) McNamara B. R., Nulsen P. E. J., 2007, Annual Review of Astronomy and Astrophysics, 45, 117
- Mo et al. (1998) Mo H. J., Mao S., White S. D. M., 1998, MNRAS, 295, 319
- Moffett et al. (2016) Moffett A. J., et al., 2016, MNRAS, 457, 1308
- Murante et al. (2012) Murante G., Calabrese M., De Lucia G., Monaco P., Borgani S., Dolag K., 2012, The Astrophysical Journal Letters, 749, L34
- Muratov et al. (2015) Muratov A. L., Kereš D., Faucher-Giguère C.-A., Hopkins P. F., Quataert E., Murray N., 2015, Monthly Notices of the Royal Astronomical Society, 454, 2691
- Muratov et al. (2017) Muratov A. L., et al., 2017, Monthly Notices of the Royal Astronomical Society, 468, 4170
- Nelson et al. (2013) Nelson D., Vogelsberger M., Genel S., Sijacki D., Kereš D., Springel V., Hernquist L., 2013, Monthly Notices of the Royal Astronomical Society, 429, 3353
- Nelson et al. (2016) Nelson D., Genel S., Pillepich A., Vogelsberger M., Springel V., Hernquist L., 2016, Monthly Notices of the Royal Astronomical Society, 460, 2881
- Oppenheimer (2018) Oppenheimer B. D., 2018, Monthly Notices of the Royal Astronomical Society, 480, 2963
- Pandya et al. (2021) Pandya V., et al., 2021, arXiv
- Peebles (1969) Peebles P. J. E., 1969, ApJ, 155, 393
- Peebles (2020) Peebles P. J. E., 2020, Monthly Notices of the Royal Astronomical Society, 498, 4386
- Pezzulli & Fraternali (2016) Pezzulli G., Fraternali F., 2016, Monthly Notices of the Royal Astronomical Society, 455, 2308
- Pezzulli et al. (2017) Pezzulli G., Fraternali F., Binney J., 2017, Monthly Notices of the Royal Astronomical Society, 467, 311
- Planck Collaboration et al. (2018) Planck Collaboration et al., 2018, arXiv:1807.06209
- Quataert et al. (2021a) Quataert E., Thompson T. A., Jiang Y.-F., 2021a, arXiv:2102.05696 [astro-ph]
- Quataert et al. (2021b) Quataert E., Jiang Y.-F., Thompson T. A., 2021b, arXiv:2106.08404 [astro-ph]
- Reback et al. (2020) Reback J., et al., 2020, Pandas-Dev/Pandas: Pandas 1.0.3, Zenodo, doi:10.5281/zenodo.3715232
- Rohr et al. (2021) Rohr E., et al., 2021, arXiv:2112.05159 [astro-ph]
- Sales et al. (2012) Sales L. V., Navarro J. F., Theuns T., Schaye J., White S. D. M., Frenk C. S., Crain R. A., Dalla Vecchia C., 2012, Monthly Notices of the Royal Astronomical Society, 423, 1544
- Samuel et al. (2020) Samuel J., et al., 2020, Monthly Notices of the Royal Astronomical Society, 491, 1471
- Sanderson et al. (2020) Sanderson R. E., et al., 2020, The Astrophysical Journal Supplement Series, 246, 6
- Sharma et al. (2012) Sharma P., Mccourt M., Quataert E., Parrish I. J., 2012, Monthly Notices of the Royal Astronomical Society, 420, 3174
- Simons et al. (2015) Simons R. C., Kassin S. A., Weiner B. J., Heckman T. M., Lee J. C., Lotz J. M., Peth M., Tchernyshyov K., 2015, Monthly Notices of the Royal Astronomical Society, 452, 986
- Simons et al. (2017) Simons R. C., et al., 2017, The Astrophysical Journal, 843, 46
- Sormani et al. (2018) Sormani M. C., Sobacchi E., Pezzulli G., Binney J., Klessen R. S., 2018, Monthly Notices of the Royal Astronomical Society, 481, 3370
- Stern et al. (2019) Stern J., Fielding D., Faucher-Giguère C.-A., Quataert E., 2019, Monthly Notices of the Royal Astronomical Society, 488, 2549
- Stern et al. (2020) Stern J., Fielding D., Faucher-Giguère C.-A., Quataert E., 2020, Monthly Notices of the Royal Astronomical Society, 492, 6042
- Stern et al. (2021a) Stern J., et al., 2021a, ApJ, 911, 88
- Stern et al. (2021b) Stern J., et al., 2021b, Monthly Notices of the Royal Astronomical Society, 507, 2869
- Stevens et al. (2017) Stevens A. R. H., Lagos C. d. P., Contreras S., Croton D. J., Padilla N. D., Schaller M., Schaye J., Theuns T., 2017, Monthly Notices of the Royal Astronomical Society, 467, 2066
- Stewart et al. (2011) Stewart K. R., Kaufmann T., Bullock J. S., Barton E. J., Maller A. H., Diemand J., Wadsley J., 2011, The Astrophysical Journal, 738, 39
- Stewart et al. (2013) Stewart K. R., Brooks A. M., Bullock J. S., Maller A. H., Diemand J., Wadsley J., Moustakas L. A., 2013, The Astrophysical Journal, 769, 74
- Stewart et al. (2017) Stewart K. R., et al., 2017, The Astrophysical Journal, 843, 47
- Thompson et al. (2005) Thompson T. A., Quataert E., Murray N., 2005, The Astrophysical Journal, 630, 167
- Trapp et al. (2021) Trapp C., et al., 2021, arXiv:2105.11472 [astro-ph]
- Übler et al. (2014) Übler H., Naab T., Oser L., Aumer M., Sales L. V., White S. D. M., 2014, Monthly Notices of the Royal Astronomical Society, 443, 2092
- Van de Voort & Schaye (2012) Van de Voort F., Schaye J., 2012, Monthly Notices of the Royal Astronomical Society, 423, 2991
- Van de Voort et al. (2011) Van de Voort F., Schaye J., Booth C. M., Dalla Vecchia C., 2011, Monthly Notices of the Royal Astronomical Society, 415, 2782
- Virtanen et al. (2020) Virtanen P., et al., 2020, Nat Methods, 17, 261
- Voit (2021) Voit G. M., 2021, The Astrophysical Journal, 908, L16
- Voit et al. (2015) Voit G. M., Donahue M., O’Shea B. W., Bryan G. L., Sun M., Werner N., 2015, The Astrophysical Journal, 803, L21
- Voit et al. (2017) Voit G. M., Meece G., Li Y., O’Shea B. W., Bryan G. L., Donahue M., 2017, The Astrophysical Journal, 845, 80
- Wellons et al. (2022) Wellons S., et al., 2022, arXiv e-prints, p. arXiv:2203.06201
- Wetzel et al. (2016) Wetzel A. R., Hopkins P. F., Kim J.-h., Faucher-Giguère C.-A., Kereš D., Quataert E., 2016, The Astrophysical Journal, 827, L23
- Wheeler et al. (2016) Wheeler C., et al., 2016, Monthly Notices of the Royal Astronomical Society, 465, 2420
- White & Frenk (1991) White S. D. M., Frenk C. S., 1991, The Astrophysical Journal, 379, 52
- White & Rees (1978) White S. D. M., Rees M. J., 1978, Monthly Notices of the Royal Astronomical Society, 183, 341
- Yu et al. (2021) Yu S., et al., 2021, arXiv e-prints, 2103, arXiv:2103.03888
- van de Voort et al. (2011) van de Voort F., Schaye J., Booth C. M., Haas M. R., Dalla Vecchia C., 2011, Monthly Notices of the Royal Astronomical Society, 414, 2458
- van der Wel et al. (2014) van der Wel A., et al., 2014, ApJ, 792, L6
Appendix A Observationally-motivated thin disk fraction

Fig. 12 shows the relationship between the fraction of stars with at () and the same fraction of stars weighted by their Sloan band luminosity-weighted. The figure shows that , the thin disk metric used throughout our analysis, is closely related to the observationally-motivated luminosity-weighted thin disk fraction.
Appendix B Sample validation
Our main sample of tracked particles for each simulation (§2.2) selects particles which accrete from the CGM in the last Gyr prior to . In this appendix we check the extent to which our sample is representative of all gas that fuels star formation at , and the extent to which our sample is representative of all circumgalactic gas. We use the simulation m12i as a test case.
Fig. 13 shows the age of the universe at which particles in our main sample accrete onto the main galaxy, compared to the accretion time for all gas which forms stars in the last Gyr. To calculate for all recently-formed stars we track the history of randomly-selected star particles that formed within the last Gyr, and set to the time of the last accretion event. The distributions for the main sample and the sample probing all recently-formed stars largely overlap, indicating our selection method is representative of star forming gas in the last Gyr of the simulation.
Fig. 14 compares the properties of all gas in the CGM with the subset of gas which accretes onto the galaxy, where the latter corresponds to the main sample of tracked particles. The top panel shows that most of the accreted gas originates from the inner CGM, likely since cooling times in the hot phase are shorter at small radii. The distributions of specific angular momentum (2nd panel) and angular momentum alignment (3rd panel) are similar between the accreted gas and general CGM gas. The bottom panel shows that the median temperature of accreted gas and all CGM gas are similar at kpc, at which most of the accretion originates, with a tail extending to lower temperatures in the accreted gas. At larger radii the accreted gas is cooler than general CGM gas, suggesting that from these radii accretion is via cooling of clumps rather than via inflow of the hot medium. Similar results are found in Hafen et al. (2020).
Appendix C Instantaneous mass flow
In this appendix we analyze if inflow is dominated by hot or cold gas, which allows us to distinguish a hot inflow from the accretion of cool clouds (formed, e.g., via instabilities). Fig. 15 shows the mass inflow rate versus radius for hot gas (red curves; K) and for cool gas (blue curves; ), for the four simulations shown in Fig. 1. We calculate the mass inflow rate at a given radius as
| (3) |
where is the shell thickness, and the integration is done on all particles with centers within the shell which satisfy the appropriate temperature cut.
In the three MW-mass galaxies with a large thin disk fraction, at halo scales of kpc the inflow is dominated by hot gas, where in m12i and m12b of the hot gas is larger by a factor of than that of cool gas. The greater mass flux of hot gas indicates that the dominant form of accretion is an inflowing hot phase, rather than cold streams or cool clouds precipitating from the hot phase. In contrast, in the lower mass galaxy shown in the bottom right the inflow is dominated by cool gas, while the hot gas is outflowing out to kpc. Fig. 15 also shows that the inflow rate of hot gas in the MW-mass galaxies drops within , reflecting the cooling of the hot inflow at the galaxy-halo interface, as shown in §3.2.
Appendix D Notes on individual galaxies
We show the equivalent of Figs 3 and 6 for a representative irregular galaxy, m11d. Panel E shows that prior to the accreting gas has a very broad and unchanging distribution, in contrast with the narrowing angular momentum distribution of thin disk galaxies shown in the main text, and despite the total angular momentum being mostly aligned with the galaxy . The low thin disk fraction of in this galaxy is thus consistent with angular momentum coherence in accreted gas being necessary for thin disk formation. Other properties of the accretion onto m11d are apparent also in the sample average onto irregular galaxies (Fig. 7) and are discussed there.
Figures 17 and 18 show properties of accretion onto m12f (which was excluded from the averages in Fig. 7) relative to and respectively. Figure 17 shows that relative to the accreting gas has the same key characteristics as accretion onto other thin disk galaxies — inflow is hot in the CGM, and cooling is simultaneous with flattening, occuring when angular momentum support becomes significant. Also, panels E and H show that angular momentum coherence increases prior to cooling, while radiative cooling in the hot gas is offset by compression heating. By comparison, Fig. 18 shows that relative to many of the properties of m12f are qualitatively different from those relative to , in contrast with other thin disk galaxies. We suspect this difference is due to the relatively large specific angular momentum of accreted gas, which implies that the radius at which the accretion circularizes and cools is substantially larger than the galaxy radius, (see panel B in Fig. 17). As a result, gas reaches from within the disk, and quantities measured versus track the evolution of gas accretion within the disk, rather than the evolution of accretion in the CGM.
We also briefly discuss noticeable features of accretion onto additional specific galaxies. The haloes with intermediate thin disk fractions also have intermediate levels of change in accretion alignment upon cooling (Fig. 5). Four of these six haloes, m12z, m12r, m12w, and m12m, have . m12z has a chaotic halo with a number of ongoing mergers. m12r has some ongoing thin disk formation, but is undergoing a major merger during the last Gyr that dominates the accreting gas supply and disrupts the galaxy structure. This merger is relatively well-aligned with the disk, with , and the aligned mass fraction does not change significantly as the gas cools past . m12w is a galaxy where its inner CGM is only just virializing at (Yu et al., 2021), and the majority of the gas accretes with angular momentum perpendicular to the galaxy angular momentum. Of these four the one with the highest thin disk fraction, m12m, has a prominent stellar bar. m12m may be evidence that if rotating cooling flows are a condition for disk formation, they are a necessary-but-not-sufficient condition (§4.1). m12m is one of the few MW-mass halo simulations that does not include metal diffusion, which may also play a role in its morphology.