

Optimal selection of sample-size dependent common subsets of covariates for multi-task regression prediction
Abstract
An analyst is given a training set consisting of regression datasets of different sizes, which are distributed according to some , , where the distributions are assumed to form a random sample generated by some common source. In particular, the ’s have a common set of covariates and they are all labeled. The training set is used by the analyst for selection of subsets of covariates denoted by , whose role is described next.
The multi-task problem we consider is as follows: given a number of random labeled datasets (which may be in the training set or not) of size , , estimate separately for each dataset the regression coefficients on the subset of covariates and then predict future dependent variables given their covariates.
Naturally, a large sample size of allows a larger subset of covariates, and the dependence of the size of the selected covariate subsets on is needed in order to achieve good prediction and avoid overfitting. Subset selection is notoriously difficult and computationally demanding, and requires large samples; using all the regression datasets in the training set together amounts to borrowing strength toward better selection under suitable assumptions. Furthermore, using common subsets for all regressions having a given sample size standardizes and simplifies the data collection and avoids having to select and use a different subset for each prediction task. Our approach is efficient when the relevant covariates for prediction are common to the different regressions, while the models’ coefficients may vary between different regressions.
Last but not least, we propose a simple and meaningful measure, GENO, that allows comparisons of the predictive value of different subsets of covariates by comparing the sample size they require in order to achieve the same prediction error.
keywords
[class=MSC] 62J99keywords
random covariates , model selection , Mallows , equivalent number of observations (ENO) , GENO , transfer learning , overfittingFaculty of Industrial Engineering and Management,
Technion – Israel Institute of Technology, Haifa, Israel
??
Department of Statistics and
Center for the Study of Rationality
The Hebrew University, Jerusalem, Israel
??
Contents
Doc-Start section.1 subsection.1.1 subsection.1.2 subsection.1.3 section.2 subsection.2.1 subsection.2.2 subsection.2.3 subsection.2.4 subsection.2.5 section.3 subsection.3.1 subsection.3.2 subsection.3.3 section.4 subsection.4.1 subsection.4.2 section.5 subsection.5.1 subsection.5.2 subsection.5.3 section.6 subsection.6.1 subsection.6.2 subsection.6.3 subsection.6.4 section*.16 section.7 section.8
1 Introduction
1.1 A general description of the problem
This paper concerns data consisting of a class of regression datasets, and a multi-task of predictions in different regressions. The emphasis is on selection of common subsets of covariates for prediction in the different regressions, which depend on the regression datasets’ sample sizes. As documented in the classical model selection literature, the size or dimension of models for prediction should depend on the sample size, for example through a penalty function that depends on the dimension of the model and the sample size. References and further details will be provided following a description of our motivating problem.
In order to improve service, a hospital wants to develop a tool for predicting the actual duration of planned visits of any particular patient to any doctor in the hospital. Given a sample of size of different patients’ visits to any particular doctor ( can vary between doctors) with covariates such as the past durations of the patients’ visits, the nature of the visits, the time scheduled etc., and a response variable, which is the actual duration, the goal is to predict the duration of the next visit of a given patient to the particular doctor. Our objective is to select an optimal subset of covariates, denoted by , to be used for the prediction of a future visit’s duration. We shall provide a procedure that selects the optimal set with high probability. The number of covariates in the set depends naturally on , with a large allowing more variables in the regression, taking account of the need to find the right balance between efficiency of models, and the pitfall of overfitting. For any given , we want to select a standard set of covariates to be used for any doctor in the hospital for whom we have a regression dataset of size . However, we allow different regression coefficients for different doctors since different doctors may be influenced differently by the patient’s background. An intercept for each doctor represents her or his general tendency for longer or shorter visits.
Standardization is desirable for more than one reason, and will be discussed in more detail later. First, it obviously simplifies the data collection and maintenance. Second, performing separate model selection for each doctor may be computationally demanding. Third, model selection is notorious for being difficult and to require much data. The idea we present is to perform model selection on the basis of a sample of doctors as described below, and thus borrow strength from different datasets and obtain better subset selection.
In order to perform the subset selection we assume we have a training sample of doctors each consisting of a dataset containing the covariates and the response (actual duration) of visits, . Under certain assumptions, we use these data to select subsets of covariates for different value of . We then use the selected subset for prediction for any doctor (who in general may not be in the training sample) on the basis of a sample of visits (of some size ) as described above. When predicting for a doctor in the sample, say doctor , it is natural to take . The subset selection procedure and its properties are the focus of this paper.
One may suggest to concatenate the whole training sample and perform a single regression with the same coefficients for all doctors, but allowing a different intercept for each doctor. In certain cases this may result in good subset selection. However, suppose, for example, that for about half of the doctors the covariate “duration of previous visit” has a positive coefficient in the regression and for the other half it is negative. It is easy to conceive of a justification for each possibility. In this case, this covariate may not enter the model if the regression is computed by concatenating the data into a single model. However, allowing different regression coefficients for different doctors, the variable may enter the model and contribute to the prediction with a different coefficient for different doctors. Thus, allowing the regression coefficients to vary between individual regressions adds flexibility to the model, and in particular it improves the prediction in our dataset (verified by cross validation, see Section 6.4). Of course an informal screening of variables is often done, either at the stage of collecting the data, or before conducting formal variable selection and analysis. In particular, researchers may decide to avoid certain variables or interaction terms in order to keep the selection process feasible.
The classical theory of model selection in regression deals with the selection of a subset of covariates (or features) that are useful for prediction based on a single regression dataset. Numerous model selection methods have been suggested; AIC (Akaike 1974), Mallows (Mallows 1973), and FIC (Claeskens and Hjort 2003) are prominent examples. These methods apply to a single regression dataset of a given size, for which a model is to be selected and then used for prediction. For a well-known Bayesian approach to model selection, see Schwarz 1978. A large body of literature emerged following these articles. In the setup of a single dataset, serious issues of optimality arise; see, e.g., Yang 2005.
Breiman’s celebrated paper [4] starts with a similar training set of regression datasets with similar assumptions, however, both the subset of covariates and the regression coefficients used for prediction are common to all regressions. A very closely related setup appears in Obozinski, Taskar and Jordan 2010 which “addresses the problem of recovering a common set of covariates that are relevant simultaneously to several classification problems.” The paper focuses on classification or discrimination problems, but regression is also mentioned. References cited in this paper, which deal with the same problem, are referred to as “transfer learning” or “multi-task learning” in the machine learning literature. They demonstrate that learning multiple related tasks from data simultaneously can be advantageous in terms of predictive performance relative to learning these tasks independently. In Obozinski, Taskar and Jordan 2010 the goal is to decide which variables are “relevant to the overall class of prediction problems without making a commitment to a specific value of a parameter,” that is, allowing different parameters for the different prediction tasks, and to “borrow strength across multiple estimation problems in order to support a decision that a covariate is to be selected.” A large number of papers and review articles on multi-task learning have appeared, mostly in the past decade. For a recent survey containing numerous applications and references, see, for example, Zhang 2021. In the latter paper transfer learning refers (in our setup) to predicting for a single target file that may not be in the training sample, while multi-task learning refers to predicting for every dataset in the training sample. Here we consider both possibilities.
Our paper differs from Obozinski, Taskar and Jordan 2010 and more generally from the multi-task literature in several ways: our emphasis is on regression, our focus is not on algorithms but rather on asymptotic consistency and optimality type results; however, the main difference is that in the spirit of model selection, the selected common covariate subsets, depend on the sample sizes of the different regression prediction tasks, thus avoiding under and overfitting. The issue of different sample sizes appears in Zhang 2021 in a context where face databases have different image sizes; however the proposed solution is to project these databases to a common subspace, which results in loss of information, rather than taking the task size into account as we propose.
1.2 A formal setup
Our setup is formalized as follows. We assume we have a training sample of regression datasets all having the same set of covariates. Thus with , where is a column vector of random covariate values of the th subject in the th dataset, and is a response variable. For each , the vectors are iid from some distribution , where is a set (population) of distributions of size . We assume that , and that is a random sample from . Now consider a new regression dataset of some size , distributed according to , a random element of , which may but need not be in the training set . If is in then it is natural to assume that .
We consider the following task: for independent of the above datasets, we want to predict from a given using the sample . It is natural to be interested in the multi-task of prediction for many random ’s; however, it suffices to study the prediction error for one such . Since is random, we clearly need to consider different possible values of , and random covariates. Our treatment of random covariates is based on a generalization of Mallows to random covariates that was inspired by notes generously given to us by Larry Brown (see [5]).
As usual, the prediction model involves two components, the subset of variables to be used, and their regression coefficients. The regression coefficients will be estimated by standard least squares based on the sample , and thus will vary between ’s. For the subset selection, a task that is known to require large samples, we shall pool the whole training set. Such pooling can be efficient if the set of distributions , which may be finite or generated by a probability model (superpopulation model), is sufficiently homogeneous (to be discussed in Section 3) in a way that justifies a common model selection. Besides some technical conditions for such homogeneity, a user would have to apply common sense to decide if one can borrow strength and learn the subset selection from the pooled sample rather than from the individual dataset . As mentioned before, numerous examples appear in Zhang 2021 and the references therein. Our goal is to select for each possible value of , a subset of covariates based on the pooled training sample and use it for prediction, using least squares estimates, computed for each regression dataset separately. Thus, we select subsets for prediction that are common to all regressions having the same sample size, but we allow different parameters for the regressions.
Given a distribution , let be the conditional expectation under . We do not assume a linear model or any particular model for when we analyze our procedures, but for the sake of prediction we shall approximate by a linear function , where is the vector of projection coefficients under . We shall require minimal assumptions on such as moment conditions, to be specified later.
When is not linear then is not ancillary, and its marginal distribution matters; see, e.g, Buja et al. 2019. In this case, conditioning on or considering it as nonrandom leads to loss of information. For a recent discussion on fixed versus random in the context of model selection see Rosset and Tibshirani 2018. When , allowing linear models with different coefficients in different regressions is called heterogeneous regression ANCOVA; see, e.g., Rutherford 2001, Chapter 8, and the references therein. Related models appear under titles such as repeated measure regression (see, e.g., Vonesh and Chinchilli 1996), often with mixed effects.
Given datasets from , consider the subset of covariates of size . We may sometimes refer to as a model. Let denote the subvector of consisting of the covariates in . Let denote the linear projection coefficient vector and let be its least squares estimator based on observations, where we assume that . In Section 2.4 we discuss the case of discrete covariates in which exact (or perfect) multicollinearity may occur with a positive probability, and the least squares estimators are not unique.
For now we focus on the case that , that is we observe all datasets in . (In Section 3.3 we consider prediction of an out of (the training) sample dataset, in the spirit of transfer learning.) Consider prediction for a regression dataset of some size , often referred to as the task size, which will be taken to equal for the task of predicting for the dataset in the multi-task problem of prediction for datasets in the training sample. The linear prediction of a response , based on observations from a random , and when the subset is used is given by . In order to select a subset for regression tasks of size we make the counterfactual assumption that all datasets in the training sample are of size . Then the corresponding expected prediction error or risk is given by
| (1.1) |
where independently of , and the expectation on the right-hand side of (1.1) applies to both and . This expression has the alternative interpretation where instead of predicting for a random we predict for all , , assuming that there is a common sample size , and now represents the average prediction error. With either interpretation, our goal is to estimate and related quantities, in order to select (with high probability) an optimal common subsets for prediction for any dataset in the training set (taking ) and also for out of sample datasets when we later consider the case that , on the basis of observations, where the subset selection is based on the pooled training set .
It is natural to choose common subsets for prediction if the different regression datasets arise from a common source; besides efficiency in subset selection due to pooling, common subsets lead to computational efficiency. However, we assert that in a variety of situations (but obviously not always) it is advantageous to choose standard common sets of covariates to be used for prediction even if the regression datasets do not arise from a homogeneous source. In this case we are trying to select compromise subsets that can be used for the different regressions (and may not be optimal for some or any of them). For example, a large health organization with clinics often recommends a common standard set of tests for the purpose of certain diagnoses, thereby simplifying the instructions to participating clinics and doctors. In our notation, the set of tests is based on a sample of size , which is in general . The regression coefficients used for prediction based on this common set of tests may differ between communities or doctors, who may attach different weights to different tests. Concerning economics models, consider the OECD, where (as of 2021) since all countries are sampled and economic prediction are made in all of them. The OECD attempts to standardize sets of common economic indicators to be used for economic predictions (e.g., forecast of GDP growth) for its member countries, which are to be estimated by their bureaus of statistics by the same methodology. In general, it makes sense to assume that in different countries, economic variables may have different weights in economic predictions. For example, oil prices must weigh differently for economic predictions between oil importing and exporting countries.
1.3 GENO, a measure of usefulness
In order to compare the quality of different models, we introduce a new measure, GENO, which is inspired by the measure ENO (equivalent number of observations) of Erev, Roth, Slonim, and Barron 2007. To describe ENO in the context of experimental economics, consider an experiment where a game is played by a sample of subjects in order to study the average behavior of players, and predict future play. ENO is based on a comparison between the empirical statistics of past actions of the players, and a given model for predicting players’ actions. The more subjects who have already played the game, the better the estimate that past play will give of the mean behavior of the subject population on this game. ENO measures the usefulness of the prediction of a particular model by asking how many prior observations of subjects playing the game, say , would be needed to make the empirical statistics as accurate as the prediction by the model. ENO of a model is this number .
While ENO compares a given model to the relevant empirical model, GENO generalizes ENO to comparing any two data-based models. Thus, let now denote the prediction error of some model in a very general setup. For our present purposes, one can have regression models in mind, with defined above; however, the definition of GENO below is more general. Given two models and , define GENO to be the value of satisfying . In words, GENO is the number of observations required in order for a model based on the covariates in to predict equally well as a model based on the covariates in , when the parameters of the latter model are estimated on the basis of observations. In Section 4 we shall use an approximation to to formally define and estimate GENO. Such a measure allows us to decide between a set of covariates that may be good for prediction but costly to obtain, and another set of more accessible covariates that we may consider using, even if their predictive value is lower and therefore may require more observations. See the recent paper - Andrade et al. [2] and the references therein for a formal Bayesian approach to minimizing cost of classification in the presence of costly covariates. A comparison in terms of the sample size required by one model (for prediction, testing or estimation) to be as good as another with a given sample size is closely akin to the notion of Pitman efficiency; see, e.g., Zacks 1975. Our approach to quantifying the value of a model is close in spirit, but not in detail, to the work of Lindsay and Liu 2009 who define a “model credibility index” as the sample size , where data from the model and from the true generating process are indistinguishable in the sense that for a given goodness of fit test of the model with observations, the probability of rejection under the model is, say, 50%.
A different approach to measuring the usefulness of a model is by Akaike weights, which are defined by the likelihood function of each model evaluated at the MLE, standardized by their sum; see Anderson and Burnham 2002 (Page 75), where these weights are referred to informally as “the weight of evidence in favor of model.” The AIC weights are sometimes [27, e.g.,] interpreted as probabilities of a model to be the best in terms of the AIC criterion. With a uniform prior on the set of models this interpretation could be meaningful if we believe that one of the models is true. Otherwise, the weights are still informative, but their interpretation is less clear. GENO, on the other hand, is measured in units of number of observations, which are easy to grasp. Another advantage of GENO is that it accounts for the number of observations in the data to which the model is applied. This makes sense as the usefulness of a model for a given dataset is also a function of the size of the data.
In Section 2 we restate the problem and provide some basic results and notation for a single regression dataset, as a preliminary to the main part, Section 3, where we consider the multi-task problem of model selection for several regression datasets. In Section 4 we discuss the GENO measure of the relative quality of models. In Section 5 we demonstrate the results by simulations, and in Section 6 we discuss an application to a medical management problem of predicting service times, that is, visit durations of patients in hospital. Section 7 is an appendix containing the proofs. Appendix B summarizes the notation used in the paper.
2 Prediction error with random covariates: A single dataset
We start with , that is, with selection of a model for prediction given a training set consisting of a single regression dataset. This case is treated in the standard model selection literature. Although our real interest is in results for large , we consider as a starting point which simplifies the notation while allowing us to present some of the ideas used in the general case. For now our training set consists of a single dataset of iid pairs from some distribution . The distinction between and may seem artificial in this case, but we shall make it and consider prediction based on any sample size for later purposes. We use for selecting a subset of covariates for linear prediction of a future from distributed by , with parameters that will be estimated using a dataset of observations from .
We derive some results that will be needed for the general case , to be discussed in Section 3. Subsets of the covariates are denoted by letters like , , etc., and their sizes by and , etc. We refer to the associated linear model as model . For now we fix and suppress it in most of our notation and instead of we write and assume it is in . The same holds for other vectors and matrices. Later we shall assume that , and consider different subsets of covariates.
2.1 Preliminaries
Consider a dataset of iid pairs from some distribution , where is a column vector in , . Let without indexes denote one such “generic” observation, distributed independently of the dataset as any according to . The first entry of each may be 1, so that the models may include an intercept term.
Set and let denote the -column vector of the ’s, and set for some function . Assuming that both and have finite second moments and that is invertible, the best linear approximation of is , where
| (2.1) |
The same projection coefficient vector also satisfies ; hence is the best linear predictor of . Our assumptions imply that the minimizer is unique. Set , with defined in (2.1). By (2.25) in Hansen 2020, where most of our notation and the standard results we use can be found, we have , where again and are “generic” and .
Define to be the matrix whose rows are the row vectors . In this common notation the standard linear model will be written as , whereas each of its rows as , and . Under standard assumptions, the least squares estimator is
| (2.2) |
The assumption that exists (with probability 1) holds if we assume that has a continuous distribution. For the existence of certain moments required later we shall assume that the distribution of is a mixture of normals. See Hansen 2020, pp. 102–3, for a discussion of the existence of and its moments. Without assuming continuity, the assumption that is invertible implies that exists with probability converging to 1 as ; however, for discrete distributions this probability is smaller than one, and thus may not exist, and has no finite moments, a “conundrum” in the words of Hansen. In Section 2.4 we extend our discussion to discrete covariates by conditioning on the existence of a bounded inverse, and showing that under simple conditions this amounts to neglecting a set having an exponentially small probability, thus providing some solution to the above conundrum.
We now assume that exists and has sufficiently many moments so that expressions like (2.4) below are finite. If and have finite fourth moments, then by Theorem 7.3 in Hansen 2020
| (2.3) |
where , a matrix assumed to be positive definite. For a single distribution and a dataset as above, the prediction error incurred by a model based on all covariates with linear regression coefficients computed from a sample of size is
| (2.4) |
Later we assume that and set to be the vector consisting of the covariates of in the subset of covariates of size . When we consider several models, we set, for example, to be the matrix whose rows are the row vectors , , , and likewise for , etc. We then have
| (2.5) |
2.2 Equally good sequences of models
When selecting the best model for a given , that is, the subset of covariates that minimizes , we should take into account that different samples yield different estimators , leading to different prediction errors; thus, there is no gain in optimizing more precisely than the difference between such errors. Consider the prediction error conditioned on the estimated regression coefficients
Note that By using the relation , expanding the latter term, and taking conditional expectation noting that , we obtain
| (2.6) |
The first term in (2.6) is a constant and the second equals , which is of order since ; see (2.3). This means that varies between different by a quantity of order . Hence, if two sequences of models and satisfy
we consider them to be equally good. If is best in the sense of minimizing and is equally good, we say that is adequate, and rather than choose “best models” we settle for adequate models. See, e.g., Nevo and Ritov 2017 for a related approach.
2.3 Versions of Mallows for random covariates
Given a dataset of size (which constitutes the training set when ), we first estimate the prediction error (2.4) incurred if prediction is to be based on observations. We shall consider two types of asymptotics: one when is considered to be large, and the other when is fixed, and is large. For now ; asymptotics in will be considered later.
We use the following notation: set , and let denote the -vector of the ’s. Recalling the notation , let denote the -vector having components . Set with , where is given by (2.2) upon replacing by . Thus in (2.8) below, . Let , and . In addition we define . Note that is not a statistic and that since E implies that the expectations of mixed terms vanish. In all the vectors and matrices above and below the index was suppressed unless otherwise indicated.
Akin to (2.4), we define the approximate prediction error to be
| (2.7) |
where denotes trace, and equation (2.9) of Theorem 2.1 below shows that it is an approximation to the quantity of (2.4). Clearly and the trace is an approximation of the difference with precision of order ; see (2.9). Next we define the statistic as an estimator of by
| (2.8) |
The new term is an approximately (up to ) unbiased estimator of , as shown in (7) and (7.7). The fact that is a biased estimator of entails a bias of order for the estimator as an estimator of . We shall study the latter estimator, and when we use it, we shall apply a standard jackknife correction for its bias; see Efron 1982, Equation (2.8). We denote the bias-corrected by . It suffices to bias-correct only in (2.8) as explained in the fourth paragraph after Theorem 2.1.
The superscript in the statistic refers to the set of covariates in and for now we have and the subset is fixed and suppressed. The statistic is a counterpart of Mallows , but here we consider random covariates. Furthermore, we distinguish between the number of observations used for the choice of the model and the sample size of observations used for estimating the model’s parameters. The classic Mallows concerns nonrandom covariates, where , and the true model is assumed to be linear. To see the relation to Mallows , assuming a homoskedastic linear model, we have that is uncorrelated with the covariates, with variance , and , and therefore will converge to and to . If we use as an approximation of (and therefore we only have to estimate rather than a trace), then in the case coincides with Mallows .
The following theorem provides the rate of approximation of to , and then analyzes as an estimator of ; some of its conditions and implications are discussed below. All proofs are in the Appendix. Our proof shows that Assumption (i) below can be replaced by the assumption that and have 24 finite moments, and a careful inspection of the proof shows that this number can be somewhat reduced.
Theorem 2.1.
Assume that
(i) The coordinates of and have finite moments of all orders.
(ii) The entries of have third moments that are bounded uniformly in .
Then
| (2.9) |
and
| (2.10) |
where
| (2.11) |
Furthermore,
| (2.12) |
and
| (2.13) |
for some asymptotic variance as , and is fixed.
Since there is only a finite number of models, the above terms , , and do not depend on the subset of covariates . For example, we could replace (2.9) by for all and , where is a constant. Moreover, the term in (2.10) does not depend on .
Condition (i) of Theorem of 2.1 is standard, and Lemma 2.2 below shows that Condition (ii) is satisfied if is distributed as a mixture of normals; see Sampson 1974. Such mixtures form a dense family of distributions with respect to weak convergence in the space of distribution on . As the distribution of is never known exactly, it makes sense to assume, as an approximation, that the data satisfy such a condition. The case where has discrete components is discussed in Section 2.4.
We shall later compare models consisting of different subsets of covariates. Equation (2.9) suggests that choosing a model by minimizing a good estimate of with respect to can lead to a model for which is within of the best model, and thus is an adequate model in the sense of Section 2.2. This is stated formally in Proposition 2.4.
In view of (2.10) we use of (2.8) as an estimator of the approximate prediction error and hence of the prediction error . This is formalized in Propositions 2.5 and 2.6 below. We now briefly discuss Equations (2.10) and (2.11). First consider the bias of as an estimator of . It is easy to see that . By (2.12) (b), , and after dividing the latter term by as in (2.10), it is of a smaller order than the term appearing in . This shows that the latter term contributes to reducing the bias of as an estimator of .
Our main interest is in the case of regressions, and in choosing a model that minimizes an average of values of . Averaging (nearly) unbiased estimates can result in consistency in , which explains why we care about correcting the bias of . In this case, a further bias correction using the jackknife is useful (see Section 5.2). The above discussion implies that it suffices to bias-correct the estimator , which is what we do when using the jackknife.
Choosing a good model can be reduced to choosing between two models, say, and at a time, by approximating the difference using . The leading terms in the latter expression will be the difference between the relevant values of for the two models, and it is easy to see that the leading term of this difference is the difference between the values of for the corresponding models, which is of order by the central limit theorem. However, when two models having very similar prediction values are compared by differencing their corresponding values of , their leading terms will approximately cancel, and in this case the second term on the right-hand side of (2.8) plays a role. This holds also for Mallows and the AIC, [1], and will be exploited formally in the Propositions 2.5 and 2.6 below.
The following lemma shows that Condition (ii) of Theorem 2.1 holds when is distributed as a mixture of normals.
Lemma 2.2.
Let the distribution of the covariate vectors (excluding the first coordinate in the case that it is a constant 1) be normal, or a finite mixture of normals, or an infinite mixture of normals with covariance matrices in a set , and , where denotes the smallest eigenvalue. Then, for , Condition (ii) of Theorem 2.1 is satisfied.
More generally, the th moments of the entries of are bounded under the conditions of Lemma 2.2 provided that (see von Rosen 1988, Theorem 4.1). Note that the condition on guarantees that is bounded away from exact multicollinearity.
2.4 Discrete covariates
When contains discrete covariates, the probability that the matrix does not exist is positive, and expressions like of (2.2) and hence of (2.4) may not exist. When the components of are bounded, we provide the following limiting approach. Set
| (2.14) |
where is the smallest eigenvalue, and . We have
Theorem 2.3.
2.5 Approximations and consistency
The focus of this section is on choosing a subset of covariates for prediction of future responses on the basis of a single dataset of size . The linear model parameters are estimated from a sample of size , with the understanding that different ’s may (and should) lead to different choices of subsets; more specifically, a larger naturally gives rise to a larger set of covariates. Asymptotic results in are not of major interest in this context; however, they may contribute some understanding when is not small. Such results are discussed in this section.
In Proposition 2.5 we show that under the conditions of Theorem 2.1, choosing a subset of covariates in the set guarantees that for increasing and we choose the best linear model with probability converging to 1, that is, the model minimizing , with notation defined after (2.4). In Proposition 2.6 we show that for fixed , using , we choose an adequate model in the sense defined in Section 2.2, with probability converging to 1 as .
Below is taken over all subsets of covariates. For a given , define the following sets:
The following proposition shows that the first two sets defined above by converge to the third, which is a singleton. Note that is the best linear model in the sense of being the most parsimonious model minimizing the expected square of the projection error . We deal with the convergence of in Proposition 2.5.
Proposition 2.4.
Suppose that the conditions of Theorem 2.1 hold. Then
(i)
Any two sequences in and are equally good, that is, any sequence of models in is adequate in the sense of Section 2.2.
(ii) The set is a singleton, and the sets and converge to the singleton as .
The proof shows that essentially is a singleton; that is, besides , may only contain models having the same covariates and regression coefficients as those of , and further covariates whose coefficients vanish. Note that since the number of models is finite, it follows that for large enough ; that is, the same model minimizes both and . The model is the minimal best linear predictive model that one would ideally use if the projection coefficients were known.
The next proposition shows that minimizing the statistic leads to correct selection asymptotically, that is, to selecting the model that minimizes the prediction error with probability converging to 1.
Proposition 2.5.
Under the conditions of Theorem 2.1, with both , and , we have .
The proof is given in the Appendix, where we also show that the condition is necessary. The case (with nonrandom covariates) corresponds to the standard Mallows , which is inconsistent; more specifically, it is well known that for , the choice may lead to models that strictly contain ; see, e.g., Nishii 1984. The equality , which holds for large enough and with high probability, implies that is a singleton (by Proposition 2.4 (ii)), and that selecting a model according to the statistic yields a model that minimizes the prediction error. Furthermore, the choice of a model by leads asymptotically to the choice of , the smallest model in terms of the number of covariates in , that is, the most parsimonious model that minimizes . This property is often referred to as consistency; see, e.g., Shao 1997.
In the case of fixed , Equation (2.13) readily implies that . Therefore, as goes to infinity, the left-hand side converges to zero (at a rate of ), implying
Proposition 2.6.
Under the condition of Theorem 2.1, we have for any fixed , .
3 Several datasets
Our main focus is on the case where several regression datasets are observed. We first discuss the case where we observe datasets from all the regressions of interest, and then, in Section 3.3, we consider a hierarchical situation where the data consist of a random sample of regression datasets from a structured collection of regression models.
3.1 Model selection observing all regressions
We consider a population of distributions with , that is, the training set comprises of all regression datasets in the population. Thus, we observe data , , and .
For a given , the goal is to select a common set of covariates to be used for prediction of the response from (the subvector with coordinates in ) for each individual distribution from the population, or equivalently for a random , see below (3.1), where the coefficients , which are allowed to vary with , are estimated with a sample of size . The relevant prediction error for this task is (3.1) below. When predicting for individual , it may be natural to set . However, other values of may be of interest in studying the contribution of covariates as a function of the sample size. Later (in Section 3.3), we use the datasets as a training set for choosing a model to predict for any out-of-sample on the basis of future observations, where is not determined in advance since is not in the training set. In this case we use the chosen subset of covariates, and estimate its parameters on the basis of a dataset of size from . The value of may vary, being the size of the dataset .
Let , where for now and its size are suppressed in the notation. For each and generic observation from the distribution , we define
see (2.1), where . Assuming finite fourth moments, we have for a sample size , for each , as in (2.3),
and are the th versions of , and , and , a matrix, assumed to be positive definite. We further use the notation for the th version of , that is, when expectations are taken with respect to , and similar notation when observations are used for the estimators , , and instead of , , and .
We consider prediction for a random individual regression dataset of size from the population , based on a model, that is, a subset of covariates . As above we suppress and write and rather than and , etc. The relevant prediction error (see (1.1) and around for a discussion) is
| (3.1) |
where independently of , and the expectation on the right-hand side of (3.1) is also applied to . The risk can be interpreted as an expectation over for a uniform choice of a single or equivalently, as the risk per task average for the multi-task of predicting for all if all datasets sizes (or task size) were . In above and similar expressions below, we suppress the number of datasets . In the case that any of the distributions involves discrete covariates, we replace by a conditional expectation as in Section 2.4, where the conditioning is on a set whose complement is exponentially small. In the definition given in Equation (1.1), (3.1), and others below we use boldface letters when . Next define
| (3.2) |
Using (2.9) we have
| (3.3) |
Set
| (3.4) |
where . We define the jackknife bias-corrected by
| (3.5) |
where is the bias-corrected ; see Efron 1982, Equation (2.8), for a precise definition of the jackknife correction we use.
3.2 Consistency
Analogously to the definitions in Section 2.5, where now the optimal sets of the multi-task problem are denoted using boldface, define
| (3.6) | ||||
The next result is similar to Proposition 2.4, with essentially by the same proof. The notions equally good and adequate are the same as that of Section 2.2.
Proposition 3.2.
Suppose that the conditions of the first part of Theorem 3.1 hold. Then
(i)
Any two sequences in and are equally good, that is, any sequence of models in is adequate.
(ii)
The set is a singleton and the sets and converge to the singleton as .
The following proposition generalizes Propositions 2.6 and 2.5 to . Here we consider a uniform bound (3.7). Technically, the constant provides a measure of the notion of “sufficiently homogeneous” of Section 1.2 when referring to the set of distributions ; informally we mean that the regression datasets have enough in common to justify common subsets for prediction.
Proposition 3.3.
- 1.
Assume that the conditions of the first part of Theorem 3.1 hold. Then for fixed we have
- 2.
Let be bounded for all , and let be a constant satisfying for all and
(3.7) Then
where depends only on .
The existence of follows from the assumption on since only a finite number of bounded terms appear in (3.7) besides .
Part 1 of the above proposition extends Propositions 2.6. Part 2 extends Proposition 2.5; however, a stronger condition was needed before, namely that , to obtain consistency. Here, we obtain approximate consistency for large , assuming only that is bounded, along with the other terms in (3.7). This is useful since in our application it is natural to consider the possibility that .
The rate in the theorem was achieved by using Chebyshev’s inequality. Since under our assumptions all moments are bounded, a similar argument using a bound on moments leads in the same way to the rate , where depends also on , and with further effort, a large deviation rate (in ) can be achieved.
3.3 A population of distributions
We now consider the situation where we have a sample of regression datasets from a given, finite or infinite, population of such datasets, and we are interested in predictions for a random (possibly out-of-sample) further regression or several regressions from the same population. In terms of the application considered in this paper, this situation corresponds to the case that we have a training sample of doctors out of many more, and our goal is to select a subset of covariates to be used to predict service durations for a random doctor from the population who may not be in the training sample.
Formally, let be a probability space and let be a family of distributions; see, e.g., Çinlar 2011, Chapter VI for a formulation of random measures. Let be a sample where , and as in Section 3.1 we observe a training set consisting of datasets , , where stands for . Given , we consider . For any function for which the conditional expectation of given is well defined, we assume that so is , where the outer expectation is over .
We now fix a set of covariates , which is suppressed in most of the notation as before. For any we define to be the least squares estimator for the given dataset . If is sampled randomly from then the population prediction error is defined as
| (3.8) |
where the expectation is over and that are independent of . Let , , , and . As before, is approximated by
| (3.9) |
where the latter integrand defines as in (2.7). The quantity , whose estimation was already discussed, is now a random variable, since it depends on with ; its expectation, given by (3.9), is the basis of our estimation of of (3.8). Lemma 3.4 below generalizes (2.9).
Lemma 3.4.
Suppose that the conditions of Theorem 2.1 hold uniformly in ; that is, for each , the th moment with respect to of each entry of and is bounded uniformly in , and the entries of have third moments with respect to that are bounded uniformly in and . Then
The lemma clearly holds if is finite, and in general it follows readily by the uniform boundedness of moments in and the proof of (2.9) given in the Appendix. Recall Lemma 2.2, where we showed that the moment conditions of Theorem 2.1 hold when is a mixture of normals and . For the bound on moments as assumed in Lemma 3.4 to hold uniformly, it suffices that , where now the infimum is over all covariance matrices of all the mixing normal distributions involved in all the distributions for all . This technical assumption means that the covariates that are taken into account for the model selection are “bounded away” from multicollinearity. For discrete variables we redefine the prediction error by conditioning as in Section 2.4. Theorem 2.3 extends easily when we assume that all covariates are uniformly bounded in , and that for some , for all .
Lemma 3.4 suggests that a consistent estimator of will lead to selection of an adequate model in the sense of Section 2.2, that is, a model that is as good as the model that minimizes .
Recall the definition of in (3.2); now this quantity is considered random as it is a function of the sampled distributions . In order to generalize the consistency results of Theorem 3.1 to this case, we need to bound as in the lemma below.
Lemma 3.5.
Under the conditions of Lemma 3.4,
| (3.10) |
uniformly in . Moreover, for any fixed , is asymptotically normal.
We now consider the population versions of the quantities defined in Section 3.2.
are defined as in (3.6), however the fact that now the ’s are random adds randomness to , and makes a random variable.
Proposition 3.6 parallels Proposition 3.3; it shows consistency properties of , as defined in (3.6) using (3.1). Below, the probability is obtained by first conditioning on , and then unconditioning by taking expectation over with respect to the product measure .
Proposition 3.6.
Assume that the conditions of Lemma 3.4 hold, and in addition that for all and .
- 1.
When is fixed,
- 2.
Letting ,
where depends only on .
The proof of Proposition 3.6 also shows that is a singleton and and converge to it when .
4 GENO
4.1 Definition of GENO
Given a model (i.e., a set of covariates) with coefficients estimated by a sample of observations, we can say that it is equivalent to another model with observations if their expected prediction errors satisfy . Using the approximation to given in (2.7), (3.2), and (3.9) for each of the scenarios we consider, we define GENO by
| (4.1) |
If for all , we set GENO, indicating that model with observations is better than model with any number of observations (model with any number of observations is better than with ). A direct calculation shows that for we have
For with defined in (3.2) we have
For the case of (3.9), is replaced by , and the averages by integrals .
GENO means that model with observations is equivalent in terms of expected prediction error to model with observations. Note that the larger GENO is, the better model (with observations) is relative to model . For each model and sample size , we define
| (4.2) |
where the minimum is over all subsets of covariates . It follows that the inequality holds always, where equality means that is the best model for observations, as no other model can achieve the same prediction error with fewer observations. On the other hand, means that there is a model that achieves, with observations, the same prediction error as with observations. Thus, small values of GENO suggest considering another model. By the monotonicity of in , if the inequality holds for some model , then it holds all . This readily implies
| (4.3) |
4.2 Estimation of GENO
In the case , (2.13) shows the consistency of as an estimator of for fixed as . In view of (4.1) we define a consistent estimator of by
To avoid cumbersome notation we suppress in . Using (2.8) we obtain, as before,
| (4.4) |
setting it to be if the expression in curly brackets is negative or zero.
In the case of datasets of Section 3.1, or in the population case of Section 3.3, the above expression (4.4) remains unchanged except that now is replaced by defined in (3.1), and is replaced by . We can also define the estimator of (4.4) in terms of the jackknife bias-corrected of (3.5). This is done in estimating GENO in Section 6.3. The results below hold in the same way for all these cases. Similarly to (4.2), we define the statistic
which is an estimate the minimal number of observations required by the best competing model to achieve the same prediction error as model with sample size .
As in (4.3), we have
The next proposition follows from (2.13) by applying the -method to the inverse function in (4.4). In particular, it shows the consistency of for fixed as .
Proposition 4.1.
The variance is not given explicitly since it is too complicated to be useful, and it can be be computed by the bootstrap. See Theorem 3.1 and the ensuing comment, which show that (under certain conditions) the variance decreases at a rate of .
A similar problem is to estimate for a given model and a certain prescribed prediction error the sample size that satisfies . When , using (2.7) this quantity is given by and can be estimated by
| (4.5) |
(Since is an unbiased estimator of ); the extensions to the cases and to the population setup are straightforward.
5 Simulations
In this section we evaluate by simulations the prediction error , its approximation , and its estimation using . We start with a single dataset () and then we consider the case of several datasets. This simple example demonstrates the well-known difficulty involved in model selection for a single given dataset with methods such as Mallows , AIC, BIC, as well as our version . In Section 5.2 we compare the case of model selection for one dataset to that of choosing a common model for successful prediction on the average when we have data from several datasets, that is, a multi-task. Section 5.3 compares the prediction error when model selection is done according to to the prediction error under other methods.
5.1 A single dataset
Suppose that the distribution of for is given by
| (5.1) |
with . Setting all models to include the intercept, there are possible submodels; for simplicity, we focus for now on two models consisting of the subsets of covariates , ; more explicitly, we have model : and model : . These two models are wrong (as linear conditional expectation function models, see Hansen 2020 Section 2.15) since the residual includes the nonlinear term . By the orthogonality of the variables in (5.1), the projection parameters are equal to for these models; see (2.1). This is used in computing the first part of for , and since in this case , it is also easy to compute for each model. We obtain
| (5.2) | ||||
| (5.3) |
notice that the above functions do not depend on . For a concrete example, we set in (5.1)
| (5.4) |
Figure 1 plots (see (2.4)-(2.5)) (solid lines) and (see (5.2)) (dashed line), , as functions of for the above parameters. We evaluated , where , by a simulation based on repetitions and using the decomposition (see (7.1) and recall that )
the first expectation can be computed explicitly and the second is evaluated using simulations. For small , differs from , and the approximation improves as increases. For smaller than about 50, model has a smaller prediction error; for large model is better. This holds approximately for both and . This makes sense as models with fewer parameters have a smaller prediction error for small . The rest of the models are not optimal for any (this observation is not shown in Figure 1).
Consider GENO as defined in (4.1). Careful inspection of Figure 1 shows, for example, that GENO, which means that in order to achieve the same prediction error as model with observations (the value of where the dashed black line and red the line intersect), model requires the same number of observations. Also, GENO, and therefore, to achieve the same prediction error as model with , model would require 95 observations (the value of where the dashed black line has the same level as the dashed red line at 60). Since the decrease of (the black line) in is slow, a small increase in , will result in a much larger value of GENO; for example, GENO. As mentioned before, GENO allows the statistician to compare the cost of additional observations to the cost of measuring additional variables, which may be expensive, or harmful, such as in the case of an invasive medical procedure or imaging that involves radiation.
By (4.5), the numbers of observations for models and to obtain a prediction error of 59 are about 29 and 39, respectively; i.e., model can achieve this prediction error with a sample size that is smaller by 10 observations. On the other hand, for a prediction error of 56, model requires 118 observations, while model needs only 63 observations.

We now discuss estimation of the prediction error using based on a single dataset of size . Figure 2 plots (solid line), (dashed line), and boxplots of the estimators on the left-hand side, and , the jackknife bias-corrected version, on the right-hand side, based on simulations for each . Their means are given by circles. We see that the jackknife corrects the bias of as an estimator of ; see the discussion following (2.8). Recall that the bias itself and the correction decrease in . The mean of the difference and equals 0 at about and , respectively; thus the jackknife leads to correct selection on average since it is optimal to select model for about .
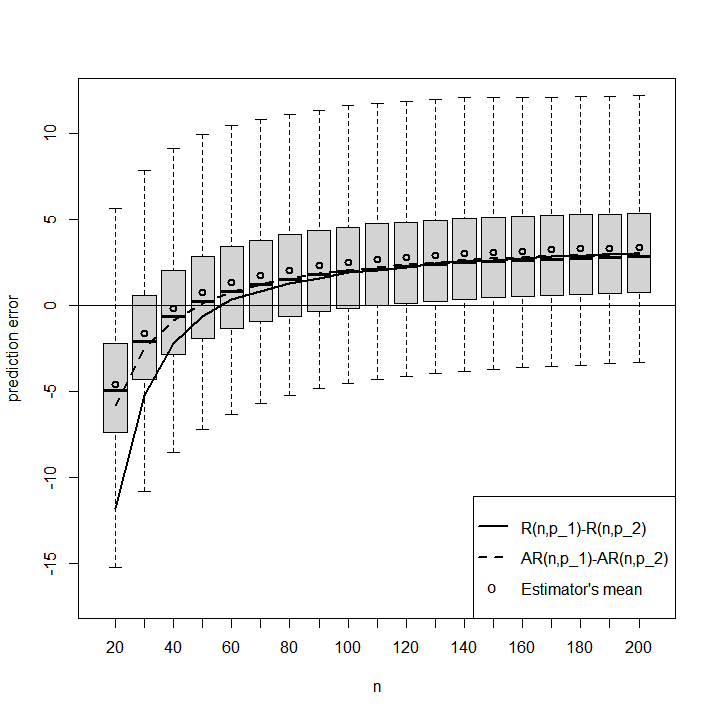


Figure 3 depicts simulation estimates of the probability of selecting models and as a function of , using and the jackknifed , where all possible sub-models are considered; for clarity we present the curves of and only. For each and for each simulated dataset, and are calculated for all . The empirical averages over 100 simulations of selecting models and out of the sub-models for each are plotted in Figure 3. The bias correction increases the probability of selecting model for small . This improves the selection for small or moderate values of . For the problem of selecting a common model for datasets, the bias correction becomes more significant, as demonstrated next.
5.2 Multiple datasets
We now consider the case of datasets. Suppose that is given by model (5.1) with , for , where is given in (5.4), , is with equal probability, and all the above random variables are independent (thus determining the distribution of Section 3.3), and then fixed throughout this section. The expected is approximately equal to in (5.4), but about half of the ’s are positive and half are negative. The number of regression datasets is , and , and 200 for , , , respectively.
In the case of observing all regressions (see Section 3.1, Equation (1.1)), we wish to estimate , whereas in the case of observing a sample of regressions from the distribution (see Section 3.3, Equation (3.8)), the relevant quantity is . Computing the latter quantity is difficult, and instead we use the approximation , which is justified by the law of large numbers and the central limit theorem (see Lemma 3.5). Thus we now focus on estimating and selecting according to its estimate. The plot of for =100 and is similar to Figure 1 and therefore is not presented here.
Figure 4 parallels Figure 2, where now in the case of datasets, and replace , and , respectively; see (3.1) and (3.5); the number of simulations to evaluate and to produce Figures 4 and 5 is 100. We see that the jackknife bias correction works well. Here the variances of the estimates are much smaller, indicating that several datasets can lead to better estimates and model selection procedures, as predicted by theory. The -axis scale varies between Figures 4 and 2, in a way that undermines their difference.
Figure 5 plots the selection probabilities as a function of (out of all sub-models). Unlike the case (see Figure 3), model (respectively, model ) is selected with high probability for small (respectively, large ). Recall that it is optimal to select model (respectively, ) when , (respectively, ). Selecting according to leads to favoring (or other models) when is greater than approximately 25 (instead of 50) and corrects this bias.
Thus, the probability of correct model selection is much higher when using the datasets (see Figure 1). Clearly, the probability of making a correct selection depends on the number of datasets , the similarity among the models, the noise level in the models, and the sample size .


5.3 Comparisons to other approaches
We considered the possibility of concatenating the whole training sample and performing a single regression with an intercept for each . In this simulation, since about half of the ’s are positive and half are negative, the resulting regression model leads to a higher prediction error than the one of . The latter has estimated prediction error of 56.1 (SE=0.03) (see Table 1 below), while for the ordinary least squares applied to the concatenated dataset the corresponding number is 63.6 (SE=0.1), computed by averaging the prediction error over 1000 independent datasets with the same distribution. For ridge and lasso estimators applied to the concatenated dataset (calculated using the glmnet package, where the tuning parameter was computed using cross-validation), the prediction error was slightly higher: 64.1 (SE=0.1) and 63.9 (SE=0.1) for ridge and lasso respectively.
Another approach is to consider a separate model selection algorithm for each of the datasets. We considered three selection criteria: with as in (2.8) (applied to each dataset separately), Mallows’ and BIC. The means of the resulting prediction errors are given in the Table 1 below as well as that of (where the same model is selected for all ’s with the same sample size ). The datasets are divided into three categories according to their sample sizes and the mean is reported for each category separately. Recall that , and 200 for , , and , respectively. The prediction error was evaluated as in Figure 1. Table 1 shows that leads to smaller prediction errors and the improvements is higher for smaller sample-sizes, where borrowing power from other datasets is more important.
| Model selection method | ||||
|---|---|---|---|---|
| Mallows’ | BIC | |||
| 61.4 | 67.4 | 66.4 | 66.1 | |
| 54.4 | 55.2 | 55.2 | 56.1 | |
| 52.7 | 53.4 | 53.4 | 54.5 | |
| Average | 56.1 | 58.7 | 58.3 | 58.9 |
6 Prediction of durations of medical examinations
In this section we analyze a dataset of outpatients’ hospital visits. Different models are considered in order to predict the actual appointments’ durations as opposed to the planned durations.
6.1 Description of the data
The dataset analyzed is taken from the SEE Lab at the Technion. It consists of information on 140,924 hospital visits that took place in a certain US hospital for about two years between 2013 and 2015. For each visit, both the planned time and the actual time are reported. The goal was to provide a more accurate prediction of the actual duration than the planned one. In this dataset there is information on 44,516 patients and 258 doctors, out of whom 34 doctors had fewer than 50 visits. We shall focus on the rest, which corresponds to 99.5% of all visits. The regression coefficients will differ between doctors, and the goal is to select one common subset of covariates (for each ) for all doctors for prediction of visit durations.
The distribution of the planned duration is given in Table 2 and Figure 6 plots the estimated density (a normal kernel estimate using the R command “density”) of the actual durations for the time slots of 15, 30, and 60 minutes. Actual durations are obtained by a real-time location system (RTLS). The means are 16.7, 21.3, and 41.2, respectively.
| minutes | 15 | 30 | 45 | 60 | other |
|---|---|---|---|---|---|
| percentage | 29.8% | 52.6% | 1.8% | 15.5% | 0.3% |

6.2 A regression model
The original dataset contains a large number of covariates, of which many did not seem to have any predictive power relative to visit durations. For simplicity of presentation, we focus on a small number of covariates that seem most relevant. We aim to predict actual duration, using the following covariates:
- •
duration_planned = the planned duration of the visit in minutes.
- •
duration_planned_2 = the planned duration in minutes of the visit, squared.
- •
last = the planned minus the actual duration of the previous visit of the same patient (taken to be 0 for the first visit of the patient).
- •
hour_end = whether the exam is planned to end on the hour. It turns out that these kinds of visits tend to be somewhat longer.
- •
type = there are two types of examinations: consultation/examination only, or the above plus treatment. In either case, only the first part counts as duration.
Standard statistical inference of the linear regression model of the whole dataset (ignoring the doctors’ index) reveals that all of the above covariates besides “type” are statistically significant; however, the standard error of the residuals is 15.33, and , suggesting that the prediction error is quite large.
6.3 and model selection
In our notation, each doctor is indexed by , and is the number of visits to doctor in the dataset; varies between 50 and 2135. We demonstrate our approach by focusing on four candidate models that have the smallest (or nearly smallest) from all submodels of the five covariates (all models included the intercept term) for relevant sample sizes . These models are – the model with the covariates: duration_planned, duration_planned_2; – the model with the same covariates as in and additionally, the variable “last”; – the model with the same covariates of and additionally, the variable “type”; and – the full model. For certain submodels estimation is possible only for a subset of the doctors since is not always invertible. Therefore varies between the models. For the models and , invertibility held for 96 doctors and for the models and , the corresponding number is 95, and so for these models or . In this case, is based only on this subset.
Figure 7 plots for where and is between 50 and 500. For smaller than approximately 80, model is the best among the candidate models; for between 80 and 450, has a smaller , and for larger , is the best, but is very close. In terms of GENO, we have, for example, that for , for and equals 54, 63, 73, respectively. The latter number means that model (the full model) would require 73 observations to achieve the same prediction error as model with observations. Also, ; if one considers using only the planned duration () or using model , that is, adding the variable “last” with the information on the last visit, which may not be available for some patients, then the estimated prediction error by the model with observations can be achieved without knowing “last” by , with . It is then left to the user to decide whether to invest in measuring “last” or in using a larger sample, if such a sample is available.

Table 3 reports for different sample sizes . Standard deviations estimated by the bootstrap, and cross-validation estimates of , are also provided. The latter estimates are computed only for ’s where . For each such , the data were split at random into a training set with observations, and a testing set of size . The estimates are based on the training set and the prediction error is evaluated using the testing set. This procedure was repeated 1,000 times and the average prediction error is reported. The cross-validation estimates are mostly within one standard error of the values, and the two approaches lead to selection of the same models.
Table 4 reports the values of together with a bootstrap estimate of the standard deviation for different values of and various pairs of models. Also the differences of the corresponding cross-validation estimates are given. The standard deviations of Table 4 are much smaller than those of Table 3. This is consistent with our theoretical results that comparison of two similar models leads to a small estimation error (see the discussion after Theorem 2.1). The table shows which pairs , differ significantly, and for which values of .
| Model | Model | Model | Model | |||||
|---|---|---|---|---|---|---|---|---|
| n | (SD) | CV | (SD) | CV | (SD) | CV | (SD) | CV |
| 50 | 189.9 (3.4) | 183.9 | 191.2 (3.5) | 185.9 | 194.0 (3.5) | 190.1 | 197.4 (3.8) | 194.5 |
| 150 | 181.1 (3.3) | 181.1 | 180.0 (3.3) | 180.4 | 180.7 (3.4) | 181.3 | 181.7 (3.4) | 183.0 |
| 500 | 178.1 (3.3) | 183.0 | 176.1 (3.1) | 181.3 | 176.0 (3.4) | 181.2 | 176.2 (3.3) | 181.3 |
| (SD) | CV | (SD) | CV | (SD) | CV | ||
|---|---|---|---|---|---|---|---|
| -1.3 (0.3) | -2.0 | 1.2 (0.3) | 0.7 | 2.1 (0.3) | 1.7 | ||
| -4.1 (0.4) | -6.2 | 0.5 (0.4) | -0.2 | 2.1 (0.4) | 1.8 | ||
| -7.5 (0.5) | -10.6 | -0.5 (0.5) | -1.9 | 1.9 (0.5) | 1.7 | ||
| -2.7 (0.2) | -4.2 | -0.7 (0.2) | -0.9 | 0.0 (0.2) | 0.1 | ||
| -6.2 (0.4) | -8.6 | -1.7 (0.3) | -2.6 | -0.1 (0.3) | 0.0 | ||
| -3.4 (0.3) | -4.4 | -1.0 (0.2) | -1.7 | -0.2 (0.2) | -0.1 | ||
6.4 Comparisons to other approaches
As in Section 5.3 we compare our method to other approaches. One possibility is to concatenate the whole training sample and add a categorical variable for the doctors. The (10-fold) cross-validation estimate of the prediction error of the OLS is 204.5. The corresponding numbers for the ridge and lasso estimates (applied to the concatenated data) are similar: 205.0 and 204.8. The estimates of prediction errors of our method are smaller: they vary between 190 and 176 for (See Figure 7 and Table 3).
A different approach is to preform a separate model selection for each of the datasets. As in Section 5.3, three selection criteria are considered, (the bias-corrected with ), Mallows’ and BIC. Figure 8 plots the cross-validation estimates of the prediction errors of the selected models by the three criteria as a function of the sample size . A normal-kernel smoothing is drawn to illustrate the average prediction error as a function of the sample size. Also plotted is the prediction error of the common model selection (which is close to optimal for sample sizes between 50 and 500) as estimated by . Table 3 shows that the latter estimate is rather close to its cross validation estimate. Figure 8 shows that: a. the differences between the three selection criteria are small; b. a common model selection by is better on average than a separate model selection; c. the latter statement is especially true for small sample sizes where borrowing strength is more important.

Acknowledgment: We are grateful to Avishai Mandelbaum for providing access to the SEE Lab dataset we analyzed, and to Ella Nadjharov for creating the files we needed. We also wish to thank the associate editor and the two referees for their very useful comments.
References
- Akaike [1974] Akaike, H. (1974). A new look at the statistical model identification. IEEE Transactions on Automatic Control, 19, 716–723.
- Andrade [2021] Andrade, D., Okajima, Y. (2020). Adaptive Covariate Acquisition for Minimizing Total Cost of Classification. Machine Learning (2021) 110, 1067–1104
- Anderson and Burnham [2002] Anderson, D., Burnham, K. (2002). Model selection and multi-model inference. New York: Springer..
- Breiman [1974] Breiman, L. (1996). Bagging predictors. Machine learning, 24(2), 123-140.
- Brown [1974] Brown, L. D. (2016). Mallows for out-of-sample prediction. http://www-stat.wharton.upenn.edu/~lbrown/Papers/2016f%20Mallows.pdf
- Buja et al. [2019] Buja, A., Berk, R., Brown, L., George, E., Pitkin, E., Traskin, M., Zhao, L., Zhang, K. (2019). Models as approximations I: Consequences illustrated with linear regression. Statistical Science, 34, 523–544.
- Çinlar [2011] Çinlar, E. (2011) Probability and Stochastics. New York: Springer.
- Claeskens and Hjort [2003] Claeskens, G., Hjort, N. L. (2003). The focused information criterion. Journal of the American Statistical Association, 98, 900-–916.
- Efron [1982] Efron, B. (1982). The Jackknife, the Bootstrap and Other Resampling Plans. Society for Industrial and Applied Mathematics.
- Erev, Roth, Slonim, and Barron [2007] Erev, I., Roth, A. E., Slonim, R. L., Barron, G. (2007). Learning and equilibrium as useful approximations: Accuracy of prediction on randomly selected constant sum games. Economic Theory, 33, 29–51.
- Groves and Rothenberg [1969] Groves, T., Rothenberg, T. (1969). A note on the expected value of an inverse matrix. Biometrika, 56, 690–691.
- Hansen [2020] Hansen, B. E. (2021). Econometrics. https://www.ssc.wisc.edu/~bhansen/econometrics/Econometrics.pdf
- Horn and Johnson [2013] Horn, R. A., Johnson, C. R. (2013). Matrix Analysis 2nd Ed. Cambridge University Press.
- Lindsay and Liu [2009] Lindsay, B., Liu, J. (2009). Model assessment tools for a model false world. Statistical Science, 24, 303–318.
- Mallows [1973] Mallows, C. L. (1973). Some comments on CP. Technometrics, 15, 661–675.
- Obozinski, Taskar and Jordan [2010] Obozinski, G., Taskar, B., Jordan, M. I. (2010). Joint covariate selection and joint subspace selection for multiple classification problems. Statistics and Computing, 20/2, 231–252.
- Nevo and Ritov [2017] Nevo, D., Ritov, Y. (2017) Identifying a minimal class of models for high-dimensional data, Journal of Machine Learning Research, 18, 1–29.
- Nishii [1984] Nishii, R. (1984). Asymptotic properties of criteria for selection of variables in multiple regression. Annals of Statistics, 12, 758–765.
- von Rosen [1988] von Rosen, D. (1988). Moments for the inverted Wishart distribution. Scandinavian Journal of Statistics, 15, 97–109.
- Rosset and Tibshirani [2018] Rosset, S., Tibshirani, R. (2020). From fixed-X to random-X regression: Bias-variance decompositions, covariance penalties, and prediction error estimation. Journal of the American Statistical Association, 115, 138–151.
- Rutherford [2001] Rutherford, A. (2001). Introducing ANOVA and ANCOVA: A GLM Approach. London: Sage.
- Sampson [1974] Sampson, A. R. (1974). A tale of two regressions. Journal of the American Statistical Association, 69, 682–689
- Schwarz [1978] Schwarz, G. E. (1978). Estimating the dimension of a model. Annals of Statistics, 6, 461–464.
- Shao [1997] Shao, J. (1997). An asymptotic theory for linear model selection. Statistica Sinica, 7, 221–264.
- Tropp [2012] Tropp, J. A. (2012). User-friendly tail bounds for sums of random matrices. Foundations of Computational Mathematics, 12, 389–434.
- Vonesh and Chinchilli [1996] Vonesh, E., Chinchilli, V. M. (1996). Linear and Nonlinear Models for the Analysis of Repeated Measurements. CRC Press.
- Wagenmakers and Farrell [2004] Wagenmakers, E. J., Farrell, S. (2004). AIC model selection using Akaike weights. Psychonomic bulletin & review, 11, 192–196.
- White [1982] White, H. (1982). Maximum likelihood estimation of misspecified models. Econometrica, 50, 1–25.
- Yang [2005] Yang, Y. (2005). Can the strengths of AIC and BIC be shared? A conflict between model indentification and regression estimation. Biometrika, 92, 937–950.
- Zacks [1975] Zacks, S. (1985). Pitman efficiency. In Encyclopedia of Statistical Sciences, S. Kotz and N. L. Johnson (eds). New York: Wiley & Sons.
- Zhang [2021] Zhang, Y., Yang, Q. (2021). A survey on multi-task learning. IEEE Transactions on Knowledge and Data Engineering.
7 Appendix A: Proofs
Recall that we use to denote a subset of the covariates, to which we sometimes refer as a model, and denote its size with the corresponding letter . We suppress it in most of our notation below and instead of we write and assume it is in .
Proof of Theorem 2.1. We first prove (2.9). For computed from a sample , and a pair of new observations from the same distribution , independent of , we have
| (7.1) |
where the last term in the first line of (7.1) vanishes since and and are independent of . This argument holds also if we condition on (see (2.14), and Theorem 2.3). By (7.1) we have that
| (7.2) |
Using independence of and again we have
For the proof of Theorem 2.3 the expectations should be conditioned on the set , whose probability is large, and the conditioning does not affect the rates we obtain.
By Equation (7.3) of Hansen 2020,
Since we rewrite the right-hand side of (7.2) as
| (7.3) |
In order to prove (2.9) we now show that the latter expectation is of order . To this end, notice that
We now deal with the first term on the right-hand side above, the other term being similar, and simpler. We have
| (7.4) |
and therefore (recall (7.3)) we consider the expectation of
This matrix is a product of random matrices of the form where , , and . The trace is a sum of products of entries from all the matrices appearing in the product. Different choices of powers can be made, but we use Hölder’s inequality in the form for simplicity. Here is an entry from , an entry from from , etc., and the triangle inequality can then be used to bound the sum comprising the trace.
For each element of we have
The summands have zero expectation; expanding we see that the number of nonvanishing terms when the expectation is taken is of order , and all these terms are bounded by our assumptions. Therefore, is of order . (Actually, it is easy to see that 24 bounded moments suffice for this argument, and also for bounding the remaining terms, and 24 can be somewhat reduced by a better but more cumbersome choice of the powers in Hölder’s inequality.) A similar computation for the matrix shows that the required moments of its entries are bounded. The rest of the terms are bounded by our assumptions. Now (2.9) follows.
The proof required the bounded third power of , which means that with a mixture of normals we need . See the Proof of Lemma 2.2.
We now show (2.10). The definitions of and imply that
| (7.5) |
Starting with the second term on the right-hand side of (7), we have
where the last term vanishes since . Hence,
| (7.6) |
Recall the notation . Since by Equation (7.3) of Hansen 2020 , we have
where the last equality holds true since . Also,
| (7.7) |
where for the last equality it suffices that and are consistent estimates of and , and therefore is consistent for . Equations (7), (7), and (7.7) imply (2.10).
Next we show that is asymptotically normal starting with the asymptotic normality of . We have,
| (7.8) |
respectively. Starting with the first term we have
which is asymptotically normal. Now is obtained by multiplying the sum (which converges to a matrix of constants by the law of large numbers) by , where is the identity matrix of order , and is Kronecker’s product. By Equation (7.3) of Hansen 2020,
By the law of large numbers and the fact that , we have that the term in (7) is . Summing up,
where is the matrix . Condition (i) implies that the second moment of is finite. Hence, by the central limit theorem,
| (7.9) |
is jointly asymptotically normal, and since and converge to a matrix of constants, a version of Slutsky’s theorem implies that is asymptotically normal.
Another application of Slutsky’s theorem implies that is asymptotically normal (since in probability) and therefore so is
It follows that and it is asymptotically normal.
Similar to previous arguments, the random variables in (7.9) and the first part of are jointly asymptotically normal and a version of Slutsky’s theorem that allows us to ignore the term together with (2.10) and (2.11), implies the last statement of Theorem 2.1 about the asymptotic normality of . ∎
Proof of Lemma 2.2. First assume that the first coordinate of the covariate vectors is 1 (corresponding to an intercept coefficient). Let denote the matrix defined as but without the first column of 1’s. We suppress here and in the following notation. Let , where is an -column vector of 1’s, that is, is the -column of covariates means, and let . Then by Horn and Johnson 2013, page 25, Equation (0.8.5.6)
| (7.10) |
Let denote a -vector of the covariates without the first 1, and assume first that . Then , and and are independent. The third moments of are uniformly (in ) bounded by for some , provided by Theorem 4.1 of von Rosen 1988. By (7.10) the third moments of are also bounded. If is distributed according to a mixture of normals, the assumption in the lemma that all these normal distributions have implies the uniform boundedness for the mixture.
If the first coordinate is not 1, we append 1 to the covariates and now the matrix of interest in the above notation (with replacing ) is , which is now , and we wish to show that its inverse has bounded third moments. The eigenvalues of the latter matrix are larger (not strictly) than those of . The latter relation is revered for the inverses. Now use the inequality that for a positive definite matrix we have to conclude that the entries of are bounded by . By the first part of the theorem (with replacing ) we know that has finite third moments and therefore also its trace (by Minkowski inequality), and the result follows. ∎
Lemma 2.3.
For (see (2.14)) the matrix exists and all its entries are bounded uniformly in . Moreover, if the components of are bounded, then for some we have, , which converge to 1 at an exponential rate in .
Proof. When , then , and therefore exists. Since the entries of a positive semi-definite matrix are bounded by the maximal eigenvalue, all entries of are bounded in this case by . For the moreover part, notice that when the elements of are bounded then so is . By Tropp 2012, Theorem 1.1, for some . ∎
Proof of Theorem 2.3. Conditionally on the arguments in the proof of Theorem 2.1 continue to apply with obvious modifications. Lemma 2.3 provides an exponentially small bound on , adding a term in Equation (2.9) and to (2.10) and (2.12) (b) for some . Clearly, these terms do not affect the results. ∎
Proof of Proposition 2.4. For Part (i), set and . We have , and also . The middle term is negative and by (2.9) the two other terms are and Part (i) follows.
For Part (ii), we first show that is a singleton. Suppose that there are two models in . By the definition of , the components of the projection coefficient vectors and must all be non-zero. Since the function is strictly convex in , we have
| (7.11) |
with equality if and only if . Unless a.s., the model would contradict the assumption that and are in by taking expectations in (7.11). We assumed that is invertible and hence vanishes a.s. only for . Adding zeros to and , thus completing them to vectors in , we see that the completed vectors are identical. Since the two models are in and their projection coefficients are all non-zero, it follows that , and therefore is a singleton. The above discussion also shows that any model must satisfy, as sets of covariates, .
In order to show that for large , note first that for large enough implies ; if not then there is some such that . For large this contradicts . It follows that as sets of covariates, and it suffices to show that is minimized over by . Indeed we show that if and as sets of covariates, then . Consider a Gram–Schmidt process on the space of square integrable random variables, with the inner product of two random variables being the expectation of their product. Starting with the indexes in , there exist linear transformations and , where and are invertible and matrices, such that and are both identity matrices (with different dimensions). Also, we can assume that the first rows of can be obtained from those of by adding zeros to each of these rows. Therefore, for we have , where is the th coordinate of . The relation and straightforward algebra, using properties of the trace function, imply that , where
and similarly for . We have for any (with probability 1) since otherwise, by the argument in (7.11), would contradict the assumption that both and are in as above. We conclude that,
| (7.12) |
The strict inequality follows from the fact that is positive definite, and thus are matrices with positive definite expectations, and therefore positive diagonal elements. Summing up, the above discussion shows that is a singleton, and that is minimal among the models in . This implies that as . By (2.9), for every model , , and therefore for large enough . Hence, also as . ∎
Proof of Proposition 2.5.
It suffices to prove that when and ,
since by Proposition 2.4, for large enough .
Equivalently, we claim that for every we have , and since there is a finite number of models, the result follows.
The latter claim is proved separately for and then for , (conditions (a) and (b) below):
(a) For we shall show that
| (7.13) |
for a positive constant . Since is the minimizer of , it follows that as both go to infinity. To prove (7.13) note that by the definition of and Equations (2.7), (2.10), and (2.12), we have
Since and , the difference of the expectations, which we denote by , is positive.
(b) For and we shall show that
| (7.14) |
where is a positive constant implying that when both go to infinity and .
We now prove (7.14). Consider and . Since both models are in , we have
and therefore
In Proposition 2.4 we showed that , and therefore , where is a positive constant. Since both and are in , it follows that a.s. (see the proof of Proposition 2.4). Therefore, the first part of and is equal, and hence, . Recalling that , (2.10) implies that
Proof of Theorem 3.1. The first part follows from (2.10) of Theorem 2.1. That the terms do not depend on can be seen by inspecting the proof of (2.10) of Theorem 2.1. The moreover part follows from the asymptotic normality of each ; see (2.13). ∎
The proof of Part 2 differs from that of Proposition 2.5 only in taking averages over in similar expressions. The only real difference is in case (b) of the proof of Proposition 2.5, with and both in . The proof is achieved by showing that there exists such that
| (7.15) |
We have
| (7.16) |
where,
and , arising from the last term in (2.10). The proof of (7.15) is accomplished by showing that , to be defined below, and that the other three sums are small.
We start with the first term in (7.16), . Since is in we have as sets of covariates. By (7.12), is bounded below by for (as sets). We have where is the th row of the matrix defined in the proof of Proposition 2.4. We have and therefore . It follows that and therefore . We obtained that .
We now deal with . By (2.10) and (2.11) and the fact that , this term equals,
| (7.17) |
Since converges in distribution to and is an upper bound on we have that the limit of the probability that the expression in (7.17) exceeds is bounded by where
Note that the expression within the absolute value sign has mean zero. Writing , Markov’s inequality implies that in order to obtain it is enough to bound uniformly in , which holds when are bounded (element-wise) for all models (of which there is a finite number) and uniformly for all . This follows from our eigenvalue assumptions (see (3.7)) and the fact that the entries of a positive-definite matrix are bounded by its maximal eigenvalue. Finally, it suffices to show that and as with bounded. The first follows from (2.12), and the second is obvious. ∎
Proof of Lemma 3.5. First notice that when the moments appearing in (i) of Theorem 2.1 are bounded uniformly in , then is bounded in . Also, the matrix is bounded (element-wise) uniformly in . Finally, because is positive semi-definite (see Groves and Rothenberg 1969), then uniform boundedness of the moment condition (ii) of Theorem 2.1 implies that is uniformly bounded and therefore so is .
We have
| (7.18) |
The above two sums contain random variables that are bounded, and hence so are their variances. The central limit theorem applied twice, implies (3.10) and the claimed asymptotic normality. It is easy to see directly from (7.18) that the term in (3.10) is uniform in .∎
For the proof of Proposition 3.6 we need the following lemma:
Lemma 7.1.
Proof of Lemma 7.1. Part 1. The proof is similar to that of Proposition 2.4. We sketch the proof. Let and be in . By convexity as in (7.11),
| (7.19) |
with equality iff . This implies that is a singleton as in the proof of Proposition 2.4, Part (ii). Since and are in , the expectation of the left-hand side of (7.19) is zero. It follows that
and therefore for every model in we have that . By the assumptions on moments being uniformly bounded, it follows that is bounded above and is positive and bounded away from zero, both uniformly in . Now (7.12) and the discussion in the paragraph above (7.17) imply that if as sets of covariates, , and then
. Therefore, has a minimal trace among . It follows that as .
Furthermore, Lemma 3.4 implies that and coincide for large . The result now follows from the convergence of to .
Part 2. By Part 1, there exists such that for every , and both are singletons.
For the set is a singleton, and we now show that for sufficiently large
| (7.20) |
We have that
The event implies that for every . In particular,
| (7.21) |
We consider now two cases for : and . Starting with the former case, since both and are in , by the argument ensuing (7.19), and therefore for almost every , hence,
with probability 1. By the definition of ,
Therefore, going back to (7.21), we have
By Part 1,
where is the difference between and the second best. Therefore, ; also, is bounded (by a constant that depends on ). Chebyshev’s inequality implies that
and therefore, .
Next consider the case . By definition, there exists such that for any
It is easy to see that for large enough this implies
By an argument as above . Since the number of models is finite, (7.20) follows.
Now, for fixed that satisfies again a similar argument shows that for any ,
where may depend on (and on ). Since there are only finite such ’s the result of Part 2 follows. ∎
8 Appendix B: A table of notation
| Expression | Description |
|---|---|
| Number of observed regression datasets | |
| Number of observations in the the th regression dataset | |
| The response of the th observation from the th regression | |
| The covariate vector of the th observation from the th regression | |
| A generic observation (whose distribution is ) | |
| The th regression dataset | |
| The distribution of the th regression, i.e., | |
| A set of distributions to which belongs (the cases , | |
| and appear in Sections 2, 3.1, and 3.3, | |
| respectively) | |
| The size of | |
| A subset of , used to denote a subset of covariates | |
| Its size is denoted by . | |
| The prediction error of the linear model with covariates in with | |
| observations for the case ; and | |
| denote the cases of and , respectively | |
| Approximate prediction error; and are | |
| approximations of and , respectively | |
| In the notation below and (P) are sometimes suppressed | |
| The design matrix of the th regression | |
| The vector of responses for the th regression | |
| Projection coefficients under for model | |
| The residual; ; denotes the vector | |
| of the residuals of dimension | |
| The least squares estimate of based on observations. | |
| The empirical estimate of | |
| The empirical estimate of | |
| The empirical estimate of | |
| (it is not a statistic) | |
| An estimate of ; corresponds to the case ; | |
| and denote a jackknife bias correction | |
| (the best model for observations); | |
| corresponds to the case | |
| ; corresponds to the case | |
| The limit of both and as ; | |
| corresponds to the case | |
| ; corresponds to the case | |