

Phonon spectrum of underdoped investigated by neutron scattering
Abstract
The cuprates exhibit a prominent charge-density-wave (CDW) instability with wavevector along [100], i.e., the Cu-O bond direction. Whereas CDW order is most prominent at moderate doping and low temperature, there exists increasing evidence for dynamic charge correlations throughout a large portion of the temperature-doping phase diagram. In particular, signatures of incipient charge order have been observed as phonon softening and/or broadening near the CDW wavevector approximately half-way through the Brillouin zone. Most of this work has focused on moderately-doped cuprates, for which the CDW order is robust, or on optimally-doped samples, for which the superconducting transition temperature () attains its maximum. Here we present a time-of-flight neutron scattering study of phonons in simple-tetragonal ( K) at a low doping level where prior work showed the CDW order to be weak. We employ and showcase a new software-based technique that mines the large number of measured Brillouin zones for useful data in order to improve accuracy and counting statistics. Density-functional theory has not provided an accurate description of phonons in , yet we find the right set of parameters to qualitatively reproduce the data. The notable exception is a dispersion minimum in the longitudinal Cu-O bond-stretching branch along [100]. This discrepancy suggests that, while CDW order is weak, there exist significant dynamic charge correlations in the optic phonon range at low doping, near the edge of the superconducting dome.
I introduction
Charge-density-wave correlations appear to be universally present in the cuprate phase diagram and have been directly observed in X-ray scattering experiments [1, 2, 3]. Static CDW order with small modulated charge has been stabilized in a rather narrow doping range, and only at low temperatures. It occurs at a wavevector close to mid-way between the zone center and the zone boundary, along the direction parallel to the Cu-O bond of the planes. The static CDW order emerges from dynamic charge correlations that have been observed in a much larger portion of the phase diagram throughout the superconducting doping range [4, 5, 6, 7]. It is a distinct possibility that the dynamic charge correlations contribute to the superconducting pairing glue and/or are related to the formation of the pseudogap [7]. These correlations manifest themselves indirectly as a softening and/or broadening of certain phonons near [8]. The observed phonon renormalization resembles conventional Kohn anomalies that are characterized by phonon softening at specific wavevectors. However, there is no evidence for this softening from density-functional-theory (DFT) calculations of phonon dispersions in the cuprates [9, 10, 11, 12], whereas such calculations reproduce Kohn anomalies in other compounds rather well [8, 13, 14].

The strongest and most common phonon anomaly appears in the Cu-O bond-stretching branch, along [100], which softens and/or broadens close to . This anomaly has been reported for every superconducting cuprate family for which this branch has been measured. However, studies of this anomaly in lightly-doped superconducting cuprates are rare, and it has only been investigated in detail in the “214” materials (LSCO) and , which exhibit relatively low maximum values of and are prone to charge-spin “stripe” order.[15] It was recently shown that charge stripes in the 214 cuprates arise out of universal charge fluctuations at that are similar to, or indistinguishable from CDW correlations in other cuprates.[16]. Interestingly, in LSCO, the strength of the phonon renormalization was found to scale with , which points to a possible connection between charge fluctuations and the mechanism of superconductivty [4].

(Hg1201) is an exemplary cuprate superconductor, as it features a simple tetragonal crystal structure, minimal point disorder effects [18, 19], and a maximum of nearly 100 K (at the optimal hole doping level ), the highest value among single-layer cuprates (more than twice the maximum of the 214 cuprates). This has led to significant insights into the electronic properties of doped CuO2 planes, e.g., through detailed charge-transport [20, 21, 22, 23, 24, 25], magnetic neutron scattering [26, 27, 28, 29, 30, 31], and X-ray scattering experiments [32, 7, 33, 34]. Magnetic neutron scattering experiments have revealed no evidence for stripes [29, 30], yet there have been no detailed neutron scattering investigations of the phonons in this material. Prior inelastic X-ray scattering work, which focused on optimally-doped Hg1201, reveals steep downward dispersion in the Cu-O bond-stretching branch, with a minimum midway between the zone center and the zone boundary [34].
Here we report results of a comprehensive neutron scattering study of phonons in a very underdoped Hg1201 single crystal with ( = 55 K) [35, 22]. This doping level is well below ( = 71 K), where the CDW order was observed to be most prominent [36, 32]. Our emphasis is on the optic modes of predominantly oxygen character illustrated in Fig. 1. In order to overcome formidable technical challenges associated with the relatively high neutron absorption of Hg and with the measurement of a relatively small sample, we applied a new software-based technique to analyze time-of-flight (TOF) neutron scattering data. We also performed DFT calculations and found good qualitative agreement with the experiment. One notable exception is the bond-stretching phonon anomaly that appeared as a dip in the experimental dispersion not predicted by DFT. This feature is weaker than in optimally-doped Hg1201, for which it was previously reported based on inelastic X-ray scattering measurements. [34] Nevertheless, the result indicates the presence of considerable dynamic charge correlations near the edge of the superconducting dome.
II methods
Our new approach to TOF neutron data analysis covers a large volume of reciprocal space including high energy optic phonons, and works best for large (at least 10 g) single-crystalline samples with a relatively small mosaic. Nevertheless, we demonstrate here the feasibility of the technique using a sample formed of about 30 co-aligned crystals, with total mass of about 2 g, and mosaic of appoximately . Similar Hg1201 samples with higher doping levels were used in prior inelastic magnetic neutron scattering experiments. [29, 30] Conventional neutron scattering measurements of detailed phonon dispersions are challenging for such a relatively small sample. An additional complication in the case of Hg1201 is the relatively high absorption cross section of Hg.
We wrote software called Phonon Explorer [37] to efficiently mine the large TOF neutron scattering datasets, which vastly improves accuracy and statistics compared to conventional data analysis. This software automates the generation of single-Q energy cuts, background subtraction, fitting, and other tasks, which allowed us to efficiently examine a very large reciprocal space volume of around 100 Brillouin zones. It also allowed us to isolate coherent one-phonon spectra from spurious contamination due to the aluminum sample holder and from sample-intrinsic incoherent scattering. In our notation, an arbitrary reduced wave vector is defined as in reciprocal lattice units, with parallel to the Cu-O bond-direction, and perpendicular to the Cu-O plane, and , and room-temperature lattice parameters Å and Å. We denote wavevectors in the extended Brillouin zone as Q , with {100} and [001].
II.1 Experimental Details
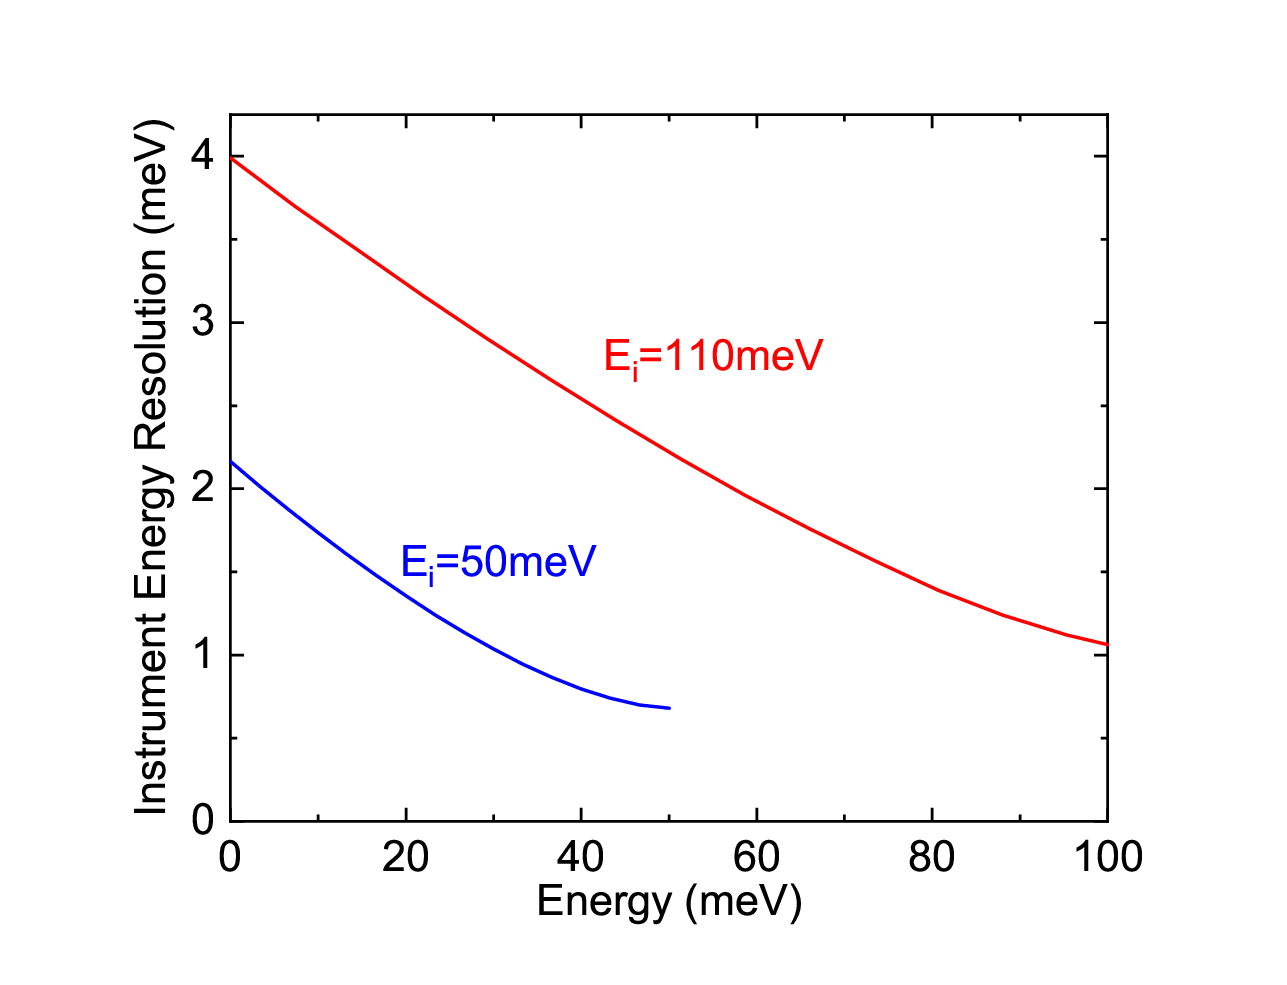
The experiment was performed on the ARCS spectrometer at the Spallation Neutron Source with two incident energies: = 50 meV and = 110 meV. Fig. 2 shows the calculated instrument resolution function.[17] Intrinsic -resolution of the instrument generally varies with , energy and sample shape.[38] In our experiment, the momentum width of the representative Bragg peak at = [4,0,0] was 0.07 along H, 0.15 along K, and 0.12 along L. These values are always smaller than the binning in Q-space used in data analysis, so the effective -resolution is equal to the binning. The measurements were performed at two temperatures: 10 K and 450 K. The sample was mounted with one of the two equivalent -axes vertical, and the sample orientation was scanned over 90∘ about the vertical axis. The scans covered a large part of reciprocal space in the () scattering plane. The K-direction was perpendicular to the scattering plane. The coverage along the K-direction was about for = 50 meV and for = 110 meV.

II.2 Data Analysis
The data analysis procedure utilizes the Phonon Explorer software.[37] that leverages the entire data set to overcome the relatively poor counting statistics in any single constant-Q energy cut. For example, to look at the zone-center bond-stretching phonon, we made constant-Q cuts at all the zone-center wavevectors with the momentum transfer primarily along [100]: (3,0,0), (4,0,0), (5,0,0), (4 1,0) and (4,-1,0). We integrated along [001] from to (there exist no data for ). The integration range along [001] was chosen such that there was no observable -dependence in the data.
An accurate background determination was necessary in order to obtain the best results. Phonon Explorer has a built-in user-controlled background determination and subtraction framework, wherein the background is effectively read out from regions of (Q,) in which one-phonon scattering intensity is negligible.
In the case of the bond-stretching phonon branch, we determined the background as follows:
At each Q:
- 1.
Pick another wavevector, Q’, as close to Q as possible, such that Q’Q with no significant one-phonon scattering in the energy-range of the phonon of interest;
- 2.
Generate energy cuts at both Q and Q’ and smooth both;
- 3.
The background is the point-by-point minimum of the two curves.
Restriction to the same wavevector magnitudes in step 1 ensured the removal of powder contributions to the scattering.

This procedure is illustrated in Fig. 3. The energy cut at Q for which we wish to determine the background is shown in Fig. 3a. The peak at 69 meV originates from the bond-stretching phonon. It is known that this branch disperses downward toward the zone boundary,[34] and therefore we do not expect any phonons near this energy at . In order to keep the magnitude of the wavevector the same, we increase the magnitude of to 5.57, so Q’ . The cut at Q’ is shown in Fig. 3b. The solid lines in Figs. 3a,b represents the result of our smoothing procedure, which involved an automatic fit to a set of closely-spaced Gaussian peaks. Step 3 is illustrated in Fig. 3c.
Raw data around 69 meV at three zone-center wavevectors together with the background determined by our procedure are shown in Fig. 4. This procedure can be generalized to more than one Q’ wavevector, if necessary.
This algorithm does not enable the determination of the background for the data below approximately 30 meV, because some appreciable one-phonon intensity appears at all wavevectors. In this case, we assumed a linear background that goes through the minima of the cut (Fig. 5).
Background-subtracted data were analyzed using multizone fitting [39], whereby peak positions and linewidths for phonons at a given reduced wavevector were fixed to be the same in different Brillouin zones according to Bloch’s theorem, but amplitudes were allowed to vary independently. Results of such fits (on top of the estimated background) are shown as dashed lines in Fig. 4, and as solid lines in Fig. 5. Multizone fitting was found to greatly improve the precision of the peak position and linewidth determination, as it effectively combines counting statistics from different Brillouin zones. It also allowed the extraction of phonon eigenvectors from phonon intensities if sufficiently many Brillouin zones were included (Fig. 6). The fit function was a sum of Gaussian peaks and did not explicitly include instrument resolution. The latter would have required a significant upgrade of the software, since the resolution function of TOF instruments has a complex and asymmetric functional form. This upgrade is planned for the future and outside the scope of the present work.
Using data from more than one Brillouin zone automatically differentiates phonon peaks in the constant- scans from spurious peaks such as multiple scattering peaks, since the former obey Bloch’s theorem and the latter do not. Note that we do not attempt to separate multiple-scattering and other contributions to the background from the data.
II.3 DFT Calculations
We found that DFT calculations for Hg1201 give different phonon dispersions depending on the approximations that were made. Here we discuss the calculation that gave the best agreement with the data, as illustrated in Fig. 1f.
We calculated ab-initio lattice dynamical properties of Hg1201 in the harmonic approximation using the frozen-phonon technique as implemented in the PHONOPY package [40]. For the force calculations, we employed DFT within the local density approximation [41]. A combination of atom-centered Gaussian functions and plane waves was used to represent the electronic wave functions and density, respectively, as implemented in the Quickstep [42] algorithm in the CP2K code [43]. The MOLOPT-DZVP-SR-GTH [44] Gaussian basis-set type was used for all atoms along with a plane-wave cutoff of 1000 Ry for the finest integration grid and a Ry convergence requirement on the total energy. The O-, O-, Hg-, Hg-, Cu-, Cu-, Ba- and Ba- electrons were included as valence states and norm-conserving pseudopotentials of the GTH type [45] were used to represent all others.
Before force constants were calculated, we optimized the atomic positions until the maximum force on any atom was less than Hartree/Bohr while keeping the tetragonal unit cell fixed at the experimental lattice parameters. During optimization, Brillouin-zone integrations were performed using a 12x12x10 Monkhorst-Pack -point grid and Fermi-Dirac smearing with a 300 K effective temperature. In order to compute the force constants, 2x2x2 supercells were constructed from the optimized unit cell and a reduced 6x6x5 -point grid was used for Brillouin zone integrations. The supercell dimensions were chosen so that contributions from periodic images were negligible; we determined this by observing that the forces on the atoms furthest from the displaced site are more than an order of magnitude smaller than the forces on the closest atoms within the supercell. A total of seven supercells with symmetry inequivalent displacements of 0.02 Bohr were used to construct the force constant matrix. The phonon dispersions and eigenvectors were calculated from the force constants using PHONOPY.
In order to determine which DFT phonon branches have non-negligible intensity for the selected constant Q slices analyzed with the Phonon-Explorer software, we computed the theoretical neutron scattering intensities using the SNAXS software package[46]. For the calculation of the theoretical neutron scattering intensities, we used an incident neutron energy of 50 meV. Comparisons between longitudinal DFT phonon dispersions (solid lines) and longitudinal optic branches determined from the neutron data along q are presented in Fig. 1f.

III results
The main scientific goal was to find out whether a bond-stretching phonon anomaly is present in strongly underdoped Hg1201 and to search for an effect in the Cu-O plane bond-buckling branch. Therefore, we primarily focused on optic phonons of predominantly oxygen character whose zone-center eigenvectors [47] are illustrated in Fig. 1. Specifically, we carefully measured the dispersion of the bond-stretching branch (Fig. 1c), distinguishing it from the Cu-O plane bond-bending branch (Fig. 1b), idendified the apical oxygen phonons in order to learn about their possible anticrossing with the bond-stretching branch (Fig. 1d,e), and measured the bond-buckling branch (Fig. 1a) with high precision at both 10 K and 450 K. We also measured dispersions of the longitudinal phonons below 45 meV along [100] to ensure that the calculations gave the right results. These measurements also involved a search for possible signatures of incipient CDW order in the lowest optic branch around 6 meV. As the sample was mounted in the () scattering plane, the natural reciprocal space direction for the phonon dispersion in the -plane is along [100]. Access to the [110] direction was limited to the first and parts of the second -plane Brillouin zones, which precluded measurements of LO and LA phonons, but allowed investigation of some TO modes in this direction.

III.1 Bond-Stretching and Bond-Bending Phonons
We start our discussion with the bond-stretching phonon branch, which is the primary focus of this work. Background-subtracted zone-center spectra analyzed using the multizone fitting procedure are shown in Fig. 6. Even though the individual scans are rather noisy, the multizone fit gives a very accurate phonon energy of 68.3 0.2 meV.
Representative background-subtracted data for the bond-bending branch at the zone center and half-way to the zone boundary are shown in Fig. 7. The multizone fit includes additional energy cuts (not shown) at Q and (4,-1,0).
Zone-boundary spectra containing both the bending (50 meV) and stretching (59 meV) phonons are shown in Fig. 8a,b. Note that the data in Fig. 9 suggest a somewhat higher energy of 60.3 meV compared with 59 meV in Fig 8, which is due to a tighter binning in momentum space in Fig. 9. This discrepancy is consistent with upward dispersion of this branch on approach to the zone boundary.
We can distinguish the two by how their amplitude varies from zone to zone. The bond-stretching branch involves only the motion of plane oxygen atoms, as shown in Fig. 8c, so the scattering intensity from this phonon should be independent of . On the other hand, the bending phonon involves Cu and the other two plane oxygens, as illustrated in Fig. 8d. This eigenvector gives constructive interference between scattering from O and Cu for , and destructive interference for . Since the intensity enhancement at is seen only in the 50 meV mode, we assign it to the bending branch, and the 59 meV mode to the stretching branch. Based on this determination, we conclude that the bending and stretching branches do not cross. Eigenvectors extracted from our DFT results support this conclusion.
The dispersion of the bond-stretching branch is shown in Fig. 9. The phonon starts out with a zone-center energy of 68.3 meV, and then disperses downward along [100] toward the zone boundary, with a minimum around . The peak width shows broadening as the phonon disperses away from the zone center, but this broadening is consistent with the dispersion-broadened resolution (Fig. 9d). For example, at , due to a relatively steep dispersion, the phonon energies on one end of the binning range are about 7 meV higher than on the other end. This causes an effective increase of the width compared to the zone center or zone boundary, where there is little dispersion. Thus we do not observe any measurable enhanced intrinsic broadening of the bond-stretching or bond-bending phonons around . DFT calculations predict a smooth downward dispersion of the bond-stretching phonon branch, and an upward dispersion of the bond-bending branch (Fig. 8c). These calculated dispersions qualitatively reproduce the data, but they do not show the dip near that the bond-stretching branch exhibits. This experimentally-determined dispersion minimum in the bond-stretching branch in cuprates has been interpreted in the past as a signature of anomalous phonon softening. [8]
The previous IXS work for optimally-doped Hg1201 revealed an even larger phonon softening, along with a broadening.[34] These differences may be due to different hole doping levels of the two samples.


III.2 Apical Oxygen Phonons
It is important to know whether or not transverse optic branches along [100] that originate from the apical oxygen phonons cross the bond-stretching branch. We made a careful determination of their energies. There should be two branches with apical oxygen bond-stretching character: one that originates from the Raman-active zone-center mode, where the apical oxygens move in opposite directions, and another one that originates from the IR-active zone-center mode, where the apical oxygens move in the same direction against the Cu/Hg. We found these branches at 73 meV and 76 meV. The background was obtained with Q’, because the intensity of both phonons vanishes at .
Cuts with different -values show very different results and, unlike for the in-plane vibrations, it was therefore not possible to bin the data with large . In order to improve statistics, we used fairly large binning along and after verifying that the phonon energies do not depend on or . The data around the zone center at many different -values are shown in Fig. 10. Multizone fitting clearly distinguishes between the two peaks, although both of them merge at some -values, whereas at other -values only one peak is clearly visible.

The rapid zone-to-zone intensity variation along [001] is not consistent with the simple eigenvectors proposed in Ref. 47. The most likely scenario is that the branches start to mix just a small distance from the zone center, within our binning range, so that the neutron data do not reflect the zone-center eigenvectors. We were not able to follow these branches further along [100], but it is safe to assume that they should be rather flat and well above the bond-stretching branch. Interactions between the bond-stretching branch and the apical-oxygen branches should be negligible, because of this difference in energy. Our DFT results confirm the flat dispersion of the apical modes and show no sign of mixing between the apical and the bond-streching branches (Fig. 1f).
III.3 Bond-buckling Phonons
In addition to the bond-stretching phonon anomaly, a similar, but weaker effect has been reported for an optic phonon (buckling) branch of (YBCO) that is characterized by planar oxygen vibration in the direction perpendicular to the planes, [48, 49].
In Hg1201, the equivalent zone-center mode is the silent mode that cannot be seen in Raman or IR spectra. We also looked at the branch that originates from this mode (Fig. 1a). In addition, this phonon branch is interesting due to its unusual structure factor: the zone-boundary buckling phonon at the two-dimensional reduced wavevector can be misidentified as a magnetic excitation [50]. We carefully measured its dispersion to see if the anomalous behavior seen in YBCO is also present in Hg1201. We note that this phonon was identified in previous neutron scattering work [29, 30] that focused on the magnetic excitations in underdoped Hg1201 near the antiferromagnetic wavevector and systematically excluded from the data analysis, but not studied in detail.
This mode can be (and has been, in the case of YBCO) mistaken for a magnetic excitation because its structure factor is strong at and vanishes at and . A momentum scan at the phonon energy from the two-dimensional zone center to will therefore give rise to a peak at . The structure factor for this phonon at the zone center is largest for Q or Q .[50] We found that this phonon appears near 31 meV, as shown in Fig. 11. The background is easy to determine by going to a nearby wavevector of Q’ , so the phonon intensity extracted from multizone fits is quite reliable. We used the intensity of this phonon to find out if there is any disorder of the plane oxygens along [001]. Disorder influences the functional form of the intensity of the phonon as a function of (Fig. 11c) via the Debye-Waller factor. We found that the intensity as a function of is consistent with negligible disorder effects (the fit gives ).

We observe a significant dispersion anisotropy between [100] and [110] (Fig. 12b). The dispersion along [100] turns up around at both 10 K and 450 K whereas the dispersion along [110] is flat. The apparent phonon broadening in the range can be attributed to the dispersion-enlarged effective energy resolution and, unlike for YBCO, is therefore not intrinsic.

III.4 Low-Lying Branches
Recently, attention has focused on the lowest optic branch, because in YBCO it shows dispersion dips and/or linewidth enhancement around , where the CDW has been observed.[1, 2, 3] Ref. 33 found that low-energy phonon dispersions in optimally-doped Hg1201 were consistent with a Born-van-Karman model calculation and did not report any anomalous behavior. We carefully looked at this branch and found no dispersion dips, in agreement with previous work for optimally-doped Hg1201 [33]. Its linewidth is resolution-limited, and the spectra at 10 K and 450 K are indistinguishable, apart from the Bose factor.
We also extracted phonon dispersions for branches with symmetry (Fig. 1f) ( symmetry refers to phonon eigenvectors that are symmetric with respect to reflections about the ab-plane and about the ac-plane) to see how well the DFT calculation matches the data. Peak positions were obtained using multizone fitting [39] (Fig. 5). We find good qualitative agreement between the experimental data and the DFT results for all the branches considered.
IV Discussion and Conclusions
Ref. 34 focused on the high-energy longitudinal optic modes in optimally-doped Hg1201 and reported anomalous softening and broadening of Cu-O bond-stretching phonons half-way to the zone boundary along [100], similar to phonon anomalies in other cuprates. However, lattice dynamical calculations give a complicated picture of phonons at energies near the bond-stretching phonon (60-80 meV), with several branches possibly contributing to the signal [51]. This work also raised the possibility that some, or all of the anomalous behavior reported in Ref. 34 originates from interactions among these branches, and not from electron-phonon coupling [52]. We found, however, that DFT calculations of phonons in Hg1201 give different phonon energies depending on the approximations taken, and consequently that their predictive power is insufficient. The overall good agreement between the data and DFT illustrated by Fig. 1 was obtained by trying different approximations until the best agreement was obtained. Based on this result, we conjecture that other methods of calculating lattice dynamics for this system are equally ambiguous and that it is essential to perform experiments to obtain the correct picture of the lattice dynamics.
Phonon Explorer enabled us to efficiently test different binning scenarios, find good places in reciprocal space to read out background, simultaneously obtain data from multiple Brillouin zones, and perform multizone fitting. [39] In the current work, we used Phonon Explorer to analyze data taken on a relatively small sample of Hg1201. We found that the branch-crossing interplay suggested in Ref. 51, does not take place because the apical oxygen branches are at higher energy than the bond-bending and bond-stretching branches. As a result, they should not interact with the bond-stretching branch, which disperses downward from the zone-center energy of 68.3 meV. The longitudinal optic Cu-O bond-bending branch starting from the zone center phonon illustrated in Fig. 1f disperses upward from 41 meV to 50 meV at the zone boundary. Analysis of phonon intensities at the zone boundary showed that the two bond-stretching branches retain their pure character and do not mix as explained. We emphasize that none of our DFT calculations reproduced the experimentally-observed minimum in the bond-stretching phonon dispersion. This is a well-known property of all phonon anomalies away from the zone center in the cuprates, and likely results from an unconventional origin of the CDW and associated fluctuations.
The anomalous bond-stretching phonon softening in our underdoped sample is about 50% of the softening at optimal doping,[34] and we find no significant broadening beyond experimental uncertainty of any phonons, despite our smaller energy resolution width. This result indicates that the phonon anomaly is enhanced at optimal doping compared with the underdoped composition, similar to previous results for LSCO [12, 4].
This stronger softening at optimal doping may lead to a mixing with the bond-bending branch, which was not observed in the X-ray measurements as a separate peak. [34] Future neutron scattering measurements of optimally-doped Hg1201 should allow a more accurate determination of the dispersion of all phonons and of the effects of branch crossings. In addition, it will be illuminating to see if any new phonon anomalies appear at intermediate doping, where the CDW correlations are strongest. [1, 2, 3]
We also determined that the silent bond-buckling mode, which could be mistaken for a magnetic excitation [50], appears at 31 meV. In contrast to YBCO, [48, 49] its dispersion in Hg1201 is not consistent with significant electron-phonon coupling.
Neutron scattering measurements of moderately-doped and optimally-doped Hg1201 revealed a dispersionless magnetic mode with energy meV throughout the entire Brillouin zone, and the mode was associated with the pseudogap formation. [53, 54] We did not observe this mode, presumably because its strength considerably weakens at low doping. We also note that there are no phonons near this energy in the experiment and in our DFT calculations. Consequently, this mode reported at higher doping levels is not associated with phonons (see Fig. 1f).
To conclude, we find qualitative agreement between experimental and calculated phonon dispersions for a highly underdoped sample of the prototypical copper-oxide superconductor , except for the experimentally-observed phonon anomaly in the bond-stretching branch, which is absent in the calculations. This anomaly appears to be weaker than at optimal doping where it was previously observed via inelastic X-ray scattering. This result demonstrates that significant low energy charge fluctuations that renormalize phonons extend to the strongly underdoped side of the superconducting dome in this family of the copper oxides and demonstrates universality of this phenomenon in the cuprates. We hope that the present work will motivate a new generation of quantitative investigations of phonon spectra in other quantum materials.
V acknowledgements
We thank M. K. Chan, Y. Tang, and G. Yu for their help with sample preparation and R. Heid for helpful discussions and preliminary DFT calculations. The work at the University of Colorado was supported by the DOE, Office of Basic Energy Sciences, Office of Science, under Contract No. DE-SC0006939. The work at the University of Minnesota was funded by the Department of Energy through the University of Minnesota Center for Quantum Materials under DE-SC-0016371. This research used resources at the Spallation Neutron Source, a DOE Office of Science User Facility operated by the Oak Ridge National Laboratory.
References
- [1] E. Blackburn, Physica B: Condensed Matter 460, 132 (2015).
- [2] R. Comin and A. Damascelli, Annual Review of Condensed Matter Physics 7, 369 (2016).
- [3] G. Ghiringhelli, M. Le Tacon, M. Minola, S. Blanco-Canosa, C. Mazzoli, N. B. Brookes, G. M. De Luca, A. Frano, D. G. Hawthorn, F. He, T. Loew, M. M. Sala, D. C. Peets, M. Salluzzo, E. Schierle, R. Sutarto, G. A. Sawatzky, E. Weschke, B. Keimer, and L. Braicovich, Science 337, 821 (2012).
- [4] S. R. Park, T. Fukuda, A. Hamann, D. Lamago, L. Pintschovius, M. Fujita, K. Yamada, and D. Reznik, Physical Review B 89, 020506 (2014).
- [5] L. Chaix, G. Ghiringhelli, Y. Peng, M. Hashimoto, B. Moritz, K. Kummer, N. Brookes, Y. He, S. Chen, S. Ishida, et al., Nature Physics 13, 952 (2017).
- [6] R. Arpaia, S. Caprara, R. Fumagalli, G. De Vecchi, Y. Peng, E. Andersson, D. Betto, G. De Luca, N. Brookes, F. Lombardi, et al., Science 365, 906 (2019).
- [7] B. Yu, W. Tabis, I. Bialo, F. Yakhou, N. Brookes, Z. Anderson, Y. Tang, G. Yu, and M. Greven, arXiv preprint arXiv:1907.10047 (2019).
- [8] D. Reznik, Physica C: Superconductivity 481, 75 (2012).
- [9] D. Reznik, G. Sangiovanni, O. Gunnarsson, and T. Devereaux, Nature 455, E6 (2008).
- [10] S. Johnston, F. Vernay, B. Moritz, Z.-X. Shen, N. Nagaosa, J. Zaanen, and T. Devereaux, Physical Review B 82, 064513 (2010).
- [11] L. Pintschovius, physica status solidi (b) 242, 30 (2005).
- [12] D. Reznik, L. Pintschovius, M. Ito, S. Iikubo, M. Sato, H. Goka, M. Fujita, K. Yamada, G. Gu, and J. Tranquada, Nature 440, 1170 (2006).
- [13] Y. Zhang, C. Yang, A. Alatas, A. H. Said, N. P. Salke, J. Hong, and J.-F. Lin, Physical Review B 100, 075145 (2019).
- [14] R. Heid, L. Pintschovius, W. Reichardt, and K.-P. Bohnen, Physical Review B 61, 12059 (2000).
- [15] S. A. Kivelson, I. P. Bindloss, E. Fradkin, V. Oganesyan, J. M. Tranquada, A. Kapitulnik, and C. Howald, Rev. Mod. Phys. 75, 1201 (2003).
- [16] H. Miao, J. Lorenzana, G. Seibold, Y. Peng, A. Amorese, F. Yakhou-Harris, K. Kummer, N. Brookes, R. Konik, V. Thampy, et al., Proceedings of the National Academy of Sciences 114, 12430 (2017).
- [17] D. L. Abernathy, M. B. Stone, M. J. Loguillo, M. S. Lucas, O. Delaire, X. Tang, J. Y. Y. Lin, and B. Fultz, Review of Scientific Instruments 83, 015114 (2012), https://doi.org/10.1063/1.3680104 .
- [18] H. Eisaki, N. Kaneko, D. Feng, A. Damascelli, P. Mang, K. Shen, Z.-X. Shen, and M. Greven, Physical Review B 69, 064512 (2004).
- [19] N. Barišić, Y. Li, X. Zhao, Y.-C. Cho, G. Chabot-Couture, G. Yu, and M. Greven, Physical Review B 78, 054518 (2008).
- [20] N. Barišić, M. K. Chan, Y. Li, G. Yu, X. Zhao, M. Dressel, A. Smontara, and M. Greven, Proceedings of the National Academy of Sciences 110, 12235 (2013).
- [21] M. Chan, M. Veit, C. Dorow, Y. Ge, Y. Li, W. Tabis, Y. Tang, X. Zhao, N. Barišić, and M. Greven, Physical Review Letters 113, 177005 (2014).
- [22] M. K. Chan, N. Harrison, R. D. Mcdonald, B. Ramshaw, K. A. Modic, N. Barišić, and M. Greven, Nature Communications 7, 12244 (2016a).
- [23] P. Popčević, D. Pelc, Y. Tang, K. Velebit, Z. Anderson, V. Nagarajan, G. Yu, M. Požek, N. Barišić, and M. Greven, npj Quantum Materials 3, 42 (2018).
- [24] N. Barisic, M. Chan, M. J. Veit, C. Dorow, Y. Ge, Y. Li, W. Tabis, Y. Tang, G. Yu, X. Zhao, et al., New Journal of Physics (2019).
- [25] D. Pelc, M. Veit, M. Chan, C. Dorow, Y. Ge, N. Barišić, and M. Greven, arXiv preprint arXiv:1902.00529 (2019).
- [26] Y. Li, V. Balédent, N. Barišić, Y. Cho, B. Fauqué, Y. Sidis, G. Yu, X. Zhao, P. Bourges, and M. Greven, Nature 455, 372 (2008).
- [27] Y. Li, N. Egetenmeyer, J. Gavilano, N. Barišić, and M. Greven, Physical Review B 83, 054507 (2011a).
- [28] Y. Li, V. Balédent, N. Barišić, Y. Cho, Y. Sidis, G. Yu, X. Zhao, P. Bourges, and M. Greven, Physical Review B 84, 224508 (2011b).
- [29] M. Chan, C. Dorow, L. Mangin-Thro, Y. Tang, Y. Ge, M. Veit, G. Yu, X. Zhao, A. Christianson, J. Park, et al., Nature Communications 7, 10819 (2016b).
- [30] M. K. Chan, Y. Tang, C. Dorow, J. Jeong, L. Mangin-Thro, M. Veit, Y. Ge, D. Abernathy, Y. Sidis, P. Bourges, et al., Physical Review Letters 117, 277002 (2016c).
- [31] Y. Tang, L. Mangin-Thro, A. Wildes, M. K. Chan, C. J. Dorow, J. Jeong, Y. Sidis, M. Greven, and P. Bourges, Physical Review B 98, 214418 (2018).
- [32] W. Tabis, B. Yu, I. Bialo, M. Bluschke, T. Kolodziej, A. Kozlowski, E. Blackburn, K. Sen, E. M. Forgan, M. v. Zimmermann, et al., Physical Review B 96, 134510 (2017).
- [33] M. d’Astuto, A. Mirone, P. Giura, D. Colson, A. Forget, and M. Krisch, Journal of Physics: Condensed Matter 15, 8827 (2003).
- [34] H. Uchiyama, A. Baron, S. Tsutsui, Y. Tanaka, W.-Z. Hu, A. Yamamoto, S. Tajima, and Y. Endoh, Physical review letters 92, 197005 (2004).
- [35] A. Yamamoto, W.-Z. Hu, and S. Tajima, Phys. Rev. B 63, 024504 (2000).
- [36] W. Tabis, Y. Li, M. Le Tacon, L. Braicovich, A. Kreyssig, M. Minola, G. Dellea, E. Weschke, M. Veit, M. Ramazanoglu, et al., Nature communications 5, 5875 (2014).
- [37] D. Reznik, “https://github.com/dmitryr1234/phonon-explorer,” (2019).
- [38] G. Ehlers, A. A. Podlesnyak, J. L. Niedziela, E. B. Iverson, and P. E. Sokol, Review of Scientific Instruments 82, 085108 (2011), https://doi.org/10.1063/1.3626935 .
- [39] D. Parshall, R. Heid, J. L. Niedziela, T. Wolf, M. B. Stone, D. L. Abernathy, and D. Reznik, Physical Review B 89, 064310 (2014).
- [40] A. Togo and I. Tanaka, Scripta Materialia 108, 1 (2015).
- [41] S. Goedecker, M. Teter, and J. Hutter, Physical Review B 54, 1703 (1996).
- [42] J. VandeVondele, M. Krack, F. Mohamed, M. Parrinello, T. Chassaing, and J. Hutter, Computer Physics Communications 167, 103 (2005).
- [43] J. Hutter, M. Iannuzzi, F. Schiffmann, and J. VandeVondele, Wiley Interdisciplinary Reviews: Computational Molecular Science 4, 15 (2014).
- [44] J. VandeVondele and J. Hutter, The Journal of chemical physics 127, 114105 (2007).
- [45] C. Hartwigsen, S. Gœdecker, and J. Hutter, Physical Review B 58, 3641 (1998).
- [46] D. Parshall, “https://github.com/danparshall/snaxs,” (2016).
- [47] M. Stachiotti, E. P. y Blanca, R. Migoni, C. Rodriguez, and N. Christensen, Physica C: Superconductivity 243, 207 (1995).
- [48] D. Reznik, B. Keimer, F. Dogan, and I. A. Aksay, Physica C: Superconductivity 235, 1733 (1994).
- [49] M. Raichle, D. Reznik, D. Lamago, R. Heid, Y. Li, M. Bakr, C. Ulrich, V. Hinkov, K. Hradil, C. Lin, et al., Physical Review Letters 107, 177004 (2011).
- [50] H. F. Fong, B. Keimer, P. W. Anderson, D. Reznik, F. Doğan, and I. A. Aksay, Physical Review Letters 75, 316 (1995).
- [51] T. Bauer and C. Falter, Journal of Physics: Condensed Matter 22, 055404 (2010).
- [52] E. H. da Silva Neto, P. Aynajian, A. Frano, R. Comin, E. Schierle, E. Weschke, A. Gyenis, J. Wen, J. Schneeloch, Z. Xu, et al., Science 343, 393 (2014).
- [53] Y. He, S. Wu, Y. Song, W.-S. Lee, A. H. Said, A. Alatas, A. Bosak, A. Girard, S. M. Souliou, A. Ruiz, M. Hepting, M. Bluschke, E. Schierle, E. Weschke, J.-S. Lee, H. Jang, H. Huang, M. Hashimoto, D.-H. Lu, D. Song, Y. Yoshida, H. Eisaki, Z.-X. Shen, R. J. Birgeneau, M. Yi, and A. Frano, Phys. Rev. B 98, 035102 (2018).
- [54] Y. Li, G. Yu, M. K. Chan, V. Balédent, Y. Li, N. Barisic, X. Zhao, K. Hradil, R. A. Mole, Y. Sidis, P. Steffens, P. Bourges, and M. Greven, Nature Physics 8, 404 (2012).