

Antiferromagnetic and Orbital Ordering on a Diamond Lattice Near Quantum Criticality
Abstract
We present neutron scattering measurements on powder samples of the spinel FeSc2S4 that reveal a previously unobserved magnetic ordering transition occurring at 11.8(2) K. Magnetic ordering occurs subsequent to a subtle cubic-to-tetragonal structural transition which distorts Fe coordinating sulfur tetrahedra lifting the orbital degeneracy. The application of 1 GPa hydrostatic pressure appears to destabilize this Néel state, reducing the transition temperature to 8.6(8) K and redistributing magnetic spectral weight to higher energies. The relative magnitudes of ordered and fluctuating moments show that the magnetically ordered ground state of FeSc2S4 is drastically renormalized and in proximity to criticality.
pacs
75.10.Kt, 75.10.Jm, 75.25.Dk, 75.40.GbIn a quantum spin liquid quantum fluctuations compete with, and ultimately overwhelm, any tendency towards the formation of a classical long range magnetic order, effectively melting the staggered magnetization at zero temperature. The search for this precarious state of matter in a real material is now a decades old preeminent theme of condensed matter physics [1]. In insulating antiferromagnets, research has largely been concentrated on geometrically frustrated materials, where the underlying lattice structure results in a competition amongst magnetic exchange interactions. The result is an extensive degeneracy that promotes quantum fluctuations and precludes the development of a staggered magnetization [2]. But frustration is not the only game in town. Other degrees of freedom may enhance magnetic fluctuations. For example, orbital degeneracy which can in turn enhance quantum fluctuations and suppress magnetic order [3]. The orbital degrees of freedom may even remain disordered in the presence of a staggered magnetization forming an orbital liquid state [4, 5, 6], or both spins and orbitals may fail to develop temperature independent correlations in a so-called spin-orbital liquid state [7, 8].
Spinel compounds, AB2X4, with magnetic ions occupying the A-site diamond sublattice form a simple, and therefore important, three dimensional frustrated lattice where competing exchange interactions promote unconventional magnetic ground states stabilized by fluctuations [9, 10, 11, 12, 13]. Amongst the A-site spinels, FeSc2S4 holds a special place as the Fe2+ (3d6) ions are both magnetically and orbitally active. The tetrahedral crystal field of the A-site environment splits the Fe 3d manifold into a lower doublet and higher energy triplet, while Hund’s coupling yields a high spin (S=2) configuration, with a single hole occupying the doublet. Thus, the Fe2+ ion in FeSc2S4 is Jahn-Teller active yet, surprisingly, there have been no reported observations of any structural distortion or magnetic ordering down to 50 mK. In particular, while the magnetic susceptibility exhibits Curie-Weiss like behaviour with K [14, 15]; there is no clear indication of a phase transition. Moreover the specific heat only exhibits a broad peak with maximum centered at 8 K. Neutron scattering measurements on polycrystalline samples conducted so far have not provided evidence for magnetic ordering. The data show intense dispersive spin excitations emerging from momentum transfer corresponding to the cubic (100) position with an apparent excitation gap of 0.2 meV [16].
Based on these experimental observations it was proposed that FeSc2S4 is a spin-orbital liquid: an exotic state arising from competition between on site spin-orbit coupling and Kugel-Khomskii exchange in the Fe diamond sub-lattice [17, 18]. While spin and orbital ordering is favoured by the exchange interactions, atomic spin orbit coupling favours local spin-orbital singlets and FeSc2S4 is predicted to lie near the quantum critical point separating the spin-orbital singlet phase from a magnetically and orbitally ordered state. This hypothesis appears supported by terahertz and far infrared optical spectroscopy measurements which have revealed low energy (4.5 meV) excitations consistent with a so-called spin-orbiton [19, 20, 21], an excitation of entangled spin and orbital degrees of freedom. In this scenario, varying the magnetic exchange interactions relative to the spin orbit coupling through the application of hydrostatic pressure might drive FeSc2S4 through the quantum critical point, stabilizing antiferromagnetism [17].

Here we show that contrary to the spin-orbital liquid scenario, FeSc2S4 undergoes a magnetic ordering transition concomitant with the maximum observed in specific heat. Our data also indicate a subtle tetragonal, Jahn-Teller-like, distortion occurring at higher temperatures which lifts the orbital degeneracy so that the low temperature dynamics can be described in terms of a spin-only Hamiltonian. Additionally, we find that the application of hydrostatic pressure of 1 GPa reduces the magnetic ordering temperature and shifts inelastic spectral weight to higher energies, apparently destabilizing the ordered state. The Néel state in FeSc2S4 is strongly renormalized with a sublattice magnetization that is reduced to 44(1)% of the full saturation moment and 40(2)% of the inelastic spectral weight associated with non-spin wave fluctuations. These results show that FeSc2S4 is indeed near a quantum critical point, but surprisingly, on the magnetically ordered side of this critical point.
Methods
Powder samples of FeSc2S4 were synthesized by solid state reaction of elemental Fe, Sc and S in an evacuated quartz tube. All materials were handled in a glove box using standard air free techniques. The sample was initially characterized by powder x-ray diffraction at 300 K using a Cu- x-ray diffractometer. Additional high resolution synchrotron x-ray diffraction measurements were acquired 100 K using the powder diffractometer 11-BM located at the Advanced Photon Source, these are described in Appendix A.1.
Specific heat measurements were carried out on a cold pressed pellet of FeSc2S4 using a Quantum Designs PPMS. The MACS spectrometer at the NIST center for Neutron Research was used for neutron scattering measurements. For measurements at ambient pressures, the 0.8 g sample of FeSc2S4 was mounted in a standard Al sample can. Measurements under hydrostatic pressure were conducted with the sample loaded into a stainless steel pressure cell and pressurized to 1 GPa with He gas. The lattice parameter of a pyrolytic graphite standard loaded into the pressure cell just above the sample was used to monitor the quasi-hydrostatic pressure at low temperature. MACS was operated with a fixed final neutron energy of either 3.7 meV or 2.4 meV with appropriate combinations of Be and BeO filters located before and after the sample to suppress higher order neutron contamination. No incident beam filter was used for measurements with incident energies above 5 meV, and data for these energies were corrected to account for contributions to the monitor count rate from higher order neutrons [22]. To compare absolute intensities between the 0 kbar and 10 kbar measurements data collected in the neutron attenuating pressure cell were corrected for the measured energy dependent neutron transmission of the cell. Neutron diffraction measurements on the same sample were performed on BT-1 at NIST utilizing a Cu(311) monochrometer, neutron wavelength 1.54 Å, and 60’ collimation before the monochrometer. A set of high resolution neutron scattering measurements were conducted on the CNCS spectrometer located at the Spallation Neutron Source at Oak Ridge National Lab [23]. For these measurements a separate 0.45 g powder sample was prepared and CNCS was operated with a fixed incident neutron energy of 1.55 meV and a resulting elastic energy resolution of 0.034 meV (FWHM). For all scattering measurements background signal contributions from the sample environment were subtracted and signal count rates were converted to absolute values of the scattering cross-section using the integrated intensity from a nuclear Bragg reflection [24].
We explicitly define the normalized magnetic neutron scattering intensity as used in this work to aid accurate discussion of sum-rules presented later. The magnetic neutron scattering cross section for a powder sample as a function of momentum transfer , and energy transfer is expressed as
| (1) |
where N is the number of unit cells, and are the incident and final neutron wavevectors respectively, cm is the magnetic scattering length, and is the Debye Waller factor which we set to unity for low T and low Q. The spherically averaged dynamic structure factor is given by
| (2) |
where is the Landé g-factor and is the magnetic form factor. In this work we report the normalized inelastic neutron scattering intensity per Fe
| (3) |
Rietveld refinement of neutron and synchrotron diffraction data was carried out using the General Structure Analysis system (GSAS) complimented with the SARAh program [25].
Results
Our main experimental finding is presented in Fig. 1 (a) which displays a false color map of the temperature dependent neutron diffraction intensity as measured on MACS. The most prominent features are two structural Bragg peaks at Å-1 and Å-1 that saturate the color scale and are independent of temperature below 20 K. More importantly, there are five temperature dependent Bragg reflections which emerge in unison below 12 K. Located at: 0.6 Å-1, 0.84 Å-1, 1.33 Å-1, 1.46 Å-1, and 1.77 Å-1, these peaks were not reported for FeSc2S4, although published diffraction data are not inconsistent with these findings as their sensitivity is insufficient to access this weak signal. In the following we will argue that these Bragg peaks arise from a magnetic ordering transition which is enabled by a higher temperature orbital ordering transition. Details of the lowest Q magnetic Bragg reflection are shown in Fig. 1 (b) and (c). We fit the high resolution data using a Lorentzian profile convolved with a Gaussian instrumental resolution of 0.045 Å-1 full width at half maximum (FWHM). This reveals an intrinsic Lorentzian half width at half maximum of Å-1 and corresponding correlation length of Å. Similarly the energy dependence of the Q-integrated peak was fit to a quasielastic Lorentzian profile convolved with the Gaussian instrumental resolution to yield a lower bound on the correlation time of ns. The finite magnetic correlation length might result from exchange disorder built into the system at the higher temperature orbital occupational ordering transition as discussed below.
Specific Heat
The specific heat of our powder sample shown in Fig 2 has qualitative similarities to previous reports, but there are many quantitative differences [14, 15]. No sharp anomaly signifying a phase transition is visible around 12 K and instead there is a very broad maximum in C/T at 8 K. This slightly higher than the 6 K maximum reported in earlier studies [14, 15]. The turnover at 8 K is also considerably shaper in temperature; both of these observations are consistent with a reduced disorder in the samples studied here. Phonon contributions to the specific heat were estimated by appropriately scaling the measured specific heat of the non-magnetic isostructural compound CdIn2S4 as described in Appendix A.3. The phonon contribution, shown as a dashed line in Fig. 2 (a), was subtracted from the total specific heat to yield the magnetic component. From this we calculate the magnetic entropy, shown in Fig. 2 (b). Rather than exceeding the entropy available for a system, the magnetic entropy plateaus at approximately 70 % of the available spin entropy, approaching at 80 K. We find no evidence for orbital fluctuations in the magnetic entropy at low temperatures, only above 80 K does the entropy begin to recover the additional available for a two-fold orbital degeneracy and our analysis indicates that the orbital degeneracy in FeSc2S4 is entirely quenched below 80 K.
Orbital Degeneracy Breaking
An orbitally non-degenerate state at low temperatures is at odds with the previously accepted crystal structure for FeSc2S4 we shall thus first re-examine the low temperature crystal structure. The T=20 K neutron diffraction pattern of FeSc2S4 is shown in Fig. 3 (a). All peaks can be indexed by the cubic space group and no peak splitting characteristic of a symmetry lowering structural distortion is apparent. Nonetheless, Rietveld refinement of our diffraction data using the space group is not satisfactory as it yields a systematic discrepancy between measured and calculated peak intensities. Amongst the maximal subgroups of we find a significantly improved description of the data using the tetragonal space group. Specifically, and as described more fully in Appendix B.1, the goodness of fit is reduced from to in going from to . Fig. 3 (b) shows the new unit cell and the resulting Rietveld refinement is shown in Fig. 3 (a), details of the refinement are presented in Table 1.
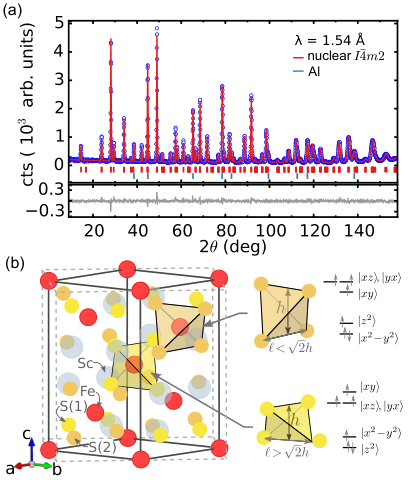
Within our measurement resolution the FeSc2S4 unit cell maintains its cubic metric and the tetragonal distortion is limited to , where the parent cubic cell lattice parameter and is the tetragonal cell lattice parameter. The unit cell contains two crystallographically distinct Fe sites, each site comprising a centered tetragonal (CT) sublattice. Importantly, the Fe-coordinating sulfur tetrahedra for each respective sublattice are alternately compressed or elongated along the (001) direction, as shown in Fig. 3 (b). The tetragonal distortion thus relaxes the tetrahedral symmetry around each iron site, lifting the orbital degeneracy of the Fe orbitals and results in a hole occupying the orbital for one sublattice and the orbitals for the other. From an energetic perspective, this particular distortion minimizes macroscopic strain while fully quenching the orbital moment. High resolution x-ray diffraction measurements show that the average structure is cubic at least to 100 K, but reveal a large anisotropic microstrain broadening of the diffraction peaks possibly indicating an incipient structural transition (See Appendix A.1. Further neutron and x-ray diffraction experiments that span the relevant temperature regime where the phase transition may occur are under way.
While no deviations from cubic symmetry have been reported thus far, the particular low temperature structure we report resolves a number of inconsistencies in the literature. First, Mössbauer spectroscopy consistently indicates two distinct Fe sites [26, 27]. This has been ascribed to result from Fe-Sc site mixing at the level of 30 %[27], but seems an extremely unlikely scenario given the disparate ionic radii and charge of Fe2+ and Sc3+, and is furthermore inconsistent with neutron diffraction, which offers excellent contrast between Fe and Sc. Even at room temperature the Mössbauer spectra necessitate a second Fe site in small fractions and below 50 K the quadrupolar splitting from each respective site diverges. These observations seem consistent with a thermally fluctuating, or dynamic, distortion which dramatically slows down below 50 K. Second, optical measurements in the far infrared show signatures of symmetry breaking [28, 19]. Two bands around 467 cm-1 are observed in the 300 K absorption spectra which are forbidden in the space group and have lacked a satisfactory explanation [28]. The extra absorption bands indicate a local distortion is present, at least dynamically, even at room temperature.
| Atom | Wyck. site | x | y | z | Occ | Biso |
|---|---|---|---|---|---|---|
| Fe(1) | 2a | 0.0000 | 0.0000 | 0.0000 | 1.0 | 0.183(4) |
| Fe(2) | 2c | 0.0000 | 0.5000 | 0.2500 | 1.0 | 0.183(4) |
| S(1) | 8i | 0.2618(3) | 0.0000 | 0.1283(8) | 1.0 | 0.216(4) |
| S(2) | 8i | 0.2434(8) | 0.0000 | 0.6207(8) | 1.0 | 0.216(4) |
| Sc | 8i | 0.7541(3) | 0.0000 | 0.3741(6) | 1.0 | 0.188(4) |
Any signatures of a structural distortion in our diffraction data are subtle as the low temperature structure remains metrically cubic. A small distortion is, however, generally consistent with expectations for tetrahedrally coordinated Fe2+. Indeed, any structural anomaly associated with orbital ordering in the related compound FeCr2S4 was only apparent through careful line shape analysis of high resolution x-ray synchrotron diffraction data [29]. Furthermore, we shall see that for FeSc2S4 the presence of a tetragonal distortion proves essential to consistently describe both the observed magnetic ordering and excitation spectra.
Magnetic Ordering
The magnetic peaks may be indexed in the tetragonal unit cell using a single propagation vector of either or . The resulting magnetic structure and refinement are shown in figures 4 (a) and (b). Refinements for magnetic models using a propagation vector of either or are indistinguishable so that a unique solution cannot be determined from diffraction alone. However, as will be discussed below, the powder averaged inelastic magnetic neutron scattering cross section can only be accounted for based on the propagation vector. Various models for the magnetic ordering in FeSc2S4 are discussed in Appendix B.2. The resulting magnetic structure shown in Fig. 4 (c) and (c) is a collinear antiferromagnet with all moments either lying in the ab plane along (110) type directions or parallel to the c-axis. Because the and type magnetic Bragg peaks are coincident within the resolution of our measurement, the moment direction cannot be uniquely determined from the powder diffraction data. Nevertheless, refinements for each model give an identical ordered moment of at 1.6 K. This is only 44(1)% of the 4 saturation magnetization for the fully localized high spin state of Fe2+ and . The anomalously low ordered moment is typical of A-site spinels [30, 31] and may result from geometric frustration in this insulating material [32]. Indeed, the collinear antiferromagnetic ordering we observe is a highly frustrated ground state in the CT lattice of Fig. 4, only satisfying antiferromagnetic next nearest neighbour (NNN) exchange . Both the nearest neighbour (NN) and NNN inter-planar exchange terms compete with , and cancel at the mean field level; resulting in a spin system that lowers its energy mainly through interactions within the tetragonal basal plane.

We now examine the thermal phase transition to this ordered state. Fig. 5 (c) shows the temperature dependent magnetic moment obtained from Rietveld refinements of full diffraction patterns. There is a smooth increase in the ordered moment upon cooling below a critical temperature of Tc=11.8(2) K, which at ambient pressure can be described as , with and . A similar temperature dependence is observed under 10 kbar hydrostatic pressure, though with a reduced transitions temperature Tc=8.6(8) K. The inset of Fig. 5 shows the magnetic correlation length ( Å) is unaffected by pressure to within error.
This seemingly conventional temperature dependence of the ordered moment belies the true nature of the magnetic phase transition as evidenced by both the absence of critical behaviour in the specific heat Fig. 2, and the low energy inelastic scattering at the critical wave vector of 0.6 Å-1 [Fig. 5 (b)]. Contrary to expectations for a second order phase transition, no critical scattering appears around the ordering wave vector at Tc, instead only a gradual build up of inelastic spectral weight, concentrated around energy transfers of meV was observed. In the frustrated pyrochlore ZnCr2O4, a first order transition abruptly selects an ordered magnetic state out of a highly degenerate manifold of states [33]. An inhomogeneous first order phase transition might relate this scenario to the smooth and latent heat free transition in FeSc2S4.

Magnetic Excitations

We now discuss the magnetic excitation spectrum in FeSc2S4. An overview of the normalized inelastic neutron scattering intensity, , is presented in Fig. 6 (a) and (b) for 0 kbar and 10 kbar hydrostatic pressures respectively. There are intense, dispersive magnetic excitations emerging from Q=0.6 Å-1 with spectral weight extending to 5.5 meV. At low energies and in the neighborhood of the critical wavevector (0.6 Å-1) the intensity continuously decreases with decreasing energy below 1 meV to a level just above background. One may be tempted to implicate a gap in the excitation spectrum based on this decreasing spectral weight[16]. However, for a polycrystalline sample, the inelastic neutron intensity reflects the average intensity on the Ewald sphere, which can decrease rapidly with energy for a dispersive, long range correlated, systems even though the excitations may be gapless. A gap in the excitation spectrum is signaled by the complete absence of spectral weight at low energies around the critical wavevector. In contrast for FeSc2S4 the high resolution data in Fig. 6 (d) shows intensity, albeit weak, down to 0.05 meV so that energy gap in the excitation spectrum must be smaller than this. The excitation spectrum is consistent with previous reports [16] and, we will see, can be accounted for by spin wave excitations from an ordered antiferromagnet in the tetragonal cell.
Although directional information is destroyed by powder averaging, holds valuable information that correlates the scalar lengths and energy scales. We first extract the normalized spin-space trace of the powder averaged dynamical spin correlation function from the neutron intensity , and we have used the dipole approximation for the Fe2+ () form factor. To determine the dominant correlation length scales independent of any model Hamiltonian, we compare the energy integrated inelastic signal to the spherically averaged equal time structure factor,
| (4) |
where is the average spin-spin correlator between sites separated by the distance . Information regarding the dominant magnetic bond energies may be extracted from the powder averaged first moment sum rule for a Heisenberg Hamiltonian [34, 35],
| (5) |
where , is the total magnetic bond energy for a superexchange interaction across all bonds at distance , is the coordination of the bond, and is a constant related to the sum over all single site anisotropy energies: . An unknown factor of is implicit in both eq. 4 and eq. 5 and is contained within the correlators and bond energies quoted here.
The energy integrated inelastic intensity and first moment are shown in Fig. 7 (a) and (b) respectively. Due to the kinematic limit for inelastic neutron scattering, the data only sample the full spectrum for Å-1. While the static structure factor exhibits well defined peaks distinguishing length scales that dominate the magnetic correlations, the first moment is relatively featureless and flat as a function of momentum transfer. A momentum independent first moment implies the ground state energy is dominated either by a local energy scale through or by potentially frustrated interactions covering a wide range of length scales. The two contributions are clearly distinguished in the Q=0 limit where magnetic bond energy terms in equation 5 vanish. Because of the kinematic limits for inelastic neutron scattering, a fit of equation 5 to the neutron scattering data alone is insufficient to constrain . However, at Q=0 the first moment and static structure factor are simply related where is the energy averaged over the fluctuation spectrum at Q=0. Time domain Terahertz spectroscopy has revealed a single well defined mode at meV which dominates the dynamic susceptibility at [20]; using this result we may apply a single mode approximation to obtain a lower bound on the anisotropy energy . Fits to the static structure factor and first moment are shown in Fig. 7 and the extracted correlators and bond energies are listed in Table 2.
From the static structure factor fit we find , and . Given their similar ranges, magnetic interactions labelled and in Fig. 4 (b) and (c) cannot be distinguished and so are represented by their average. Any differences in the magnetic correlators and bond energies between the 0 kbar and 10 kbar data are not discernible from the effects of increased background scattering resulting from the stainless steel pressure vessel. We conclude that hydrostatic pressures of 10 kbar has little effect on the overall magnetic energy scales, though Tc is reduced slightly and there is some suppression of low energy scattering [Fig. 6 (a) and (b)].
| d (Å) | (meV) | (meV) | ||
|---|---|---|---|---|
| 4.55 | 1(1) | 3.7(7) | -0.14(8) | |
| 7.43 | -7(2) | -4.1(7) | 0.7(1) | |
| 7.43 | – | – | 0.6(6) | |
| 8.70 | -2(1) | -2.3(3) | 0.02(2) | |
| 8.72 | – | – | 0.02(2) | |
| 10.51 | 3(1) | -3.1(3) | -0.09(7) | |
| 10.49 | – | – | -0.09(7) |
The sign and magnitude of spin correlators we extracted are entirely consistent with the collinear magnetic order shown in Fig. 4 (a) and support a model where dominant antiferromagnetic correlations exist across the NNN bonds () of the Fe lattice. This analysis suggests that, at least in terms of the magnetic correlations, the system may be considered as essentially two interpenetrating CT sub-lattices, where couples spins on the same sublattice and fails to produce significant correlations. Interestingly, emerges as the dominant energy scale. This is indicative of a magnetic state which breaks the cubic symmetry as all single ion anisotropy terms must vanish in the cubic cell. However, is anticipated for an orbitally ordered state in the presence of spin orbit interactions. Furthermore, such a relatively large single-ion anisotropy scale reveals an instability of the magnetically ordered state towards a local singlet.
Fig. 7 (c) shows the momentum averaged inelastic intensity which approximates the magnetic density of states. The effect of 10 kbar hydrostatic pressure is a slight transfer of spectral weight from around 1 meV to energies between 5 and 6 meV.
Integrating the total measured dynamical spin correlation function over the region meV and Å-1, we obtain the total inelastic spectral weight , recovering a fluctuating moment of at 0 kbar and at 10 kbar. Summing the static (elastic) and dynamic (inelastic) contributions yields a total moment of , significantly less than expected for S=2 and g=2. There are a number of not mutually exclusive explanations for this discrepancy: (i) Significant inelastic spectral weight exists beyond the 6 meV range of the experiment. (ii) There is a component of elastic diffuse magnetic scattering that arises from static disorder. The second scenario is difficult to test with our un-polarized measurement as elastic diffuse scattering is dominated by incoherent nuclear scattering from Sc ( barn) and any elastic diffuse magnetic scattering will be broad in momentum and extremely weak. However, we do not observe any temperature or momentum dependent background which may arise from magnetic diffuse scattering below 20 K and the first scenario thus seems more likely based on our data. This conclusion is supported by our specific heat measurement which only recover 70 % of the available magnetic entropy by 70 K (6 meV), consistent with higher energy magnetic spectral weight. Surprisingly, for such a large spin (S=2) antiferromagnet, the dynamic portion dominates the spectral weight, contributing over four times that of the static portion. For a fully spin polarized ground state, the magnetic inelastic scattering consists entirely of spin excitations which are transverse to the ordered moment direction (spin waves) and have an available spectral weight of , when =2. Quantum fluctuations, which reduce the ordered moment, allow for spin excitations which are longitudinal fluctuations and an associated increase of inelastic spectral weight. It then follows that the large fluctuating moment we observe implies the Néel state in FeSc2S4 is strongly renormalized by quantum fluctuations which may result of disorder and/or an incipient quantum phase transition.
Having identified pertinent magnetic interaction pathways in FeSc2S4 we may now compare the measured excitation spectrum with a minimal effective spin Heisenberg model. While one may contest the validity of a spin wave expansion for such a strongly renormalized state as in FeSc2S4 with , the semi-classical description might provide a reasonable account of long-wave-length dispersive transverse components of the magnetic excitation spectrum. Figures 6 (d) and (e) juxtapose the low-energy inelastic neutron scattering signal with the elastic signal in the neighborhood of the first two magnetic Bragg peaks, indexed in the cubic unit cell as (100)c and (110)c respectively. Comparison of the elastic and inelastic intensities in this region immediately reveals an important clue that proves essential to determine the magnetic order in FeSc2S4. While there is strong elastic scattering both around (100)c and (110)c, inelastic scattering is found only around (100)c (0.6 Å-1). Since (100)c and (110)c are equivalent by symmetry, the energy eigenvalues of magnetic excitations must be identical at these wave vectors. The absence of powder averaged inelastic scattering near (110)c must then reflect different matrix elements for Å-1 and 0.84 Å-1. In the low energy long-wave-length limit the inelastic magnetic intensity scales with the elastic scattering except for the polarization factor, which extinguishes scattering associated with spin components along wave vector transfer, . For magnetic structures that are consistent with the observed diffraction pattern in the cubic cell, the polarization factor can only at most extinguish half of the spectral weight at (110) compared to (100). The suppression observed experimentally is however, more than a factor of 4 so that indexing of the magnetic structure with a cubic unit cell must be rejected. It is this feature of the inelastic scattering which implicates the magnetic ordering proposed in figure 4 where the two peaks correspond to distinct points in the Brillouin zone, and , that can have different excitation spectra. We shall now show that spin waves in a structure can account for these unusual low energy features of FeSc2S4 and indeed for the qualitative features of the full inelastic magnetic neutron scattering cross section.
Within the tetragonal structure there are at least seven magnetic exchange pathways identified in Fig. 4 (b) and (c) that must be considered in a simple spin wave model. Additionally, the two Fe2+ sites in the unit cell have distinct tetragonal environments, permitting two distinct single ion anisotropy terms in the magnetic Hamiltonian. Dzyaloshinksii exchange terms are also symmetry allowed on each of the magnetic exchange paths in the tetragonal cell. The powder averaged inelastic magnetic neutron scattering cross section was computed from a minimal Hamiltonian and linear spin wave theory (LSWT) as implemented in the SpinW program [36]. For simplicity we include only Heisenberg terms which are labelled in Fig. 4 (b) and (c) plus distinct single-ion easy plane anisotropy terms on each Fe2+ site. Guided by the static structure factor and first moment sum rule analysis, we adjusted the exchange constants to obtain the best qualitative agreement between the measured and calculated spectra. The results of this calculation are shown in Fig. 6 (c) for the exchange interactions detailed in table 2 and single ion easy plane anisotropy energies meV and meV. To aid meaningful comparison of the LSWT derived exchange constants and magnetic bond energies in the strongly fluctuating Néel state of FeSc2S4, LSWT exchange constants in table 2 have been renormalized by the reduced ordered moment . The relative magnitudes of exchange interactions from the LSWT are in reasonable agreement with those extracted from the sum-rule analysis and it is encouraging that the magnitude of these exchange parameters are generally consistent with band structure calculations for FeSc2S4 [37].
Although the powder averaged neutron scattering data does not contain sufficient information to adequately constrain the seven exchange and two anisotropy parameters. The purpose of the spin wave calculation presented here is not to determine the ground state Hamiltonian, but to show that the character particularly of low energy spin excitations in FeSc2S4 can largely be explained in terms of a spin wave model. The spin wave model captures the general intensity distribution including the concentration of high energy spectral weight around Q 1 Å-1 and the inelastic intensity differences around the and magnetic reflections. In fact, the excitation spectrum is only consistent with a magnetic propagation vector of in the tetragonal cell and the particular magnetic ordering pattern shown in Fig. 4 (b). A comparison of the calculated linear spin wave neutron intensity for different models of magnetic ordering in FeSc2S4 are presented in Appendix B.3. The weak scattering intensity around is a direct result of the highly frustrated nature of the magnetic ordering in the tetragonal cell. For the collinear ordering, the dominant exchange interactions which have a component along the c-axis ( and ) are frustrated and cancel at the mean field level. This effectively results in dimensional reduction through frustration. One consequence of this frustration is softening of magnetic excitations around , which manifests as weak diffuse scattering intensity near 0.85 Å-1 in the powder averaged spectrum.
Comparison with the spin wave expansion yields a further important insight. The inclusion of easy plane anisotropy terms are essential to stabilize the magnetic structure for agreement between model and data. These terms only gap transverse excitations which are spin fluctuations out of the a-b plane. At the level of linear spin wave theory, there is always a gapless transverse fluctuation within the a-b plane. Thus, inasmuch as the spin wave expansion accurately accounts for magnetic excitations in FeSc2S4, the data are consistent with a gapless excitation spectrum.
While the spin wave model appears to capture most features of the excitation spectrum we do not claim it to be unique. Furthermore, it is not clear that a spin wave expansion should be relevant for the highly renormalized Néel state of FeSc2S4. Discrepancies of the spin wave model are particularly apparent at higher energies, above 2 meV, where longitudinal and multimagnon excitations that are not accounted for in the expansion may be expected to play an important role. The spectral weight available for two-magnon (longitudinal) scattering is directly related to the reduction in sublattice magnetization , and . Assuming the moment reduction is entirely a consequence of quantum fluctuations, the total fraction of spectral weight observed which results from non-spin wave excitations is .
Discussion
We have reported long range magnetic ordering in FeSc2S4 which appears at a temperature concomitant with a broad turnover in the specific heat. We have presented evidence that this order arises from a centered tetragonal space group where the single ion site associated with cubic symmetry is split into two orbitally non-degenerate sites. Static and dynamic magnetic correlations find a consistent explanation within a tetragonal unit cell and with a magnetic propagation vector . Although the unit cell remains metrically cubic, the alternating compression and expansion of the coordinating sulfur tetrahedra lifts the orbital degeneracy of the ideal tetrahedral coordination. In concordance with these results we find the magnetic ground state energy contains significant contributions from anisotropic terms in the Hamiltonian that are incompatible with an orbitally degenerate cubic structure. Together, these observations show the ground state of FeSc2S4 is not a spin orbital liquid as previously hypothesized.
The upper bound we may place on a tetragonal distortion in FeSc2S4 is extremely small, 0.2%, and spin orbit coupling may still enter as an energy scale competitive with the small non-cubic crystal field. In this case, we may naively apply the theory developed for the spin-orbital liquid phase to estimate the proximity of FeSc2S4 to the quantum critical point separating the spin-orbital liquid phase from a long range ordered phase. In the mean field phase diagram proposed by Chen et al. [17] the critical point occurs at . Using the experimentally determined value for the SOC coupling constant meV [20] and the unrenormalized magnetic exchange used in the spin wave model we find which falls well within the magnetic and orbitally ordered regime. We note that the Terahertz measurements also extract a value of , but based on the reported absence of magnetic order in previous neutron measurements conclude that quantum fluctuations renormalize [20]. The drastically reduced ordered moment of FeSc2S4 and enhanced fluctuations we observe are a direct sign of the melting of the staggered magnetization in proximity to a critical point. Furthermore, the dominant single ion anisotropy energy scale we extract indicates that this instability is driving towards a local singlet state, this is precisely the nature of the spin-orbital singlet state. Given the proximity, it may be possible to drive FeSc2S4 through the quantum phase transition and stabilize the spin orbital liquid ground state by application of a suitable perturbation [18, 21]. We have found a reduced staggered magnetization and shift of spectral weight towards higher energies under a hydrostatic pressure of 10 kbar. Perhaps it is possible to reach the critical point through application of even higher pressure. When single crystals become available uniaxial stress is another interesting parameter that may act to drive FeSc2S4 either deeper into the ordered state (as indicated by ) or towards the critical point.
The nature of the thermal magnetic phase transition leading to this strongly fluctuating Néel state is rather peculiar. Specifically, how can the apparent critical behaviour of the magnetic order parameter be reconciled with the broad turnover in specific heat and lack of magnetic critical scattering? There are a number of possibilities. One simple explanation is that the sample is inhomogeneous and only a small fraction it orders, perhaps as a result of random impurities. The diamond lattice antiferromagnet is particularly sensitive to this through the order by quenched disorder mechanism [38]. A partial magnetic order induced by quenched disorder would be consistent with the small ordered moment we observe since the neutron signal is sensitive only to the product of the ordered moment and volume fraction of the ordered phase.
This is contradicted by the fact that the inelastic magnetic scattering can be described by spin waves in an ordered, renormalized, antiferromagnet. Our samples also appear cleaner than those typically reported in literature where magnetic ordering has not been reported. Structural refinements at 100 K definitively exclude any non-stoichiometries beyond a 1% limit of detection, and also tightly constrain any Fe:Sc mixing to less than 3% (See Appendix A.1). Comparison of thermodynamic measurements on our samples and those of previous reports further support this conclusion. The low temperature maximum our measured specific heat both occurs at a higher temperature and is sharper in temperature than previously reported [14]. Bulk magnetic susceptibility of our powder samples, discussed in Section A.2, show a turnover at 10 K closely resembling the local susceptibility obtained from NMR Knight shift measurements [15, 39]. This is a clear indication the absence of magnetic impurities or orphan spins in our samples. These typically lead to a low temperature Curie tail that was observed in previous reports though not in our sample [14, 15]. Moreover, we have observed the magnetic Bragg reflections in three different samples each having undergone a different thermal processing schedule. While the maximum temperature during synthesis differed by as much as 400 ∘C between samples, the relative intensity of the (Q=0.6 Å-1) magnetic reflection and (1,1,1) (Q=1.03 Å-1) structural Bragg peak vary by no more than a factor of .
The behaviour observed in FeSc2S4 is similar to another A-site magnetic spinel CoAl2O4 [30], where neutron scattering measurements on single crystals show signatures of antiferromagnetic domains that have been argued to result from an arrested first order, order-by-disorder magnetic transition [13]. The 50 Å correlation length we observe in FeSc2S4 is consistent with the presence of large antiferromagnetic domains. Furthermore, Monte Carlo simulations of the order-by-disorder transition in the face centered cubic lattice show that thermally excited defects and domain walls drastically reduce the sublattice magnetization of the ordered state [40]. The collinear ordering we observe in FeSc2S4 is only very weakly favored over other possible magnetic structures. A classical order-by-disorder mechanism should, however, generally favor a collinear magnetic ordering [41]. Indeed, both random strains as well as spin-orbit coupling have been invoked to explain the quadrupolar splitting observed by Mössbauer experiments on FeSc2S4 [26]. The structural distortion we observe may hint at another mechanism: in the tetragonal cell there is an alternating compression and elongation of the Fe coordinating S tetrahedron, but the diffraction measurement does not uniquely identify which iron site has the compressed and which elongated tetrahedral environment. If the tetrahedral distortion is not coherent between many unit cells the result will be a static orbital disorder and as a consequence exchange disorder. Since the structural unit cell remains constant, the thermal energy barrier to creating such a magnetic exchange defect will be very low.
In this order-by-disorder scenario, an abrupt first order transition becomes rounded by the presence of disorder [42, 43]. Rather than a single sharp transition, the exchange disorder results in a distribution of first order transition temperatures whereby larger and larger volumes of the sample consecutively undergo abrupt first order transitions upon cooling. The outcome appears as a gradual onset of order when in fact all volume elements of the sample actually undergo an abrupt first order transition [44].
Even though our experiment now reveals it to lie on the opposite side of the critical point as was previously anticipated, FeSc2S4 appears as a unique material where many energy scales including crystal field splitting, spin-orbit coupling, and frustrated magnetic exchange interactions compete and conspire to produce very rich physics. This includes a thermal order-by-disorder transition into a highly renormalized Néel ground state on the border of a quantum phase transition.
Acknowledgements.
We would like to thank N. P. Armitage and N.J. Laurita for helpful discussions and comments on this manuscript. We also acknowledge Juscelino Leao for assistance with the high pressure sample environment and Nicholas Butch for providing transmission measurements of the stainless steel pressure vessel. Work at IQM was supported by the U.S. Department of Energy, Office of Basic Energy Sciences, Division of Material Sciences and Engineering under grant DE-FG02-08ER46544. Work at ORNL was sponsored by the Division of Scientific User Facilities, Office of Basic Energy Science, US department of Energy (DOE). Work at NIST utilized facilities supported in part by the National Science Foundation under Agreement No. DMR-1508249.Appendix A Sample Characterization
A.1 Synchrotron Powder Diffraction

The K synchrotron powder diffraction data pattern collected on 11-BM and refinement is shown in figure 8. All diffraction peaks are well indexed using the cubic unit cell and we find a good refinement to the 100 K diffraction data using the reported structure for FeSc2S4. However, significant microstrain broadening of the diffraction peaks was necessary to accurately describe the peak shapes. An isotropic strain broadening in the cubic cell was accounted for in GSAS utilizing the semi-empirical Stephens peak shape [45] with cubic strains of S400= 0.19%, S200 = 0.01%. The large difference between the two symmetry allowed strain parameters is consistent with an incipient structural transition. Our x-ray powder diffraction data additionally show the presence of a minor (0.15 %) contamination phase of Sc2O3 in our sample, below the limit of detection for our neutron diffraction measurements.
The magnetic properties of A-site spinel compounds are highly sensitive to the degree of chemical disorder resulting from inversion between atomic species occupying the and sites of the spinel structure [46, 30]. To quantify any inversion present in our sample we have refined out synchrotron data allowing for anti-site disorder as described by (Fe1-xScx)[Sc2-xFex]S4. The inset of figure 8 shows the goodness-of-fit parameter versus the site inversion which indicates a small amount of site-inversion present in our sample. The value of in the inset of figure 8 is larger than reported for the full Rietveld refinement because only a single phase was included in Rietveld refinements used to estimate the site inversion. We have checked that the inclusion of the contamination phase does not effect the conclusion of the site mixing analysis. Rietveld refinement parameters are listed in Table 3.
| Atom | Site | x | y | z | Occ | Biso |
|---|---|---|---|---|---|---|
| Fe | 8a | 0.125 | 0.125 | 0.125 | 0.94 | 0.313(2) |
| Sc | 8a | 0.125 | 0.125 | 0.125 | 0.06 | 0.311(2) |
| Fe | 16d | 0.500 | 0.500 | 0.500 | 0.03 | 0.313(2) |
| Sc | 16d | 0.500 | 0.500 | 0.500 | 0.97 | 0.311(2) |
| S | 32e | 0.2556(1) | 0.2556(1) | 0.2556(1) | 1.00 | 0.352(2) |
A.2 Bulk Magnetization
Temperature dependent bulk magnetization of FeSc2S4 was measured using a Quantum Designs PPMS in an applied field of 0. T and is shown in figure 9. The high temperature susceptibility displays Curie-Weiss behavior with a paramagnetic moment of 5.1(1) and Curie-Weiss temperature K, consistent with earlier reports [14]. The effective moment for and is .
At lower temperatures our data deviate from previous reports. The data show a broad turnover at 10 K, where reports in the literature typically have a 5% or more Curie tail [14]. This turnover is identical to the reported local susceptibility from Sc NMR Knight shift measurements [15, 39]. The NMR Knight shift probes the intrinsic local spin susceptibility, independent of any Curie tail contribution from small amounts of impurities which may dominate the bulk susceptibility at low temperatures. Agreement between the measured bulk susceptibility of our samples and NMR Knight shift measurements is a strong indication of the absence of magnetic impurities which are present in previously reported samples of FeSc2S4.
A.3 Phonon contribution to Specific Heat
Phonon contributions to the specific heat of FeSc2S4 were estimated by scaling the measured specific heat of the non-magnetic analog spinel compound CdIn2S4. The measured specific heat for CdIn2S4 was extracted from [14], in order to describe the phonon contribution to FeSc2S4, this must be scaled by the relative Debye temperatures, , of the two compounds,
| (A1) |
where is the atomic mass of element . The rescaled temperature for the phonon specific heat is then given by
| (A2) |
and the rescaled lattice contribution by
| (A3) |
The scaled phonon contribution to the specific heat of FeSc2S4 is shown as a red dashed line in figure 2 of the main text.
Appendix B Structural and Magnetic Models
B.1 Low Temperature Structural Refinements
Neutron powder diffraction measurements collected on BT-1 at 20 K are shown in figure 10; the four panels display identical diffraction data sets but with Rietveld refinements corresponding to different structural models for FSS. Details of each refinement are listed in Table 4. Note that Fe:Sc site mixing has not been included in these refinements, but we have checked that the conclusions here are not affected by this.
| Symmtery | cubic | tetragonal | tetragonal | orthorhombic |
|---|---|---|---|---|
| Space group | ||||
| a (Å) | 10.507(1) | 7.437(1) | 7.434(1) | 10.514(1) |
| b (Å) | / | / | / | 10.514(1) |
| c (Å) | / | 10.495(1) | 10.493(1) | 10.491(1) |
| c/ac | 1 | 0.998 | 0.998 | 0.998 |
| 1.87 | 1.46 | 1.33 | 1.35 | |
| R | 7.92 | 6.99 | 6.68 | 6.71 |
| R | 6.73 | 5.57 | 5.25 | 5.13 |
The tetragonal lattice parameter is simply related to the cubic cell by . Refinements for each structural model show that the lattice remains metrically cubic with only extremely small tetragonal distortions, of at most . While there are no obvious qualitative differences between the refinements for each structural model, close quantitative comparison reveals a significant improvement in the quality of fit for the tetragonal unit cell, and space group .

B.2 Candidate Magnetic Structures
Irreducible representations and their basis vectors for each crystal symmetry and magnetic ordering wavevector in FSS were calculated using the SARAharah program [25]. Here we outline each of the candidate magnetic structures consistent with the neutron diffraction data in the parent cubic unit cell and proposed tetragonal cell.


In the cubic spinel structure all magnetic peaks are indexed with a propagation vector of . The decomposition of the magnetic representation for the Fe site is , the irreducible representations and associated basis vectors are detailed in Table 5. Satisfactory magnetic refinements in the structural space group are only possible including one equally weighted basis vector from each of the two irreducible representations and : either and or and . The two structures are simply related by a rotation of all spins and are indistinguishable in powder diffraction data. The resulting magnetic structure and refinements are shown in Fig. 11 (a).
| Irrep. | Basis Vector | Atom | |||
|---|---|---|---|---|---|
| 1 | 0 | 4 | 0 | ||
| 2 | -4 | 0 | 0 | ||
| 1 | 4 | 0 | 0 | ||
| 2 | 0 | -4 | 0 | ||
| 1 | 4 | 0 | 0 | ||
| 2 | 0 | 4 | 0 | ||
| 1 | 0 | -4 | 0 | ||
| 2 | -4 | 0 | 0 | ||
| 1 | 0 | 0 | 8 | ||
| 2 | 0 | 0 | 0 | ||
| 1 | 0 | 0 | 0 | ||
| 2 | 0 | 0 | -8 |
For the tetragonal cell the magnetic Bragg peaks may all be indexed with a magnetic propagation vector of either . or . There are two Fe sites in the primitive basis, for the Fe1 at the decomposition of the magnetic representation is for and for . On the Fe2 site at , the decomposition of the magnetic representation is for and for . Irreducible representations and associated basis vectors for the propagation vectors and are detailed in tables 6, 7 and 8, 9 respectively.
The refined magnetic structure for a propagation vector is shown in figure 11 (c) and is identical to that in figure 11 (a) when transformed into the cubic cell. This structure is described with the irreducible representation on both Fe sites and equally weighted basis vectors.
| Irrep. | Basis Vector | Atom | |||
|---|---|---|---|---|---|
| 1 | 0 | 0 | 8 | ||
| 1 | 0 | 4 | 0 | ||
| 1 | 4 | 0 | 0 |
| Irrep. | Basis Vector | Atom | |||
|---|---|---|---|---|---|
| 1 | 0 | 0 | 8 | ||
| 1 | 0 | 4 | 0 | ||
| 1 | -4 | 0 | 0 |
When the magnetic peaks are indexed with many equally good solutions are permitted by the data. In figure 11 (e) and (d) we show the magnetic structure and refinement for on Fe1 and on Fe2.
The collinear magnetic structure shown in figure 4 (b) and (d) of the main text includes irreducible representations on Fe1 and on Fe2.
| Irrep. | Basis Vector | Atom | |||
|---|---|---|---|---|---|
| 1 | 2 | -2 | 0 | ||
| 1 | 2 | 2 | 0 | ||
| 1 | 0 | 0 | 4 |
| Irrep. | Basis Vector | Atom | |||
|---|---|---|---|---|---|
| 1 | 2 | 2 | 0 | ||
| 1 | 0 | 0 | 4 | ||
| 1 | 2 | -2 | 0 |
B.3 Magnetic Excitations and Spin Wave Models
The powder averaged magnetic excitation spectra was computed for each magnetic candidate structure in FeSc2S4 within linear spin wave theory as implemented in the SpinW program [36]. For each model, the inelastic magnetic neutron scattering intensity from spin waves was calculated using a simple model Hamiltonian, including only Heisenberg type exchange terms labelled in Fig. 4 (b) of the main text as well as single ion anisotropy terms on each Fe2+. For the cubic structure a symmetry disallowed easy plane anisotropy term was included to stabilize the magnetic structure; while the tetragonal structures allow for two distinct single ion anisotropy terms: one per crystallographic Fe site. These were included as easy plan anisotropies for models 2 and 4, and an easy axis anisotropy for model 3. Models 1 through 3 are shown in figure 11 and model 4 is that presented in the main text.
| Model 1 | Model 2 | Model 3 | |
|---|---|---|---|
| (meV) | 0.10(9) | 0.10(9) | -0.04(4) |
| (meV) | 0.27(5) | 0.27(5) | 0.32(6) |
| (meV) | – | 0.27(5) | 0.27(6) |
| (meV) | 0.00(1) | 0.00(2) | 0.01(1) |
| (meV) | – | 0.00(2) | 0.01(1) |
| (meV) | 0.00(1) | -0.01(2) | -0.04(3) |
| (meV) | – | -0.01(2) | -0.04(3) |
| (meV) | 0.1(1) | 0.15(6) | 0.15(6) |
| (meV) | – | 0.05(4) | 0.05(4) |
Guided by the relative strength of spin correlators and magnetic bond energies extracted from the static structure factor and first moment sum rule analysis, the magnetic exchange interactions where chosen to provide the best qualitative match of the data with the simplest combination of exchange terms. Exchange constants used for each respective spin wave calculation are detailed in Table 10.
The ground state energy of each magnetic structure are as follows:
Ground state energies of models 3 and 4 are identical. For these models Heisenberg NN () and out-of-plane NNN () exchange terms cancel at the mean field level and the systems is effectively a two-dimensional Heisenberg square lattice. For Models 1 and 2 the nearest neighbor spins are orthogonal and Heisenberg terms have no effect.
References
- [1] P. A. Lee, Science 321, 1306 (2008).
- [2] L. Balents, Nature 464, 199 (2010).
- [3] L. F. Feiner, A. M. Oleś, and J. Zaanen, Phys. Rev. Lett. 78, 2799 (1997).
- [4] Y. Kitaoka, T. Kobayashi, A. Kōda, H. Wakabayashi, Y. Niino, H. Yamakage, S. Taguchi, K. Amaya, K. Yamaura, M. Takano, A. Hirano, and R. Kanno, Journal of the Physical Society of Japan 67, 3703 (1998).
- [5] B. Keimer, D. Casa, A. Ivanov, J. W. Lynn, M. v. Zimmermann, J. P. Hill, D. Gibbs, Y. Taguchi, and Y. Tokura, Phys. Rev. Lett. 85, 3946 (2000).
- [6] G. Khaliullin and S. Maekawa, Phys. Rev. Lett. 85, 3950 (2000).
- [7] S. Nakatsuji, K. Kuga, K. Kimura, R. Satake, N. Katayama, E. Nishibori, H. Sawa, R. Ishii, M. Hagiwara, F. Bridges, T. U. Ito, W. Higemoto, Y. Karaki, M. Halim, A. A. Nugroho, J. A. Rodriguez-Rivera, M. A. Green, and C. Broholm, Science 336, 559 (2012).
- [8] P. Corboz, M. Lajkó, A. M. Läuchli, K. Penc, and F. Mila, Phys. Rev. X 2, 041013 (2012).
- [9] A. Krimmel, M. Mücksch, V. Tsurkan, M. M. Koza, H. Mutka, C. Ritter, D. V. Sheptyakov, S. Horn, and A. Loidl, Phys. Rev. B 73, 014413 (2006).
- [10] D. Bergman, J. Alicea, E. Gull, S. Trebst, and L. Balents, Nat. Phys. 3, 487 (2007).
- [11] J.-S. Bernier, M. J. Lawler, and Y. B. Kim, Phys. Rev. Lett. 101, 047201 (2008).
- [12] A. Krimmel, H. Mutka, M. M. Koza, V. Tsurkan, and A. Loidl, Phys. Rev. B 79, 134406 (2009).
- [13] G. J. MacDougall, D. Gout, J. L. Zarestky, G. Ehlers, A. Podlesnyak, M. A. McGuire, D. Mandrus, and S. E. Nagler, Proc. Natl. Acad. of Sci. 108, 15693 (2011).
- [14] V. Fritsch, J. Hemberger, N. Büttgen, E.-W. Scheidt, H.-A. Krug von Nidda, A. Loidl, and V. Tsurkan, Phys. Rev. Lett. 92, 116401 (2004).
- [15] N. Büttgen, J. Hemberger, V. Fritsch, A. Krimmel, M. Mücksch, H.-A. K. von Nidda, P. Lunkenheimer, R. Fichtl, V. Tsurkan, and A. Loidl, New J. Phys. 6, 191 (2004).
- [16] A. Krimmel, M. Mücksch, V. Tsurkan, M. M. Koza, H. Mutka, and A. Loidl, Phys. Rev. Lett. 94, 237402 (2005).
- [17] G. Chen, L. Balents, and A. P. Schnyder, Phys. Rev. Lett. 102, 096406 (2009a).
- [18] G. Chen, A. P. Schnyder, and L. Balents, Phys. Rev. B 80, 224409 (2009b).
- [19] L. Mittelstädt, M. Schmidt, Z. Wang, F. Mayr, V. Tsurkan, P. Lunkenheimer, D. Ish, L. Balents, J. Deisenhofer, and A. Loidl, Phys. Rev. B 91, 125112 (2015).
- [20] N. J. Laurita, J. Deisenhofer, L. D. Pan, C. M. Morris, M. Schmidt, M. Johnsson, V. Tsurkan, A. Loidl, and N. P. Armitage, Phys. Rev. Lett. 114, 207201 (2015).
- [21] D. Ish and L. Balents, Phys. Rev. B 92, 094413 (2015).
- [22] C. Stock, W. J. L. Buyers, R. Liang, D. Peets, Z. Tun, D. Bonn, W. N. Hardy, and R. J. Birgeneau, Phys. Rev. B 69, 014502 (2004).
- [23] G. Ehlers, A. A. Podlesnyak, J. L. Niedziela, E. B. Iverson, and P. E. Sokol, Review of Scientific Instruments 82, 085108 (2011).
- [24] S.-H. Lee, C. Broholm, M. F. Collins, L. Heller, A. P. Ramirez, C. Kloc, E. Bucher, R. W. Erwin, and N. Lacevic, Phys. Rev. B 56, 8091 (1997).
- [25] A. Wills, Physica B: Condensed Matter 276–278, 680 (2000), program available from www.ccp14.ac.uk.
- [26] L. Brossard, H. Oudet, and P. Gibart, J. Phys. (Paris), Colloc. 6, C493 (1976).
- [27] B. S. Son, S. J. Kim, Y. Jo, M.-H. Jung, B. W. Lee, and C. S. Kim, J. Magn. and Magn, Mater. 320, e699 (2008).
- [28] S. Reil, H.-J. Stork, and H. Haeuseler, J. Alloys and Compd. 334, 92 (2002).
- [29] V. Tsurkan, O. Zaharko, F. Schrettle, C. Kant, J. Deisenhofer, H.-A. Krug von Nidda, V. Felea, P. Lemmens, J. R. Groza, D. V. Quach, F. Gozzo, and A. Loidl, Phys. Rev. B 81, 184426 (2010).
- [30] B. Roy, A. Pandey, Q. Zhang, T. W. Heitmann, D. Vaknin, D. C. Johnston, and Y. Furukawa, Phys. Rev. B 88, 174415 (2013).
- [31] H. S. Nair, Z. Fu, J. Voigt, Y. Su, and T. Brückel, Phys. Rev. B 89, 174431 (2014).
- [32] S. Lee and L. Balents, Phys. Rev. B 78, 144417 (2008).
- [33] S.-H. Lee, C. Broholm, T. H. Kim, W. Ratcliff, and S.-W. Cheong, Phys. Rev. Lett. 84, 3718 (2000).
- [34] P. C. Hohenberg and W. F. Brinkman, Phys. Rev. B 10, 128 (1974).
- [35] M. B. Stone, I. Zaliznyak, D. H. Reich, and C. Broholm, Phys. Rev. B 64, 144405 (2001).
- [36] S. Toth and B. Lake, J. Phys. Cond. Mat. 27, 166002 (2015).
- [37] S. Sarkar, T. Maitra, R. Valentí, and T. Saha-Dasgupta, Phys. Rev. B 82, 041105 (2010).
- [38] L. Savary, E. Gull, S. Trebst, J. Alicea, D. Bergman, and L. Balents, Phys. Rev. B 84, 064438 (2011).
- [39] N. Büttgen, A. Zymara, C. Kegler, V. Tsurkan, and A. Loidl, Phys. Rev. B 73, 132409 (2006).
- [40] M. V. Gvozdikova and M. E. Zhitomirsky, JETP Lett. 81, 236 (2005).
- [41] C. L. Henley, Phys. Rev. Lett. 62, 2056 (1989).
- [42] Y. Imry and M. Wortis, Phys. Rev. B 19, 3580 (1979).
- [43] P. Goswami, D. Schwab, and S. Chakravarty, Phys. Rev. Lett. 100, 015703 (2008).
- [44] K. Hui and A. N. Berker, Phys. Rev. Lett. 62, 2507 (1989).
- [45] P. W. Stephens, Journal of Applied Crystallography 32, 281 (1999).
- [46] K. Hanashima, Y. Kodama, D. Akahoshi, C. Kanadani, and T. Saito, Journal of the Physical Society of Japan 82, 024702 (2013).