

Determining the 6Li Doped Side of a Glass Scintillator for Ultra Cold Neutrons
Abstract
Ultracold neutron (UCN) detectors using two visually very similar, to the microscopic level, pieces of optically contacted cerium doped lithium glasses have been proposed for high rate UCN experiments. The chief difference between the two glass scintillators is that one side is 6Li depleted and the other side 6Li doped. This note outlines a method to determine which side of the glass stack is doped with 6Li using AmBe and 252Cf neutron sources, and a Si surface barrier detector. The method sees an excess of events around the and triton energies of neutron capture on 6Li when the enriched side is facing the Si surface barrier detector.
Keywords:
Lithium glass , thermal neutrons , Si detector1 Introduction
Several neutron Electric Dipole Moment experiments using UltraCold Neutrons (UCN) are being planned worldwide [1, 2, 3, 4, 5, 6, 7, 8, 9, 10]. All planned experiments anticipate large increases in the rate of UCN detected (>MHz). New technologies are being pursued in order to handle the projected increase in rate, while keeping the efficiency high and the sensitivity to backgrounds arising from gamma rays and thermal neutrons low.
The benchmark technology in this case is the 3He multi-wire proportional counter (MWPC) [11]. By arranging the density of the 3He to be small, UCN may enter deep into the detector volume prior to capturing on the 3He. In this way, the reaction products (deuteron and triton) deposit their energy fully in the surrounding gas volume, which contains a larger partial pressure of gasses suitable for creating the avalanche condition necessary for MWPC operation. In this way, such detectors have near 100% efficiency, and are relatively insensitive to backgrounds (owing to the thinness of the gas layer). Such detectors are often limited in their rate capability, however. While this can be overcome by segmentation, other groups have proposed using detection of scintillation light, which has an inherently faster recovery time than gas counters.
One technology being pursued involves the use of 6Li-doped and 6Li-depleted scintillating glass [12, 13]. Such glass is available from Applied Scintillation Technologies in the UK [15, 16] as GS30 (6Li-depleted) and GS20 (6Li-enriched). The properties of the glasses are summarized in Table 1. The function of a detector based on this principle is displayed in FIG. 1. UCN pass through a 6Li-depleted glass layer and then capture on a 6Li-enriched layer. The neutron capture interaction length in the enriched layer is m. Thermal neutrons have a longer interaction length in the glass, and capture uniformly in the volume of the GS20. When neutrons capture on 6Li nuclei, they produce an and a triton via the reaction:
| (1) |
The mean range of the is 5.3 m, and the mean range of the triton is 34.7 m. Thinning the glass to thicker than this allows the full energy of the neutron capture to be deposited in the glass. The glass is kept as thin as possible to reduce backgrounds to the UCN counting. Keeping the glass thin reduces its efficiency for seeing thermal neutrons, and minimizing the light output from gamma rays.
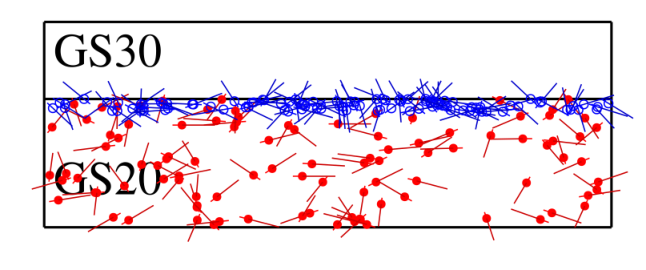
A key enabling technology is the optical contacting of the two glass layers, which prevents any losses of the reaction products in glue. Such detectors have demonstrated efficiency rivalling 3He counters [13]. The decay time of the atomic states in the scintillating glass is such that most scintillation light is gone after 50 to 70 ns. To partially address backgrounds, pulse-shape discrimination may be used to separate Cherenkov light arising from gamma rays in the lightguide of this detector.
| Scintillator | GS20 | GS30 |
| 6Li enriched | 6Li depleted | |
| 6Li fraction (%) | 95 | 0.01 |
| 6Li density (cm-3) | 2.21022 | 2.41018 |
The glass stack used in this detector is thinned to 60 m on the 6Li depleted side and 100 m on the 6Li doped side. Making the GS30 layer as thin as possible reduces the barrier the UCN see before reaching the GS20 layer, and keeping the GS20 layer thin reduces the efficiency for capturing thermal neutrons, which are a background when the main aim of the detector is to detect UCN.
2 Experimental Method
A 37 MBq AmBe neutron source, and a 185 kBq 252Cf neutron source were used to produce thermal neutrons, by leaving them in their lead and plastic holders respectively. Two sources were used to produce a higher rate of neutron captures with the sources available in our lab. The neutron sources were surrounded with wax blocks to further thermalize the neutrons. Thermal neutrons have a long enough interaction length to capture anywhere within the 6Li layer of the scintillating glass, producing an particle with an energy of 2.05 MeV and the triton has an energy of 2.73 MeV. When these captures happen close enough to the GS20 surface, the or triton can be detected with a Si surface barrier detector. These ions should only be seen if the GS20 side faces the surface barrier detector. In our setup, we use an Ortec A-016-025-500 partially depleted silicon surface barrier detector biased with a +140 V supply, to produce an 0.5 m thick depletion region to detect energy deposit when the or triton reach the detector.
The surface barrier detector was placed inside a metal bell which served as a dark box, and the scintillating glass was placed directly below the detector in order to minimize the distance the resultant particles had to travel through air to reach the detector ( mm). The entire setup, shown in FIG. 2.
The signal from the surface barrier detector was sent to an Ortec 142A pre-amplifier, whose output was amplified by an Ortec 572A spectroscopy amplifier. The amplified output was sent to a 1024 channel SpecTech Multi-Channel Analyzer to produce spectra of the energy deposited.
2.1 Energy Calibration
A 241Am surface source, a 210Po thin window source, a thin window 137Cs electron conversion source, and a thin window 207Bi electron conversion source with known particle energies were used to calibrate the energy scale of the Si surface barrier detector. The calibration sources were placed close to the Si instead of the 6Li glass in the setup. The two electron conversion sources had more than one energy possible, resulting in more than one energy peak. Area normalized MCA output from the four energy calibration sources are shown in Fig. 3. Each of the peaks was fitted individually, and compared to the known energies of the source, as summarized in Table 2.
| Peak Source | (keV) | Mean Fit ADC |
|---|---|---|
| 207Bi 570 keV IC | 479.181 | 80.3 2.0 |
| 207Bi 570-keV IC | 553.309 | 93.7 2.1 |
| 137Cs IC | 625.698 | 102.0 2.0 |
| 207Bi 1064 keV IC | 973.141 | 168.7 2.0 |
| 207Bi 1064 keV IC | 1047.27 | 182.1 2.1 |
| 210Po | 4965 | 860.1 4.7 |
| 241Am | 5486 | 947.7 2.1 |
It is well known that scintillators exhibit ionization quenching for large energy deposit (characterized by Birks’ constant), as is the case for the alpha and triton produced in neutron captures in our lithium glasses [14]. This is not a concern in our energy calibration, since we are not looking at the scintillation light in these tests. Instead, we are calibrating the response of a surface barrier detector to different ionization energy deposits. Rather than measuring the scintillation light, we are measuring the energy spectrum of alpha or triton particles that escape from the GS20 side of the glass.
Note that the Po source was assigned a larger uncertainty for two reasons. One was the alignment of the source and detector were not well controlled. The active source area was small and difficult to line up with the Si portion of the detector, which could lead to some energy loss in the Po energy spectrum. Another reason was that the source has a mylar film leading to a larger energy loss for this source.
3 Results
3.1 Background
Since the rate of thermal neutron capture is low by design, background had a larger presence in the neutron data than in the calibration data. Background events come from neutron captures on materials around the detector, x-rays from the neutron source, other radiation from neutron captures on other materials near the detector, natural radioactivity in the vicinity of the detector, cosmic rays, and electronic noise.
Removing the glass and the sources yielded some background, but adding the neutron source back into the set-up without the lithium glass showed that the largest background was due to the presence of the source. These could be neutron captures on materials around the detector and from x-rays from the neutron sources. In any case the background can be measured and used as a reference when comparing to data collected with the lithium glass added.
3.2 Signal
The lithium glass stack was placed in the set-up with either side up. Data was collected for 24 hours for a particular side of the glass. The resulting spectra were then normalized and compared to background. Area normalized energy spectra for the background run, and different orientations of the 6Li glass are shown in FIG. 5.
While the 6Li depleted side of the glass was similar to the background, the 6Li doped side showed an excess of events between 1300 keV and 2900 keV. This energy range is higher than the energy, indicating that most of the excess detected is due to triton captures. This makes sense, as the range of the triton is longer, and so contributes more to the detected spectrum. This procedure was repeated with nine other pieces of glass. Each time an excess appeared around the same energy range for one side of the glass, allowing us to confirm which side of the glass contained the doped scintillator.
A fit was performed in order to estimate the 6Li neutron capture signal, modelled as a sum of an alpha and a triton as a pair of gaussians with exponential tails, to a background modelled as an exponential of the form , with and determined from a fit to the depleted side facing the detector. First a fit to the sum of all of neutron captures from ten samples that were tested was performed, where all of the parameters in the fit were allowed to vary. When fitting each sample individually, all of the parameters were fixed to the values found from the fit to all of the samples, except the number of background, the number of alpha and number of triton which were allowed to float. The different number of signal and background events for each sample are due to the different counting times used. To account for uncertainties in the model, the uncertainties in the number of counts determined by integrating the function over the range 1.3 MeV to 2.9 MeV was increased by a factor determined by the ratio of the fit to degrees of freedom (DOF) .
A summary of the fit results shown in Table 3 shows that the neutron capture signal is always measured, but that there is a fair bit of variation due to the number of uncontrolled variables such as the inexact placement of glass in air near the detector, and the change in placement of wax blocks around neutron source.
| Sample | / DOF | p-value | Signal () | Background () | |
|---|---|---|---|---|---|
| All | 0.002 | ||||
| 0 | 0.045 | ||||
| 1 | 0.053 | ||||
| 2 | 0.262 | ||||
| 3 | 0.091 | ||||
| 4 | 0.359 | ||||
| 5 | 0.853 | ||||
| 6 | 0.494 | ||||
| 7 | 0.971 | ||||
| 8 | 0.385 | ||||
| 9 | 0.640 |
4 Conclusion
Using a Si surface barrier detector and a thermal neutron source, it is possible to determine the presence of 6Li in scintillating lithium glass. Neutrons capture on the 6Li to produce an and triton. When the neutron captures near the surface of the glass, the ejected ions can be detected over background, and thus determine which side of the glass to put facing toward the UCN source when assembling the detector.
5 Acknowledgements
We would like to acknowledge the Natural Sciences and Engineering Research Council of Canada for funding. We thank the TRIUMF-UCN group for useful discussions relating to the neutron Electric Dipole Moment experiment being planned, and discussions on the requirements for the UCN detector. We also would like to acknowledge Chuck Davis’ idea of using an ion chamber to check the lithium glass side by trying to detect the products from the neutron captures. We have adapted his idea to the experiment described in this paper.
References
- [1] M. Wohlmuther, et. al., “The spallation target of the ultra-cold neutron source UCN at PSI,” Nucl. Instr. and Meth. A 564, 51-56 (2006).
- [2] S.N. Balashov, et al., arXiv:0709.2428.
- [3] A.P.Serebrov, et. al., “ New measurements of neutron electric dipole moment with double chamber EDM spectrometer,” JETP Letters 99, 4 (2014).
- [4] A.P. Serebrov, et al., Physics Procedia, 17 (2011), p. 251.
- [5] K. Kirch, AIP Conference Proceedings 1560, 90 (2013).
- [6] C.A. Baker, et al., Physics Procedia 17, 159 (2011).
- [7] Y. Masuda, K. Asahi, K. Hatanaka, S.-C. Jeong, S. Kawasaki, R. Matsumiya, K. Matsuta, M. Mihara, Y. Watanabe, Physics Letters A 376, 1347 (2012).
- [8] I. Altarev, et al., Nuovo Cimento C 35, 122 (2012).
- [9] R. Golub and S.K. Lamoreaux, Physics Reports 237, 1 (1994).
- [10] Takeyasu M. Ito, “Plans for a Neutron EDM Experiment at SNS,” J.Phys. Conf. Ser. 69, 012037 (2007).
- [11] C.L. Morris et. al., “Multi-wire propotional chamber for ultra-cold neutron detection,” Nucl. Instr. and Meth. A 599, 248-250 (2009).
- [12] G. Ban et. al., “UCN detection with 6Li-doped glass scintillators,” Nucl. Instr. and Meth. A 611, 280-283 (2009).
- [13] S. Afach et. al., “A device for the simultaneous spin analysis of ultracold neutrons,” arXiv:1502.06876v1, (2015).
- [14] A.W. Dalton, “Measurement of the responses of small lithium glass scintillators to protons, deuterons and alpha particle,” Australian Atomic Energy Commission, AAEC/E641, 1987.
- [15] Lithium-6 enriched glass. Applied Scintillation Technologies. (2014) http://www.appscintech.com/products/gs20-lithium-6-glass
- [16] Lithium-7 enriched glass. Applied Scintillation Technologies. (2014) http://www.appscintech.com/products/gs30-lithium-7-glass