

The Absolute Parameters for NSVS 11868841 \addkeywordStars: activity \addkeywordStars: fundamental parameters \addkeywordStars: low-mass \addkeywordStars: eclipsing
The Absolute Parameters for NSVS 11868841 and the Oversized Stars in the Low-Mass Eclipsing Binaries Thanks: Based on spectroscopic observations collected at TÜBİTAK National Observatory (Turkey).
Abstract
Spectroscopic observations of the low-mass eclipsing binary NSVS 11868841 have been obtained and the radial velocities were derived for both components. The masses and radii determined for the components are =0.8700.074, =0.6070.053and =0.983 0.030 , =0.9010.026 . Both the primary and secondary stars’ radii are 10 % and 57% larger than those of zero-age-main-sequence stars with the same masses. This discrepancy may be arisen from the large spot coverage of both stars. We collected absolute parameters of 21 low mass double-lined eclipsing binaries and compared their positions in the mass-radius and mass-effective temperature panels. The large radii and lower effective temperatures are solved neither with difference in metallicity nor in mixing length parameters. These discrepancies in the low mass stars may be originated by magnetic fields causing inhibition convective energy transport which leads to large magnetic spot coverage on the surface of a low mass star.
0.1 Introduction
Eclipsing binaries are the best laboratories for determining the fundamental physical properties of stars. Detached, double-lined eclipsing binaries yield direct and accurate measures of the masses and radii of the component stars. Measuring of these quantities has always been observationally challenging. Large-scale surveys, providing imaging and photometric catalogues for substantial fractions of the celestial sphere, are now available at a wide range of wavelengths. Over the last few years, these surveys have become invaluable research tools for investigating the properties of intrinsically rare objects. These surveys have proven most useful in searches for low-mass stars. Stars with masses less than 1 are regarded as low-mass stars and have late spectral types, namely G, K or M. We cannot vary the conditions prevalent on an individual star, so observations of many individual stars are combined to build up a picture of how stars of different mass and composition evolve. Since the intermediate- and high-mass stars are intrinsically bright sources most studies have centered on them with little consideration of M dwarfs with masses below 0.6 . This reflects the availability of more precise observational constraints, and also greater analytic tractability in modelling higher-mass stars. Recently, however, the lower main-sequence has attracted more attention, with a series of detailed models extending past the hydrogen-burning limit to the boundary between low-mass brown dwarfs and giant planets. Understanding the structure and evolution of stars is a basic goal of stellar astronomy. Critical tests of the evolution theory for stars can be made on a small set of eclipsing binary stars (Baraffe et al. 1998, Girardi et al. 2002, Siess et al. 1997, Chabrier et al. 2007). While the results of stellar evolution models compare favourably to data for main-sequence stars with masses greater than that of the Sun, evidence has been growing that the models for stars on the lower main-sequence have problems when confronted with precise masses and radii from double-lined eclipsing binaries. As shown by Torres and Ribas (2002) the evolutionary models underestimate the radii and overestimate the effective temperatures of the low-mass stars. These discrepancies were confirmed in subsequent studies by Ribas(2003), Lopez-Morales and Ribas (2005), Torres et al. (2006), Morales et al. (2009a), Morales et al. (2009b), and others. Hints of the radius discrepancies have also been described by Popper (1997), Clausen et al. (1999), and others. Recently, Mullan and MacDonald (2001), Torres et al. (2006), Morales, Ribas and Jordi (2008) proposed a hypothesis based upon the effects of stellar activity to explain the discrepancies. Furthermore Stassun et al. (2009) called attention to that low-mass stars appear older or younger in mass-radius diagram depending on whether post- or pre-main-sequence models are used. As the number of low-mass eclipsing binaries studied carefully, both photometrically and spectroscopically, is increased a better comparison with the theoretical models can be made.
Light variability of NSVS 11868841 ( 23h17m58s, + 19\arcdeg17\arcmin03\arcsec(J2000), hereafter NSVS 1186) was detected by Wozniak et al.(2004) from the Northern Sky Variability Survey. They classified it as a detached eclipsing binary with combined median magnitude of V=14m.0840.076 and an orbital period of 0.60179 days. High-precision light curves in the Johnson V-, R-, and I-bandpass were obtained by Coughlin and Shaw (2007). Since the radial velocities of the components were not available they have determined the radii of the stars by analysing the V- and R-bandpass light curves. In this study we present the first radial velocities for the components of double-lined, short-period eclipsing binary NSVS 1186 and the physical parameters obtained from the analyses of radial velocities and light curves. Both components show high level chromospheric activity, evidenced by Hα emission lines in their spectra. We discuss the properties of the binary and in relation to the discrepancies between empirical and theoretical mass-radius and mass-effective temperature relations for low-mass stars.
0.2 Spectroscopic Observations
0.2.1 Spectroscopy
Since the wide-band light curves of NSVS 1186 are available we observed the star spectroscopically. Optical spectroscopic observations were obtained with the Turkish Faint Object Spectrograph Camera (TFOSC) attached to the 1.5 m telescope on August 23, 24, and 25, 2008 under good seeing conditions. Further details on the telescope and the spectrograph can be found at http://www.tug.tubitak.gov.tr. The wavelength coverage of each spectrum was 4100-8100 Å in 11 orders, with a resolving power of / 7 000 at 6563 Å and an average signal-to-noise ratio (S/N) was 150. We also obtained a high S/N spectrum of the M dwarf GJ 740 (M0 V) and GJ 623 (M1.5 V) for use as templates in derivation of the radial velocities (Nidever et al. 2002).
The electronic bias was removed from each image and we used the ’crreject’ option for cosmic ray removal. The echelle spectra were extracted and wavelength calibrated by using a Fe-Ar lamp source with help of the IRAF echelle package. The stability of the instrument was checked by cross correlating the spectra of the standard star against each other using the fxcor task in IRAF. The standard deviation of the differences between the velocities measured using fxcor and the velocities in Nidever et al. (2002) was about 1.1 km s-1.
Spectral Types and Temperature Estimates
We have used the spectra to reveal the spectral type of the primary component of NSVS 1186. For this purpose we have degraded the spectral resolution from 7 000 to 3 000, in order to use the calibrations by Hernández et al. (2004) by convolving them with a Gaussian kernel of the appropriate width, and we have measured the equivalent widths () of photospheric absorption lines for the spectral classification. We have followed the procedures described by Hernández et al., choosing metallic lines in the blue-wavelength region, where the contribution of the primary component is considerably larger than that of the secondary in the spectra. From several spectra we measured equivalent widths of some spectral lines assuming the light contribution of the primary star is 0.6, as given in Table 1.
| EWp (Å) | EWs (Å) | |
|---|---|---|
| Ca i 4226 | 2.130.11 | 1.390.12 |
| Fe i 5329 | 1.110.11 | 0.990.12 |
| Fe i 4271 | 1.440.13 | 1.410.12 |
| Ca i+Fe i 5270 | 2.910.21 | 2.110.21 |
| Ca i 6162 | 1.990.42 | 1.110.09 |
| Fe i 5079 | 0.790.07 | 0.470.11 |
From the calibration relations of –Spectral-type given by Hernández et al. (2004), we have derived a spectral type of G91 for the primary component. The effective temperature deduced from the calibrations of Drilling & Landolt (2000), de Jager & Nieuwenhuijzen (1987) and Popper (1980) is 5 23080, 5 23080, and 5 330141 K for the primary component, respectively. The mean effective temperature of the primary component deduced from the spectra is 5 25095 K .
NSVS 1186 is listed in several large photometric databases consolidated in the Naval Observatory Merged Astronomical Dataset (NOMAD-1.0, Zacharias et al. 2004), which provide optical magnitudes of B=14m.770m.02, V=13m.870m.01, R=13m.940m.01, I=12m.740m.02.Since the magnitudes collected from photographic measurements and the colors are inconsistent no attempt has been made to calculate the effective temperatures of the components. The infrared magnitudes are taken from 2MASS (Cutri et al. 2003) catalog as J=12m.5180m.023, H=12m.0690m.021, and K=11m.9950m.019. The observed infrared colours of J-H=0m.4490m.031 and H-K=0m.0740m.028 correspond to a combined spectral type of G92 is in a good agreement with that we derived by spectral lines alone. Using the depth of the eclipses in three bands we estimate light contribution of the primary component as 0.60, 0.57, 0.55 and 0.56 in the V, J, H and K bands respectively. Hence V-K, J-H and H-K colors of the primary component corresponds to a spectral type of G92. We estimated a temperature of 5 240 230 K from the calibrations of Tokunaga (2000). Temperature uncertainty of the primary component results from considerations of spectral type uncertainties, and calibration differences. The effective temperature of the primary star what we derived from the infrared photometric measurements is in a good agreement with that we estimated from the spectra alone. The weighted mean of the effective temperature of the primary component is 5 250135 K.
Rotational Velocities of the Components
The width of the cross-correlation profile is a good tool for the measurement of (see, e.g., Queloz et al. 1998). The rotational velocities () of the two components were obtained by measuring the FWHM of the CCF peaks in nine high-S/N spectra of NSVS 1186 acquired close to the quadratures, where the spectral lines have the largest Doppler-shifts. In order to construct a calibration curve FWHM-, we have used an average spectrum of HD 27962, acquired with the same instrumentation. Since the rotational velocity of HD 27962 is very low but not zero ( 11 km s-1, e.g., Royer, Zorec & Fremat 2004 and references therein), it could be considered as a useful template for low-mass stars rotating faster than 10 km s-1. The spectrum of HD 27962 was synthetically broadened by convolution with rotational profiles of increasing in steps of 5 km s-1 and the cross-correlation with the original one was performed at each step. The FWHM of the CCF peak was measured and the FWHM- calibration was established. The values of the two components of NSVS 1186 were derived from the FWHM of their CCF peaks and the aforementioned calibration relations, for few wavelength regions and for the best spectra. As a result the projected rotational velocity of 773 km s-1 for the primary star and 624 km s-1 for the secondary star were estimated. However, note that the spectral lines of the components could not be separated even at the quadratures. Thus the projected rotational velocities estimated in this way should involve higher uncertainties than those given here.
0.3 Analysis
0.3.1 The Orbital Configuration
To derive the radial velocities for the components of binary system, the 16 TFOSC spectra of the eclipsing binary were cross-correlated against the spectrum of GJ 740, a single-lined M0V star, on an order-by-order basis using the fxcor package in IRAF11 1 IRAF is distributed by the National Optical Observatory, which is operated by the Association of the Universities for Research in Astronomy, inc. (AURA) under cooperative agreement with the National Science Foundation. The majority of the spectra showed two distinct cross-correlation peaks in the quadrature, one for each component of the binary. Thus, both peaks were fit independently in the quadrature with a Gaussian profile to measure the velocity and errors of the individual components. If the two peaks appear blended, a double Gaussian was applied to the combined profile using de-blend function in the task. For each of the 16 observations we then determined a weighted-average radial velocity for each star from all orders without significant contamination by telluric absorption features. Here we used as weights the inverse of the variance of the radial velocity measurements in each order, as reported by fxcor. In these data, we find no evidence for a third component, since the cross-correlation function showed only two distinct peaks. We adopted a two-Gaussian fit algorithm to resolve cross-correlation peaks near the first and second quadratures when spectral lines are visible separately. Figure 1 shows examples of cross-correlations obtained by using the largest FWHM at nearly first and second quadratures. The two peaks, non-blended, correspond to each component of NSVS 1186. The stronger peaks in each CCF correspond to the more luminous component which has a larger weight into the observed spectrum.

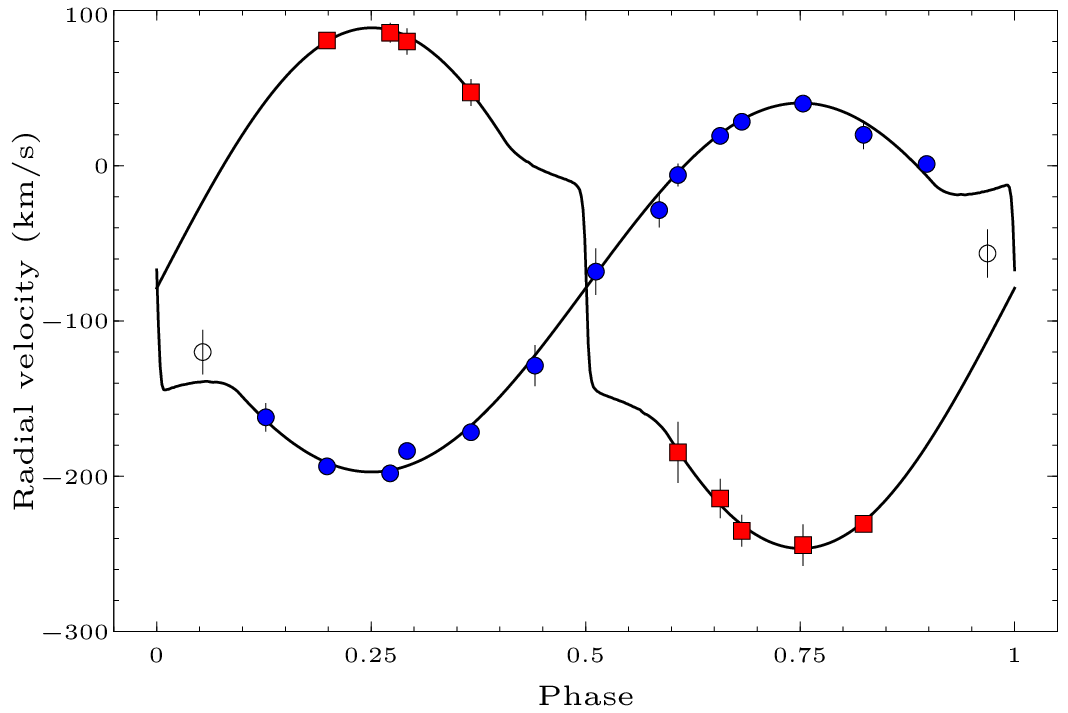
The heliocentric radial velocities for the primary (Vp) and the secondary (Vs) components are listed in Table 2, along with the dates of observation and the corresponding orbital phases computed with the ephemeris given by Coughlin and Shaw (2007). The velocities in this table have been corrected to the heliocentric reference system by adopting a radial velocity of 9.5 km s-1 for the template star GJ 740. The radial velocities listed in Table 2 are the weighted averages of the values obtained from the cross-correlation of orders #4, #5, #6 and #7 of the target spectra with the corresponding order of the standard star’s spectrum. The weight has been given to each measurement. The standard errors of the weighted means have been calculated on the basis of the errors () in the radial velocity values for each order according to the usual formula (e.g. Topping 1972). The values are computed by fxcor according to the fitted peak height, as described by Tonry & Davis (1979).
First we analysed the radial velocities given in Table 2 for the initial orbital parameters. We used the orbital period held fixed and computed the eccentricity of the orbit, systemic velocity and semi-amplitudes of the radial velocities. The results of the analysis performed with phoebe are as follows: =0.0020.001, i.e. formally consistent with a circular orbit, =-803 km s-1, =1185 and =1696 km s-1. Using these values we estimate the projected orbital semi-major axis and mass ratio as: =3.4120.093 and =0.700.04. The observed and calculated radial velocities of both components are plotted in Figure 2 for comparison.
| HJD 2400000+ | Phase | Star 1 | Star 2 | ||
|---|---|---|---|---|---|
| 55069.4412∗ | 0.0536 | -120.0 | 14.3 | \nodata | \nodata |
| 55069.4855 | 0.1272 | -162.0 | 9.2 | \nodata | \nodata |
| 55069.5284 | 0.1985 | -193.6 | 4.3 | 80.6 | 4.2 |
| 55069.5727 | 0.2721 | -198.1 | 3.9 | 85.6 | 6.3 |
| 55068.3810 | 0.2918 | -183.7 | 3.2 | 80.0 | 8.4 |
| 55068.4258 | 0.3663 | -171.6 | 3.0 | 47.2 | 8.6 |
| 55068.4707 | 0.4409 | -128.7 | 13.2 | \nodata | \nodata |
| 55068.5134 | 0.5119 | -68.2 | 14.9 | \nodata | \nodata |
| 55068.5578 | 0.5857 | -28.6 | 11.1 | \nodata | \nodata |
| 55067.3674 | 0.6076 | -6.0 | 7.3 | -184.6 | 19.7 |
| 55068.6006 | 0.6568 | 19.2 | 3.3 | -214.3 | 12.6 |
| 55067.4122 | 0.6820 | 28.3 | 3.1 | -235.1 | 10.2 |
| 55067.4552 | 0.7534 | 40.0 | 1.4 | -244.3 | 13.3 |
| 55067.4976 | 0.8240 | 19.9 | 9.2 | -230.6 | 5.2 |
| 55067.5419 | 0.8975 | 1.1 | 2.4 | \nodata | \nodata |
| 55067.5846∗ | 0.9684 | -56.5 | 15.5 | \nodata | \nodata |
∗ These data were not used in the RV analysis.
0.3.2 Modelling the Light Curves
As we mentioned in § 1 the V-, R- and I-bandpass light curves were obtained by Coughlin and Shaw (2007). The differential magnitudes and orbital phases were read out carefully by the method of dexter22 2 http://dc.zah.uni-heidelberg.de/sdexter. We used the most recent version of the eclipsing binary light curve modelling algorithm of Wilson & Devinney (1971, with updates), as implemented in the phoebe code of Prša & Zwitter (2005). The code needs some input parameters, which depend upon the physical structures of the component stars. In the light curve solution we fixed some parameters whose values can be estimated from global stellar properties, such as effective temperature of the primary component and mass-ratio. The weighted mean of the effective temperature has been estimated to be 5 250135 K and the mass-ratio of 0.700.04. Using these values we adopted the linear limb-darkening coefficients from Van Hamme (1993) as 0.39 and 0.28 for the primary and secondary components, respectively; the bolometric albedos from Lucy (1967) as 0.5, typical for a convective stellar envelope, the gravity brightening coefficients as 0.32 for the both components. The rotation of components is assumed to be synchronous with the orbital one. We start with the adjustable parameters: the orbital inclination, , the effective temperature of the less massive star, T, the potential of the components, and , and the monochromatic luminosity of the more massive star, L1. Assuming it is a detached binary we used of the DC program for individual solution. First we determined the preliminary elements and compared with the observed light curves. Since the observed light curves show distortions we started with the two spot solution, one on the primary and other on the secondary component. The initial spot parameters were adopted from Coughlin & Shaw (2007). Best fit was obtained for each light curve using the same spots and the corresponding parameters are given in Table 3. The parameters presented in the last column is the weighted mean of the parameters obtained from individual light curves. Coughlin & Shaw (2007) analyzed only V- and R-light curves. Our analysis gives very different parameters when compared with those obtained by them. They estimate very low effective temperatures for the components with respect to their predicted masses. The fractional radii for the primary and secondary stars obtained by them are 15 % and 20 % smaller than obtained by us using the same light curves. In contrary, the absolute radii are 5 % and 3 % larger than we found. The main difference is the locations of the spots on the surface of the stars. The spot parameters given by them for the stars should be interchanged. One spot on the south pole of the primary and one spot on the north pole of the secondary well represent the three-color light curves. The spot coverage on the surface of the stars is about 8 %.
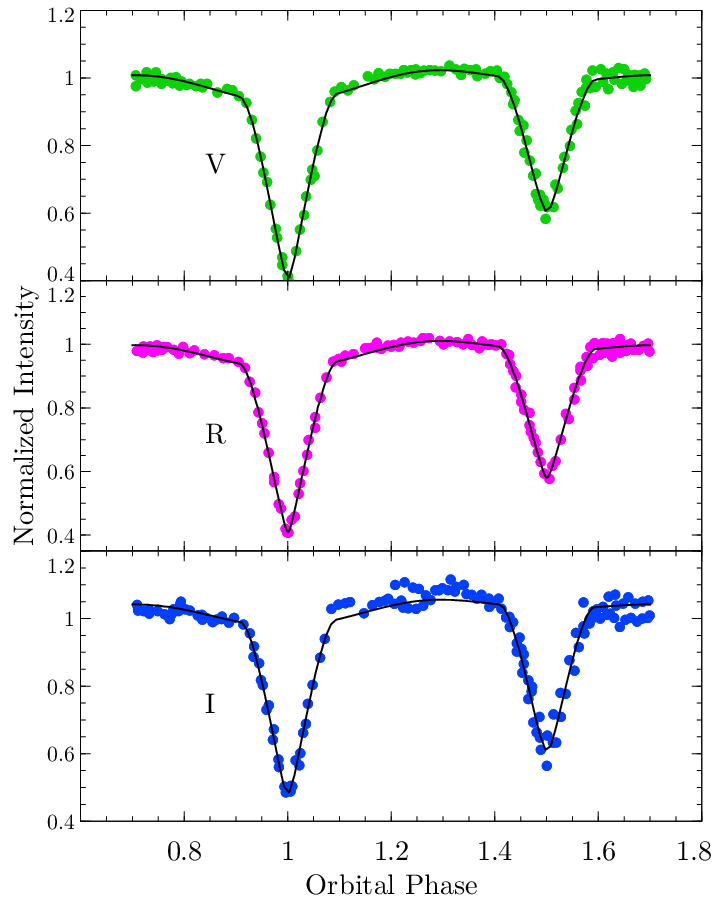
| Parameters | V | R | I | Adopted |
|---|---|---|---|---|
| 87.00.5 | 88.60.2 | 88.30.2 | 88.00.4 | |
| T (K) | 5 250[Fix] | 5 250[Fix] | 5 250[Fix] | 5 250[Fix] |
| T (K) | 5 04012 | 4 99014 | 5 11034 | 5 02016 |
| 4.2420.049 | 4.2740.049 | 4.2600.072 | 4.2620.052 | |
| 3.8100.026 | 3.7390.020 | 3.9890.054 | 3.7900.026 | |
| r1 | 0.2890.004 | 0.2880.004 | 0.2860.006 | 0.2880.004 |
| r2 | 0.2630.003 | 0.2670.002 | 0.2500.005 | 0.2640.003 |
| 0.6040.009 | 0.5860.009 | 0.5910.013 | \nodata | |
| 0.041 | 0.026 | 0.131 | \nodata | |
| weight | 3 | 5 | 1 | \nodata |
0.3.3 Absolute Parameters
Combining the parameters obtained by radial velocity and light curve analyses we calculated the physical parameters of the components as listed in Table 4. We compare the locations of the components in the effective temperature-luminosity diagram, i.e. Hertzsprung-Russell diagram (Figure 4). While the location of the more massive primary star agrees well with a star of having the mass, the secondary component appears to be more luminous, more probably originating larger effective temperature and radius. We also computed the radii of the components as R1=0.9830.030 and R2=0.9010.026 for the primary and secondary stars, respectively.
We computed the luminosities of the components using these radii and effective temperatures as L1 =0.6490.069 and L2=0.4560.049 for the primary and secondary stars, respectively. We compare the positions of the components in L-Te diagram with evolutionary tracks of pre- and post- main sequence evolution and as well as with the ZAMS, as shown in Figure 4. For constructing solar metallicity ZAMS and evolutionary tracks, we used the Cambridge version of the the stars code which was originally developed by Eggleton (1971) and had substantial revision up to date (Eldridge & Tout, 2004). The current version is also capable to account molecular contribution on equation of state according to Marigo (2002) approximation which may be crucial for low mass stars. The less massive component seems to hotter and more luminous with respect to the models. The physical parameters determined by us are very different from those obtained by Coughlin and Shaw (2007). While they estimate effective temperatures between 4 370 and 5 250 K from the observed colours they adopted an effective temperature of 3 970 K for the more massive star. The masses of the components estimated to be 0.94 and 0.87 and radii of 1.03 and 0.93, and an effective temperature of 3 750 K for the secondary star. The locations of the component stars in the HR diagram correspond to stars having masses below 0.4 . The J-,H-, and K- band extinctions in the direction of the variable taken from Schlegel et al. (1998) as AJ=0.046, AH=0.030 and AK=0.019 magnitudes. We computed the absolute magnitudes as MJ=3.960.10, MH=3.500.07 and MK=3.460.07 for the primary star. Then using the JHK magnitudes given in § 2.1.1 we estimate the distance to the variable as 66825, 68924 and 67822 parsec in J,H, and K bands, respectively.
| Parameter | Primary | Secondary |
|---|---|---|
| Mass (M⊙) | 0.8700.074 | 0.6070.053 |
| Radius (R⊙) | 0.9830.030 | 0.9010.026 |
| () | 4.3920.019 | 4.3110.021 |
| (K) | 5 250135 | 5 020135 |
| -0.1880.045 | -0.3410.046 | |
| (km s-1) | 773 | 624 |
| (km s-1) | 833 | 762 |

0.4 Oversized Stars in the Low-Mass Eclipsing Binaries
Abt (1963) and Duquennoy, Mayor and Halbwachs (1991) report that binary stars are more common than single stars at masses above that of the Sun. In contrary, Reid & Gizis (1997) and Delfosse et al. (1999) suggest that binaries are not very common in low-mass stars, although approximately 75 % of all stars in our Galaxy are low-mass dwarfs with masses smaller than 0.7 . Due to the low binary fractions and their faintness very few low-mass eclipsing binary systems have been observed so far both photometrically and spectroscopically, yielding accurate physical parameters. Recently in a pioneer study, Ribas (2003,2006) collected the available masses and radii of the low-mass stars and compared with those obtained by stellar evolution models. Even small numbers of the sample, a total of eight double-lined eclipsing binaries whose mass and radius are determined with an accuracy of better than 3 %, the comparison evidently revealed that the observed radii are systematically larger than the models. However, the effective temperatures are cooler than the theoretical calculations, being the luminosities in agreement with those of single stars with the same mass. This discrepancy between the models and observations has been explained by Mullan and MacDonald (2001), Torres et al. (2006), Ribas (2006) and Lopez-Morales (2007) and others by the high level magnetic activity in the low-mass stars. They suggest that stellar activity may be responsible for the observed discrepancy through inhibition of convection or effects of a significant spot coverage. However, Berger et al. (2006) compared the interferometric radii of low-mass stars with those estimated from theory and find a correlation between an increase in metallicity and larger-than-expected radius, i.e. the larger radii are caused by differences in metallicity.
The number of double-lined low-mass eclipsing binaries having precise photometric and spectroscopic observations is reached to 21 according to knowledge of the authors. Combining the results of the analysis of both photometric and spectroscopic observations accurate masses, radii, effective temperatures and luminosities of the components have been obtained. In Table 5 we list absolute parameters for the low-mass stars with their standard deviations. In Figure 5 we plot the radii of the low-mass stars in the eclipsing binary systems as a function of mass. Theoretical mass-radius (M-R) diagrams for the zero-age main-sequence stars with solar abundance taken from the stars code and Siess et al. (2000) are also plotted for comparison.
The stars below 0.3 appear to trace the theoretical M-R diagram. However, larger mass stars, above 0.3 , significantly deviate from the theoretical M-R digram. We also computed projected rotational velocities of the components using their radii and orbital period. Since the orbital periods are generally short we assume spin-orbit synchronization. The rotational velocities are plotted in Figure 6 as a function of the radius difference calculated as . This plot shows that as the rotational velocity increases, the difference in radius, gets larger for the stars given in Table 5.
A low-mass star has a convective atmosphere with a radiative core. The depth of the convective zone is about 0.28 R for a star of mass about 0.9 , and gradually increases to about 0.41 R for a star with a mass about 0.4 . Stars are thought to be fully convective below about 0.35 . Therefore, the internal structure of such a low-mass star with a deep convective zone is tightly dependent on the mixing length parameter, . In Figure 7a and b we compare locations of the low-mass stars in the M-R and M-Teff diagrams with the theoretical calculations for various parameters. Convection is modelled by mixing length theory (Böhm-Vitense 1958) with the ratio of mixing length to pressure scale height (i.e. ). Theoretical models show that there is no significant separation in the M-R relation for the stars below about 0.6 , depending on the mixing length parameter. For masses above this value a separation is revealed. However, as the parameter increases the computed effective temperature gets higher. A separation is clearly seen even for the masses below 0.6 . We also plotted empirical parameters of the low-mass stars in these panels. This comparison clearly exposes that the discrepancies in radii and effective temperatures could not be explained only by changing parameter as it is obvious in M-R and M-Teff plots represented in Figure 7. On the other hand Demory et al. (2009) showed that there is no significant correlation between metallicity and radius of the single, low-mass stars. An alternative explanation remains to be the magnetic activity responsible for the observed larger radii but cooler effective temperatures. As demonstrated by D’Antona et al. (2000), Mullan and MacDonald (2001) and Chabrier et al.(2007) magnetic fields change the evolution of low-mass stars. Due to the high magnetic activity in the fast-rotating dwarfs their surface are covered by dark spots. Spot coverage in active dwarfs yields larger radii and lower effective temperatures.
| Object | Star | Mass/ | Radius/ | Teff/K | P | Refs | |||||||
|---|---|---|---|---|---|---|---|---|---|---|---|---|---|
| CM Dra | A | 0.2310 | 0.0009 | 0.2534 | 0.0019 | 3130 | 70 | 1.276 | 1 | ||||
| B | 0.2141 | 0.0008 | 0.2398 | 0.0018 | 3120 | 70 | |||||||
| YY Gem | A | 0.5992 | 0.0047 | 0.6194 | 0.0057 | 3820 | 100 | 0.820 | 2 | ||||
| B | 0.5992 | 0.0047 | 0.6194 | 0.0057 | 3820 | 100 | |||||||
| CU Cnc | A | 0.4349 | 0.0012 | 0.4323 | 0.0055 | 3160 | 150 | 2.794 | 3 | ||||
| B | 0.3992 | 0.0009 | 0.3916 | 0.0094 | 3125 | 150 | |||||||
| GU Boo | A | 0.6101 | 0.0064 | 0.6270 | 0.0160 | 3920 | 130 | 0.492 | 4 | ||||
| B | 0.5995 | 0.0064 | 0.6240 | 0.0160 | 3810 | 130 | |||||||
| TrES-Her0-07621 | A | 0.4930 | 0.0030 | 0.4530 | 0.0600 | 3500 | \nodata | 1.137 | 5 | ||||
| B | 0.4890 | 0.0030 | 0.4520 | 0.0500 | 3395 | \nodata | |||||||
| 2MASS J05162881+2607387 | A | 0.7870 | 0.0120 | 0.7880 | 0.0150 | 4200 | \nodata | 2.619 | 6 | ||||
| B | 0.7700 | 0.0090 | 0.8170 | 0.0100 | 4154 | \nodata | |||||||
| UNSW-TR 2 | A | 0.5290 | 0.0350 | 0.6410 | 0.0500 | \nodata | \nodata | 2.144 | 7 | ||||
| B | 0.5120 | 0.0350 | 0.6080 | 0.0600 | \nodata | \nodata | |||||||
| NSVS 06507557 | A | 0.6560 | 0.0860 | 0.6000 | 0.0300 | 3960 | 80 | 0.520 | 8 | ||||
| B | 0.2790 | 0.0450 | 0.4420 | 0.0240 | 3365 | 80 | |||||||
| NSVS 02502726 | A | 0.7140 | 0.0190 | 0.6740 | 0.0600 | 4300 | 200 | 0.560 | 9 | ||||
| B | 0.3470 | 0.0120 | 0.7630 | 0.0050 | 3620 | 205 | |||||||
| T-Lyr1-17236 | A | 0.6795 | 0.0107 | 0.6340 | 0.0430 | 4150 | \nodata | 8.430 | 10 | ||||
| B | 0.5226 | 0.0061 | 0.5250 | 0.0520 | 3700 | \nodata | |||||||
| 2MASS J01542930+0053266 | A | 0.6590 | 0.0310 | 0.6390 | 0.0830 | 3730 | 100 | 2.639 | 11 | ||||
| B | 0.6190 | 0.0280 | 0.6100 | 0.0930 | 3532 | 100 | |||||||
| GJ 3236 | A | 0.3760 | 0.0170 | 0.3828 | 0.0072 | 3310 | 110 | 0.770 | 12 | ||||
| B | 0.2810 | 0.0150 | 0.2992 | 0.0075 | 3240 | 110 | |||||||
| SDSS-MEB-1 | A | 0.2720 | 0.0200 | 0.2680 | 0.0090 | 3320 | 130 | 0.410 | 13 | ||||
| B | 0.2400 | 0.0220 | 0.2480 | 0.0080 | 3300 | 130 | |||||||
| BD -22 5866 | A | 0.5881 | 0.0029 | 0.6140 | 0.0450 | \nodata | \nodata | 2.211 | 14 | ||||
| B | 0.5881 | 0.0029 | 0.5980 | 0.0450 | \nodata | \nodata | |||||||
| NSVS 01031772 | A | 0.5428 | 0.0027 | 0.5260 | 0.0028 | 3615 | 72 | 0.368 | 15 | ||||
| B | 0.4982 | 0.0025 | 0.5088 | 0.0030 | 3513 | 31 | |||||||
| NSVS 11868841 | A | 0.8700 | 0.0740 | 0.9830 | 0.0300 | 5260 | 110 | 0.602 | This paper | ||||
| B | 0.6070 | 0.0530 | 0.9010 | 0.0260 | 5020 | 110 | |||||||
| GJ 2069A | A | 0.4329 | 0.0018 | 0.4900 | 0.0800 | \nodata | \nodata | 2.771 | 16 | ||||
| B | 0.3975 | 0.0015 | 0.3300 | 0.0400 | \nodata | \nodata | |||||||
| 2MASS J04463285+1901432 | A | 0.4700 | 0.0500 | 0.5700 | 0.0200 | 3320 | 150 | 0.630 | 18 | ||||
| B | 0.1900 | 0.0200 | 0.2100 | 0.0100 | 2910 | 150 | |||||||
| NSVS 6550671 | A | 0.5100 | 0.0200 | 0.5500 | 0.0100 | 3730 | 60 | 0.193 | 19 | ||||
| B | 0.2600 | 0.0200 | 0.2900 | 0.0100 | 3120 | 65 | |||||||
| IM Vir | A | 0.9810 | 0.0120 | 1.0610 | 0.0160 | 5570 | 100 | 1.309 | 20 | ||||
| B | 0.6644 | 0.0048 | 0.6810 | 0.0130 | 4250 | 130 | |||||||
| RXJ0239.1 | A | 0.7300 | 0.0090 | 0.7410 | 0.0040 | 4645 | 20 | 2.072 | 21 | ||||
| B | 0.6930 | 0.0060 | 0.7030 | 0.0020 | 4275 | 15 | |||||||
- Ref:
(1)Morales et al. (2009a), (2)Torres & Ribas (2002), (3)Ribas (2003), (4)López-Morales & Ribas (2005), (5)Creevey et al. (2005), (6)Bayless & Orosz (2006), (7)Young et al. (2006), (8)Çakırlı & Ibanoǧlu (2010), (9)Çakırlı, Ibanoǧlu & Güngör (2009), (10) Devor et al. (2008), (11)Becker et al. (2008), (12)Irwin et al. (2009), (13)Blake et al. (2008), (14)Shkolnik et al. (2008), (15)López-Morales et al. (2006), (16)Delfosse et al. (1999), (17)Beatty et al. (2007), (18)Hebb et al. (2006), (19)Dimitrov & Kjurkchieva (2010) ,(20)Morales et al. (2009b), (21)López-Morales & Shaw (2007)

0.5 Discussion
We obtained the radial velocity curves for the low-mass eclipsing binary NSVS 1186. We re-analysed the existing V-, R- and I-bandpass light curves. Since the light curves are distorted they are modelled assuming one spot located on each star. Then combining the photometric and spectroscopic solutions we derived the absolute physical parameters for both components. The standard deviations of the parameters have been determined using the jktabsdim code (Southworth and Clausen 2005). The less massive component appears to have a larger radius and higher temperature with respect to the its mass. On the other hand the primary star seems to have a larger radius but the effective temperature is in agreement with that expected from its mass. We suppose that the larger radii of both components may be originated from a higher activity in the system at the time that photometry is performed. The locations of the components in the H-R diagram have been plotted and compared with theoretical models. The secondary component seems to have slightly brighter with respect to its mass.
Basic physical parameters determined from double lined mass binaries , such as mass, radius, effective temperature and orbital period, for low-mass stars are collected. The locations of the low-mass stars in the mass-radius panel are compared with the theoretical ZAMS models. Since the low-mass stars evolve very slowly, we prefer a comparison with the ZAMS models. Theoretical models tend to underestimate the radii at a given mass in the range of 0.3 and 0.6 . Due to the evolutionary effect on the radius, we take into account only this mass range, preventing any confusion. Since low-mass stars have deeper convective layers in their atmospheres we also computed the radii and temperatures for the above-mentioned mass range for various mixing-length parameters. We find that mixing-length parameter does not significantly affect the radii, in contrary, it changes considerably the effective temperatures of the stars. Comparison with the observations shows that the observed larger radii of the late K and M dwarfs can not only be represented with the values of mixing-length parameters. These comparisons confirm that magnetic field induced inhibition of convection in fast-rotating low-mass stars with deep convective zones lead to larger radii and lower effective temperatures than those expected from theoretical models (D’Antona et al. 2000, Mullan and MacDonald 2001, Chabrier et al. 2007) .


Acknowledgments
The authors acknowledge generous allotments of observing time at TUBITAK National Observatory (TUG) of Turkey. We also wish to thank the Turkish Scientific and Technical Research Council for supporting this work through grant Nr. 108T210 and EBİLTEM Ege University Science Foundation Project No:08/BİL/027 . Dr. Esin Sipahi is acknowledged for the aid during the computation. We would like express our sincere gratitudes to the anonymous referee whose suggestions made the paper very clearer.
References
- Abt (1963) Abt H. A. 1963, ApJS, 8, 99
- Baraffe et al. (1998) Baraffe I., Chabrier G., Allad F., Hauschildt P. H., 1998, A&A, 337, 403
- Abt (1963) Bayless A. J., Orosz J. A., 2006, ApJ, 651, 1155
- Abt (1963) Beatty T. G., et al., 2007, ApJ, 663, 573
- Abt (1963) Becker A. C., et al., 2008, MNRAS, 386, 416
- Abt (1963) Berger D. H., et al., 2006, ApJ, 644, 475
- Abt (1963) Blake C. H., Torres G., Bloom J. S., Gaudi B. S., 2008, ApJ, 684, 635
- Abt (1963) Böhm-Vitense E., 1958, ZA, 46, 108
- Abt (1963) Chabrier G., Gallardo J., Baraffe I., 2007, A&A, 472, 17
- Abt (1963) Clausen J. V., Helt B. E., Olsen E. H., 1999, ASPC, 173, 321
- Abt (1963) Coughlin J. L., and Shaw J. S., 2007, JSARA, 1, 7C
- Abt (1963) Creevey O. L., et al., 2005, ApJ, 625, L127
- Abt (1963) Cutri R. M., et al., 2003, The IRSA 2MASS All-Sky Point Source Catalog, NASA/IPAC Infrared Science Archive. http://irsa.ipac.caltech.edu/applications/Gator/
- Abt (1963) Çakırlı Ö., Ibanoǧlu C., 2010, MNRAS, 401, 1141
- Abt (1963) Çakırlı Ö., Ibanoǧlu C., Güngör C., 2009, NewA, 14, 496
- Abt (1963) D’Antona F., Ventura P., Mazzitelli I., 2000, ApJ, 543, L77
- Abt (1963) Delfosse X., Forveille T., Mayor M., Burnet M., Perrier C., 1999, A&A, 341, L63
- Abt (1963) de Jager C., Nieuwenhuijzen H., 1987, AAP, 177, 217
- Abt (1963) Demory B.-O., et al., 2009, A&A, 505, 205
- Abt (1963) Devor J., et al., 2008, ApJ, 687, 1253
- Abt (1963) Dimitrov D. P., Kjurkchieva D. P., 2010, MNRAS, 866
- Abt (1963) Drilling J. S., Landolt A. U., 2000, Allen’s astrophysical quantities, 4th ed. Edited by Arthur N. Cox. ISBN: 0-387-98746-0. Publisher: New York: AIP Press; Springer, 2000, p.381
- Abt (1963) Duquennoy A., Mayor M., & Halbwachs, J.-L. 1991, A&AS, 88, 281
- Abt (1963) Eggleton P. P., 1971, MNRAS, 151, 351
- Abt (1963) Eldridge J. J., Tout C. A., 2004, MNRAS, 348, 201
- Abt (1963) Girardi L., Bressan A., Bertelli G., and Chiosi C., 2002, A&AS, 141, 371
- Abt (1963) Hebb L., Wyse R. F. G., Gilmore G., Holtzman J., 2006, AJ, 131, 555
- Abt (1963) Hernández J., Calvet N., Briceño C., Hartmann L., Berlind P., 2004, AJ, 127, 1682
- Abt (1963) Irwin J., et al., 2009, ApJ, 701, 1436
- Abt (1963) López-Morales M., Ribas I., 2005, ApJ, 631, 1120
- Abt (1963) López-Morales M., Orosz J. A., Shaw J. S., Havelka L., Arevalo M. J., McIntyre T., Lazaro C., 2006, astro, arXiv:astro-ph/0610225
- Abt (1963) López-Morales M. 2007, ApJ, 660, 732
- Abt (1963) López-Morales M., Shaw J. S., 2007, ASPC, 362, 26
- Abt (1963) Lucy L. B., 1967, Z. Astrophys., 65, 89
- Abt (1963) Marigo P., 2002, A&A, 387, 507
- Abt (1963) Morales J. C., Ribas I., and Jordi C. 2008, A&A, 478, 507
- Abt (1963) Morales J. C., et al., 2009a, ApJ, 691, 1400
- Abt (1963) Morales J. C., Torres G., Marschall L. A., Brehm W., 2009b, ApJ, 707, 671
- Abt (1963) Mullan D. J., MacDonald J., 2001, ApJ, 559, 353
- Abt (1963) Nidever D. L., Marcy G. W., Butler R. P., Fischer D. A., and Vogt S. S., 2002, ApJS, 141, 503
- Abt (1963) Popper D. M. 1980, ARA&A, 18, 115
- Abt (1963) Popper D. M., 1997, AJ, 114, 1195
- Abt (1963) Prsa A. and Zwitter T., 2005, ApJ 628, 426
- Abt (1963) Queloz D., Allain S., Mermilliod J.-C., Bouvier J., Mayor M., 1998, A&A, 335, 183
- Abt (1963) Reid, I. N., and Gizis, J. E. 1997, AJ, 114, 1992
- Abt (1963) Ribas I., 2003, A&A, 398, 239
- Abt (1963) Ribas I. 2006, Ap&SS, 304, 89
- Abt (1963) Royer F., Zorec J., Fremat Y., 2004, “The A-Star Puzzle”, held in Poprad, Slovakia, July 8-13, 2004. Edited by J. Zverko, J. Ziznovsky, S.J. Adelman, and W.W. Weiss, IAU Symposium, No. 224. Cambridge, UK: Cambridge University Press, p.109
- Abt (1963) Schlegel D. J., Finkbeiner D. P., Davis M., 1998, ApJ, 500, 525
- Abt (1963) Shkolnik E., Liu M. C., Reid I. N., Hebb L., Cameron A. C., Torres C. A., Wilson D. M., 2008, ApJ, 682, 1248
- Abt (1963) Siess L., Forestini M., Dougados C., 1997, A&A, 325, 556
- Abt (1963) Siess L., Dufour E., Forestini M., 2000, A&A, 358, 593
- Abt (1963) Southworth J., Clausen J. V., 2005, A&A, 461, 1077
- Abt (1963) Stassun K. G., Hebb L., López-Morales M., & Prsa A. 2009, arXiv:0902.2548
- Abt (1963) Tokunaga A. T., 2000, ”Allen’s astrophysical quantities”, Fouth Edition, ed. A.N.Cox (Springer), p.143
- Abt (1963) Tonry J. and Davis M., 1979, AJ 84, 1511
- Abt (1963) Topping J., 1972, ”Errors of Observation and Their Treatment”, (Chapman and Hall Ltd.), p.89
- Abt (1963) Torres G., Ribas I., 2002, ApJ, 567, 1140
- Abt (1963) Torres G., Lacy C. H., Marschall L. A., Sheets H. A., Mader J. A., 2006, ApJ, 640, 1018
- Abt (1963) van Hamme, W., 1993, AJ, 106, 2096
- Abt (1963) Wilson R.E. and Devinney E.J., 1971, ApJ, 166, 605
- Abt (1963) Wozniak P. R. et al., 2004, AJ, 127, 2436
- Abt (1963) Young T. B., Hidas M. G., Webb J. K., Ashley M. C. B., Christiansen J. L., Derekas A., Nutto C., 2006, MNRAS, 370, 1529
- Abt (1963) Zacharias N., Monet D. G., Levine S. E., 2004, AAS, 205, 4815Z