

Nanometer-resolved collective micromeniscus oscillations through optical diffraction
Abstract
We study the dynamics of periodic arrays of micrometer-sized liquid-gas menisci formed at superhydrophobic surfaces immersed into water. By measuring the intensity of optical diffraction peaks in real time we are able to resolve nanometer scale oscillations of the menisci with sub-microsecond time resolution. Upon driving the system with an ultrasound field at variable frequency we observe a pronounced resonance at a few hundred kHz, depending on the exact geometry. Modeling the system using the unsteady Stokes equation, we find that this low resonance frequency is caused by a collective mode of the acoustically coupled oscillating menisci.
pacs
47.55.dd,43.35.+d,42.25.FxSuperhydrophobic surfaces have attracted much theoretical and experimental interest [2]. The entrapment of gas at the textured surface reduces the actual interfacial area between the solid and the liquid, which is at the origin of the distinctive properties of these materials, including the large contact angle, the low contact angle hysteresis[3], the self-cleaning effect[4], and the large hydrodynamic slip[5]. The superhydrophobic state is closely related to the shape of the microscopic liquid-gas interfaces spanning between the ridges of the texture [6]. In this letter we characterize the dynamics of these micromenisci and introduce an optical diffraction measurement that reveals their nanoscale motion. We measure in real time the optical diffraction intensity from a periodic array of micromenisci. Driving the system with an ultrasound field at variable frequency, we measure its frequency response and we identify a well-defined resonance peak with a center frequency well below the expectations for a single micromeniscus. Modeling the system using the unsteady Stokes equation and monopole interaction, we show that this frequency reduction is due to acoustic coupling between menisci.

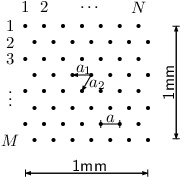
Fig.1 shows the geometry of our system. It consists of mm2 wide hexagonal and square arrays of micrometer-sized cylindrical holes (radii m or m, depth m, nearest neighbor distance m or m). The samples were fabricated from Si (110) using standard micro lithography. Subsequently, the surfaces were hydrophobized by vapor deposition of a monolayer of 1H,1H,2H,2H-Perfluorodecyltrichlorosilane, following [7]. The advancing and receeding contact angles on an unstructured surface are and . Upon immersing the samples into demineralized water, ambient air is entrapped in every hole, leaving a water-air meniscus behind that is pinned at the ridge of the hole. Owing to the hydrostatic pressure, the menisci are bent inwards with equilibrium curvature , where is the acceleration of gravity, is the water surface tension, and m is the distance between the sample and the free water surface. This implies that the system is in diffusion equilibrium and the gas pressure in the hole is the ambient pressure.


An Ar-ion laser (nm, s-polarized) is used to illuminate the sample under an angle typically between to with respect to normal incidence (see Fig.2). The diffracted intensity is measured with a photodiode positioned at a selected diffraction peak, typically chosen in the vicinity of the specular reflected beam. A broadband piezoelectric ultrasound transducer is placed at its focal distance from the sample. The ultrasound transducer is excited to emit finite wavetrains using an arbitrary function generator. The ultrasound pressure at the sample is of the order to Pa, which is small compared to a critical static pressure above which filling occurrs Pa. To check the dynamic stability of the menisci, we increased the ultrasound pressure to much larger values and observed how the intensity oscillations disappeared at a defined threshold. The ultrasound pressure is kept constant during a frequency sweep by controlling the driving voltage according to the transducers frequency response. Fig.2c shows typical raw data corresponding to the beginning of a wavetrain. After a transient lasting for a few oscillation cycles, the signal becomes sinusoidal with a constant amplitude. This amplitude is extracted from the raw data by calculating the root mean square.


The diffracted intensity depends in a highly nonlinear way on the deflection of the menisci. To assure a linear relation between the actual deflection and the measured intensity, the menisci oscillations have to be small. This can be seen in Fig.3a. While the diffracted intensity follows the sinusoidal driving pressure at low driving amplitudes (solid line), it is distorted at larger driving amplitudes (dashed line). Prior to an experiment, we reduce the ultrasound pressure until the undistorted sinus is observed.
To find the magnitude of the corresponding meniscus deflections, we consider the optical diffraction of the sample. In the Fraunhofer limit, the diffracted intensity is proportional to the intensity scattered by a single unit cell, and for each unit cell, the scattered intensity is governed by the interference of the elementary waves emitted from the cell volume [8]. In our case the incident angle is large and no light reaches the bottom of the holes such that the interference takes place between the waves emitted from the plane silicon surface and the waves emitted from the meniscus. Qualitatively, as the meniscus is deflected – consider the position of the apex of the meniscus – the intensity of a diffraction order (with diffraction angle incident angle) changes sinusoidally with a period , where is the refractive index of water. To analyze these simple observations in detail, we performed a diffractive optics calculation using the multilayer rigorous coupled wave analysis in the formulation of [9]. This method allows for calculating an exact solution to the Maxwell equations for the optical response of arbitrary periodic surface profiles. In Fig.3b we show the resulting diffraction intensity as a function of the meniscus deflection. The typical distance between two adjacent peaks corresponds to the period evaluated from the simple Fraunhofer arguments above. The result shows that the diffracted intensity is indeed linear in the meniscus deflection in a range around the meniscus equilibrium position and we find nm. Note that the extent of the linear range depends on the incident angle . It is larger for larger incident angles, as can be seen readily from the simple expression for . Thus, the large angles that are used in experiment allow for large meniscus oscillations. For incident angles above the angle of total reflection between water and air , in addition the relative contribution of the menisci to the scattered intensity is large.
The theoretical result for the linear range is the key to convert the measured intensity variations into absolute meniscus deflections. Since we have to assure linearity between intensity and meniscus deflection at all ultrasound frequencies, the peak of the resonance curve shown in the following has the height . The slope of the linear range together with the relative noise of the photodiode determines the resolution of the deflection measurement. It is of the order 1nm under given conditions.
Fig.4 shows a typical measured frequency response. The sample displays a single resonance at kHz. Similar curves were obtained for all samples. Table 1 shows that the observed resonance frequency increases both with increasing nearest neighbor distance and with decreasing hole size.

| pattern | [kHz] | [kHz] | [kHz] | ||||
|---|---|---|---|---|---|---|---|
| 3 | 15 | H | 66 | 76 | 805 | 159 | 1535 |
| 3 | 15 | S | 67 | 67 | 805 | 170 | 1775 |
| 3 | 25 | H | 40 | 46 | 805 | 258 | 23020 |
| 3 | 25 | S | 41 | 41 | 805 | 275 | 24020 |
| 2 | 15 | H | 66 | 76 | 1433 | 346 | 28520 |
| 2 | 15 | S | 67 | 67 | 1433 | 368 | 29020 |
| 2 | 25 | H | 40 | 46 | 1433 | 549 | 40020 |
| 2 | 25 | S | 41 | 41 | 1433 | 584 | 41020 |
To understand the observations quantitatively, we consider first the response of a single meniscus under the influence of the pressure field , where is the ultrasound frequency, is the ambient pressure and is the amplitude of the ultrasound pressure. Since , as follows with the values evaluated above, we approximate the meniscus as flat in equilibrium and its deflections as parabolic . The parabolic shape implies that the curvature is uniform up to giving right to the Laplace law. As described in [10], the smallness of the deflections , and the high frequency of the oscillations ( kinematic viscosity), allow us to omit the non-linear term in the Navier-Stokes equation and hence the dynamics of the system is governed by the unsteady Stokes equation. The system can then be described as a harmonic oscillator
| (1) |
The transfer functions and account for the inertia and the viscous damping due to the oscillatory flow fields. All quantities are non-dimenionalized , and . Since polytropic and thermal dissipative effects [11] can be neglected, the potential term reduces to a dimensionless spring constant . The first term with the ambient pressure is due to the isothermal compression of the gas and is negligble throughout this work, and the second term with the surface tension is due to the surface energy of the liquid-gas interface. The computation of and is performed by solving the unsteady Stokes equation in cylindrical coordinates with classical no-slip and free slip boundary conditions at the solid-liquid and the liquid-gas interface, respectively. A detailed account of the calculations will be given elsewhere [12]. While analytical expressions can be found both for the high and for the low frequency limit, and have to be computed numerically in the intermediate frequency range , which is relevant for the present experiments. The dash-dotted line in Fig.4 shows the solution for a m hole with physical parameters of water kg/m3, m2/s, N/m and ultrasound pressure Pa as used in the respective experiment. The obtained resonance frequency is approximately five times larger than the one observed experimentally. Clearly, the single meniscus theory fails to describe the dynamics of the system.
To resolve the discrepancy, we consider the dynamic coupling between the menisci. As the menisci oscillate in the external pressure field, they emit pressure waves that affect the other menisci. Denoting the non-dimensionalized distance between the -th and the -th meniscus by , the additional force acting on the -th meniscus can be expressed in terms of a multipole expansion , where is the deflection amplitude of the -th meniscus (see e.g., [13], [14]). To analyze the dynamics of the entire meniscus array, we extend the equation of motion of the single meniscus, Eq.(1), by the additional forces generated by all other menisci keeping only the monopole term. We arrive at the coupled equations of motion
| (2) |
The coupling term gives rise to an additional effective mass, which reduces the resonance frequency, as required. We solve Eq.2 for the individual deflection amplitudes by numerical matrix inversion. From the result we evaluate the mean and the root mean square , deflection amplitude (see discussion below). The results are shown in Fig.4 with the solid and dashed line, respectively. For the moment note that both curves are nearly identical up to frequencies well above the lowest resonance. The theoretically obtained resonance frequency kHz is in excellent agreement with the experimental data, showing that collective effects are crucial for the dynamics of the system. Moreover, the good agreement shows that monopole interaction is effective beyond its obvious range of applicability where .
As can be seen in the inset of Fig.4, the theory overestimates the amplitude of the resonance, presumably due to the neglectance of the bulk dissipation that arises in the collective flow field. Second, and more interestingly, the theoretical data for the root mean square displays a second resonance at 290kHz which is absent in the experimental data. To understand the latter effect we plot the calculated amplitude and phase for the two lowest resonances as a function of the meniscus position within the array in Fig.5. For the lowest resonance all menisci oscillate essentially in phase, whereas at the second resonance, the menisci in the center of the array and the ones along the edge oscillate 180∘ out of phase and the amplitude displays a node at the ring shaped boundary between the two regions. To evaluate the diffraction intensity for such arrays of non-identical scatterers, we note that the variation of the meniscus deflection gives rise to phase differences between the waves emitted from different unit cells that are much smaller than – owing to the particular experimental condition assuring that the diffracted intensity is linear in the meniscus displacement. Extending the above Fraunhofer picture, one shows that the diffraction intensity is linear in the individual menisci deflections, and thus the experiment measures the mean deflection. Thus, we have to compare the experiment to the theoretical mean deflection, where the second resonance is indeed nearly invisible. Note that the expression for the mean as given above accounts for the phase since the deflection amplitudes are complex.


The reduction of the resonance frequency predicted by the theory is confirmed for all surface patterns investigated in experiment (see Table 1). Since the coupling between the menisci is inversely proportional to the distance, the frequency reduction is more pronounced for smaller lattice constants. Similarly, it is more pronounced for the hexagonal lattices than for the square ones, owing to the larger number of nearest neighbors. At this moment we have no clear explanation for the slight overestimation of the resonance frequency for the samples with smaller radius.
In conclusion, highly mobile micromenisci are present at the textures of superhydrophobic surfaces. Their dynamics are determined by collective modes with resonance frequencies that are much smaller than the resonance frequency of a single isolated meniscus. Superhydrophobic surfaces with particularly large contact angles or large slip length are expected to show the lowest resonance frequencies. Optical diffraction has proven an accurate tool to study superhydrophobic surfaces and their nanoscopic hydrodynamics. It remains a challenge to extend the optical diffraction technique to the accurate study of the microscopic shape of the menisci, presumably by measuring also the angular dependence of the diffraction pattern and subsequently solving the inverse diffraction problem, following upcoming ideas in theoretical diffractive optics.
We gratefully acknowledge stimulating discussions with A. Prosperetti and M. Sbragaglia and experimental support by N. Bremond. This work was supported through the DFG (Grant No. MU 1472/4).
References
- [2] D. Quéré, Rep. Prog. Phys. 68, 2495 (2005).
- [3] A. Lafuma and D. Quéré, Nat. Mater. 2, 457 (2003).
- [4] A. Nakajima et al., Langmuir 16, 7044 (2000).
- [5] P. Joseph et al., Phys. Rev. Lett. 97, 156104 (2006).
- [6] C. Journet et al., Europhys. Lett. 71, 104 (2005).
- [7] T. M. Mayer et al., J. Vac. Sci. & Tech. B 18, 2433 (2000).
- [8] M. Born and E. Wolf, Principles of Optics (Cambridge University Press, 1999), 7th ed.
- [9] M.G. Moharam et al., J.Opt. Soc. Am. A 12, 1077 (1995).
- [10] L. D. Landau and E. M. Lifshitz, Fluid mechanics (Pergamon Press, Oxford, 1959).
- [11] X. M. Chen and A. Prosperetti, J. Acoust. Soc. America 104, 1389 (1998).
- [12] H. Rathgen et al., in preparation.
- [13] V. Leroy et al., Eur. Phys. J. E 17, 189 (2005).
- [14] N. Bremond et al., Phys. Rev. Lett. 96, 224501 (2006).